The half marathon has passed. The training this year went well, with no running related injuries to speak of at the point of writing, although I did get food poisoning a week before the race and I missed my last long run. I have learned a lot over the course of the year, which has helped get me to this point. The actual race was a totally different experience, it rained for the first few kilometres, I had stomach cramps and I suffered intense muscles spasms, none of which happened in over a thousand kilometres of my training over the course of the last two (2) years.
Race Day
Race day 2024 was very different than I expected. I felt confident due to all my training. The rain was an annoyance, but one easily overcome by a running jacket (if I race again I’ll get a opaque poncho).
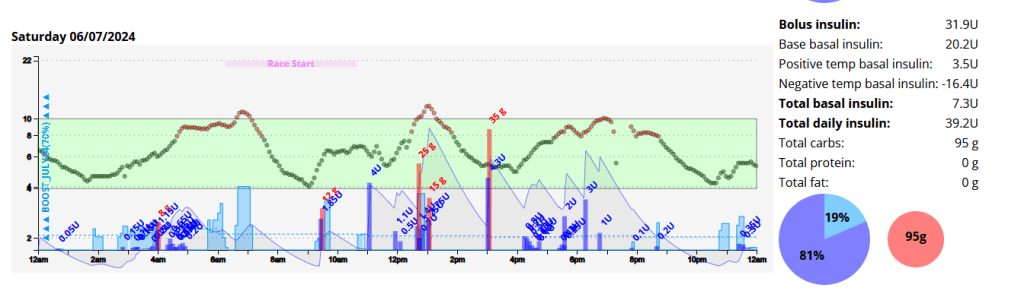
I woke up at 03:50am with little sleep and a blood glucose of 5.8 mmol/l. This crept up steadily, likely due to cortisol and adrenaline. By race start time I was 9.0 mmol/l with 0.9 units of insulin on board (IOB). Due to the IOB I ate about one third of a Cliff Bar (18g of carbohydrates) which in hind-sight was a mistake.
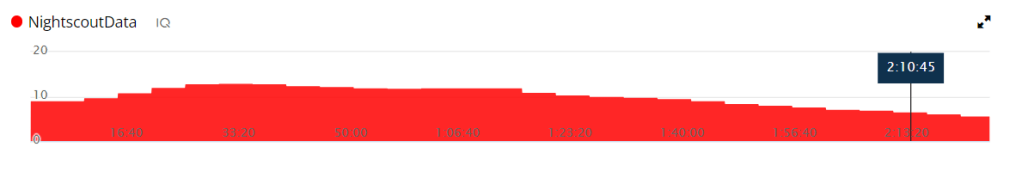
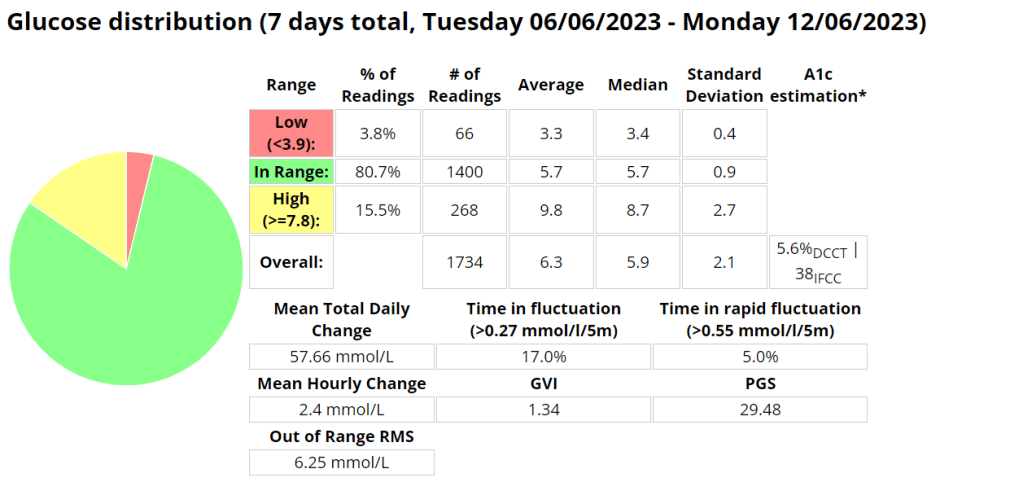
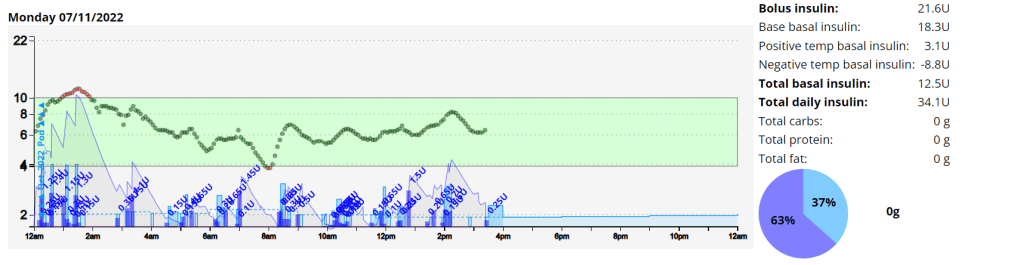
Nightscout graph for the entire day.
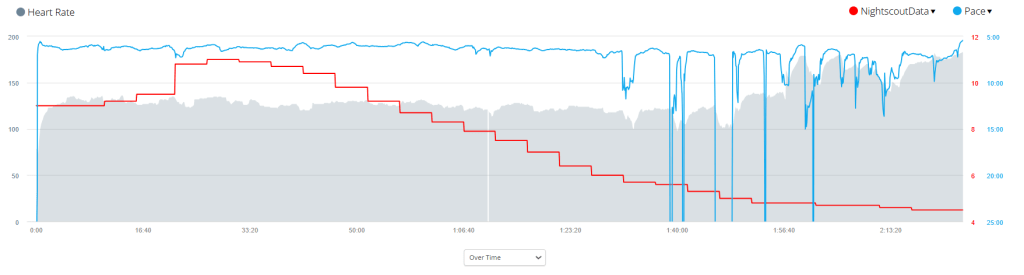
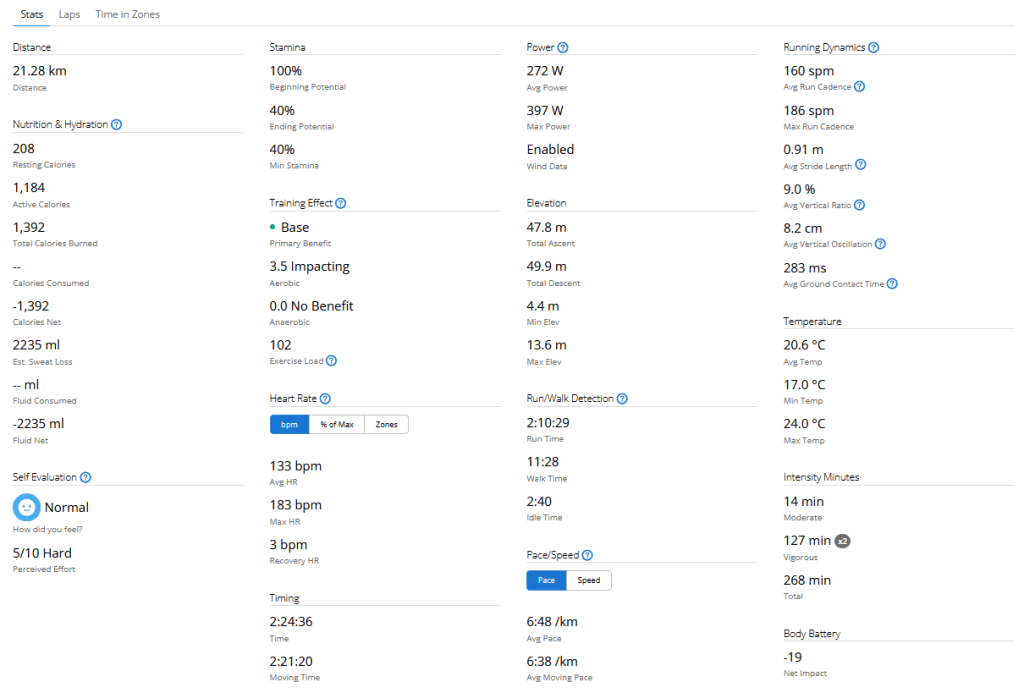
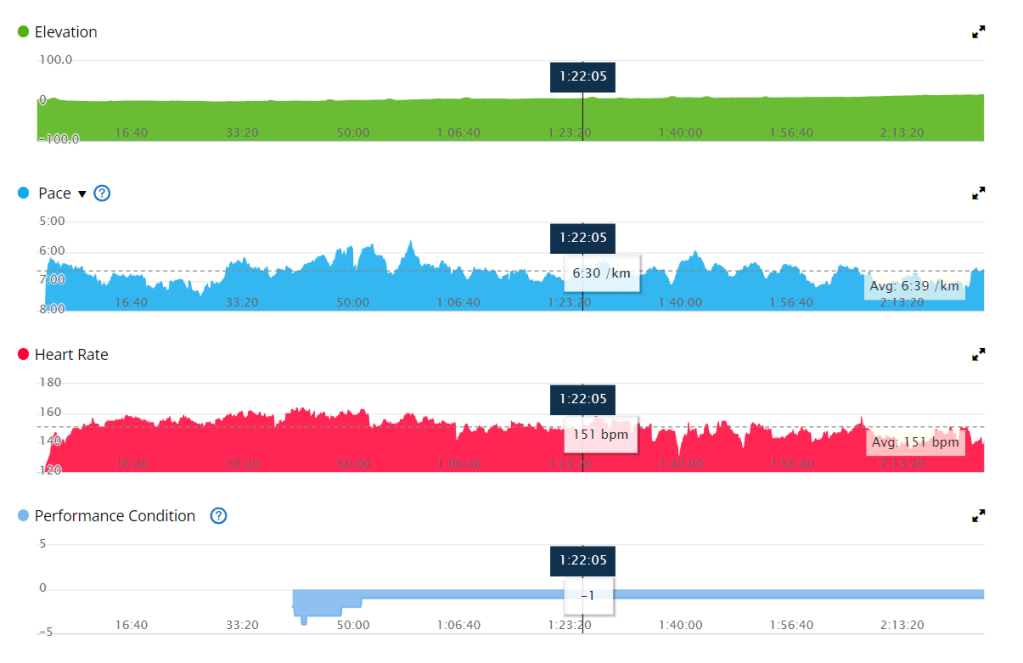
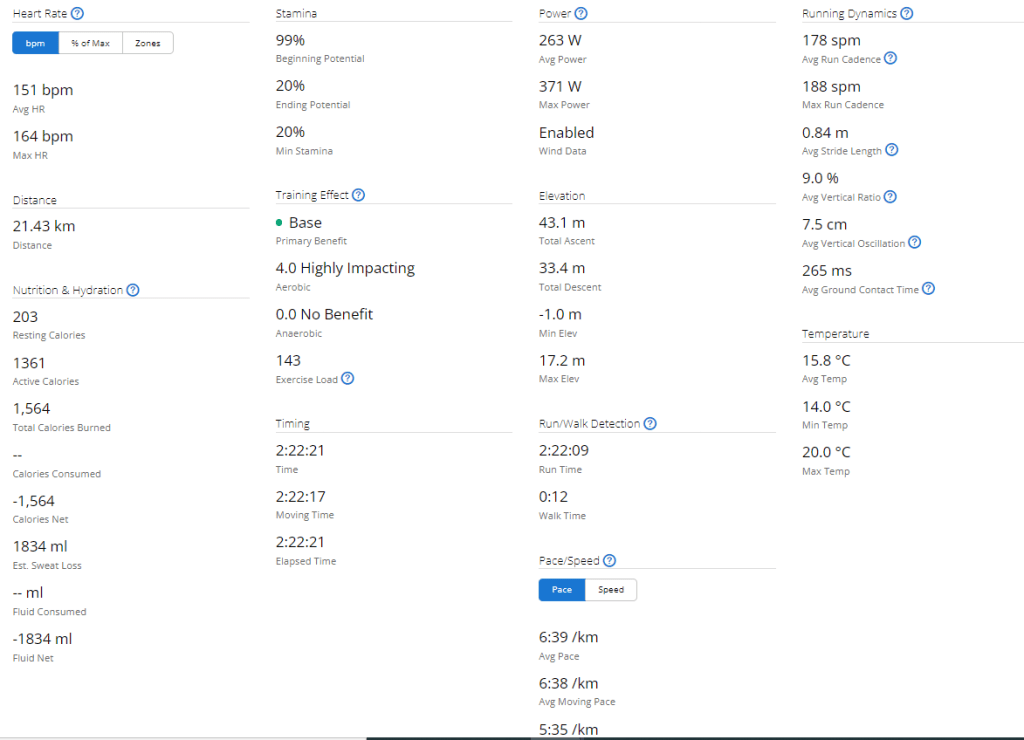
Due to the inclement weather my Garmin didn’t pick up my heart rate on my watch consistency, or perhaps even accurately. I found my Garmin advising I was running at approximately 130 BPM even though I felt I was pushing quite hard. I got a personal best (61 minutes) for the first 10 kilometres.
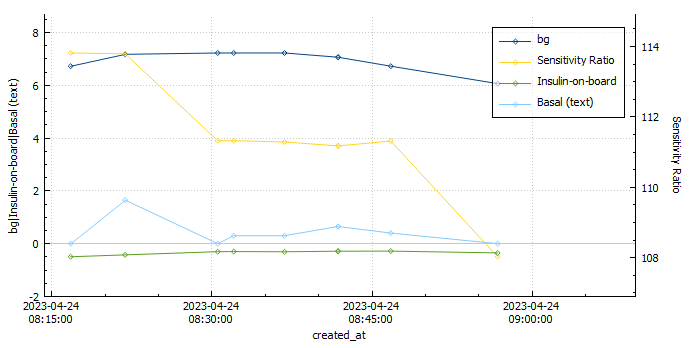
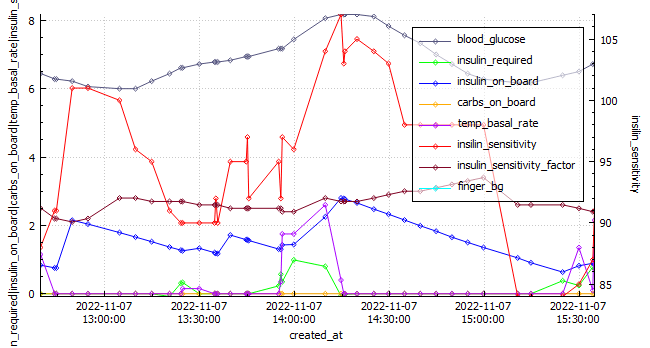
AAPS graph for race day.
Label
Race Day
Average during Training
Start Time
06:23 am
Distance
21.2km
Average HR
133 BPM
Standard Deviation
2.3 mmol/l
0.8
Coefficient of the variation
31.9%
11.3%
Blood Glucose – start
9 mmol/l
6.5
Blood Glucose – min
4.4 mmol/l
Blood Glucose – max
11.1 mmol
Blood Glucose – average
7.4 mmol/l
6.7
Time in Range (3.9-7.8)
51%
71.9%
Insulin on board
0.99
0.1
Race day compared to training was wildly different, I will need to analyse the data and come up with a better race day strategy.
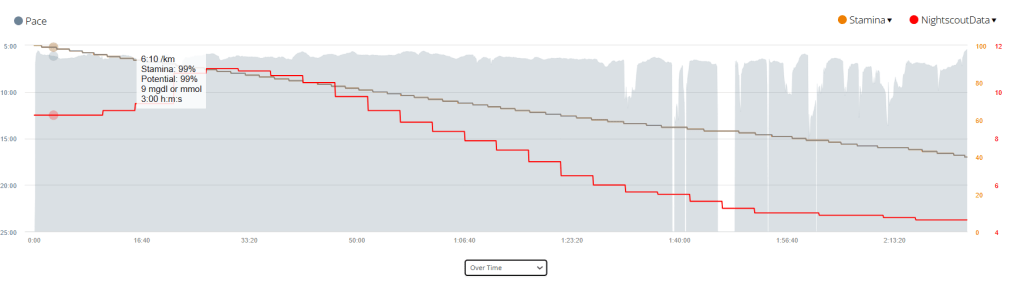
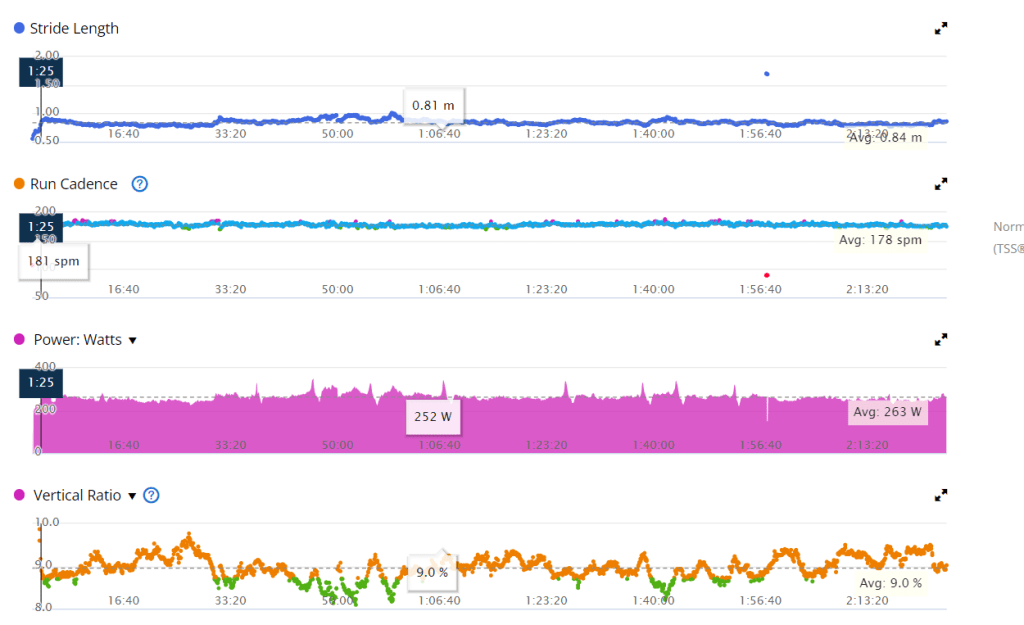
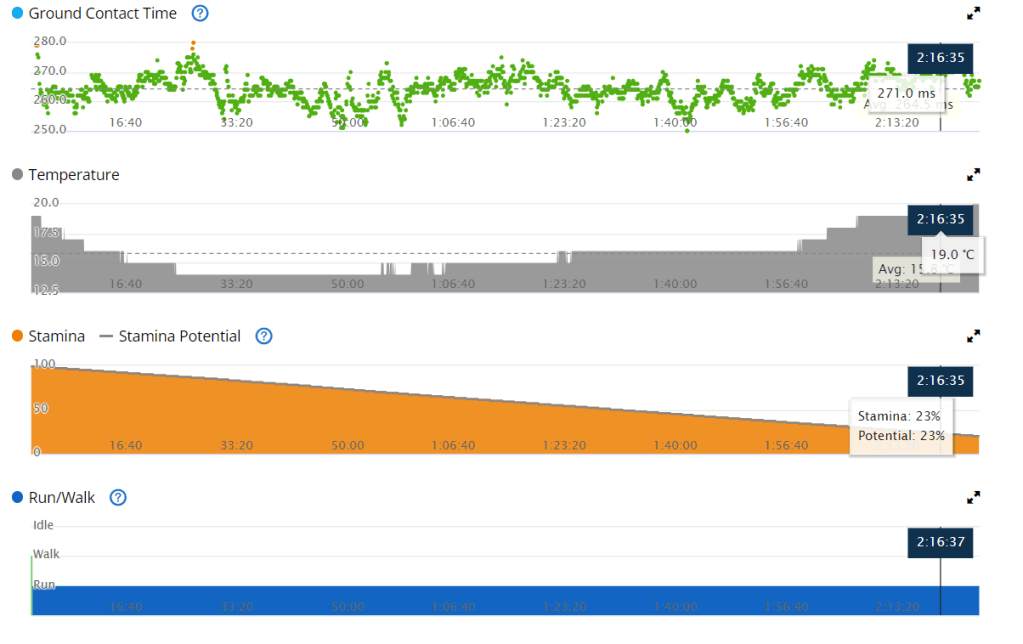
Time vs. Pace with a Stamina and Blood sugar overlay. Time vs. Heart Rate with a Pace and Blood sugar overlay. All Garmin Race Stats
Training
I’ll add the link once all data is processed.
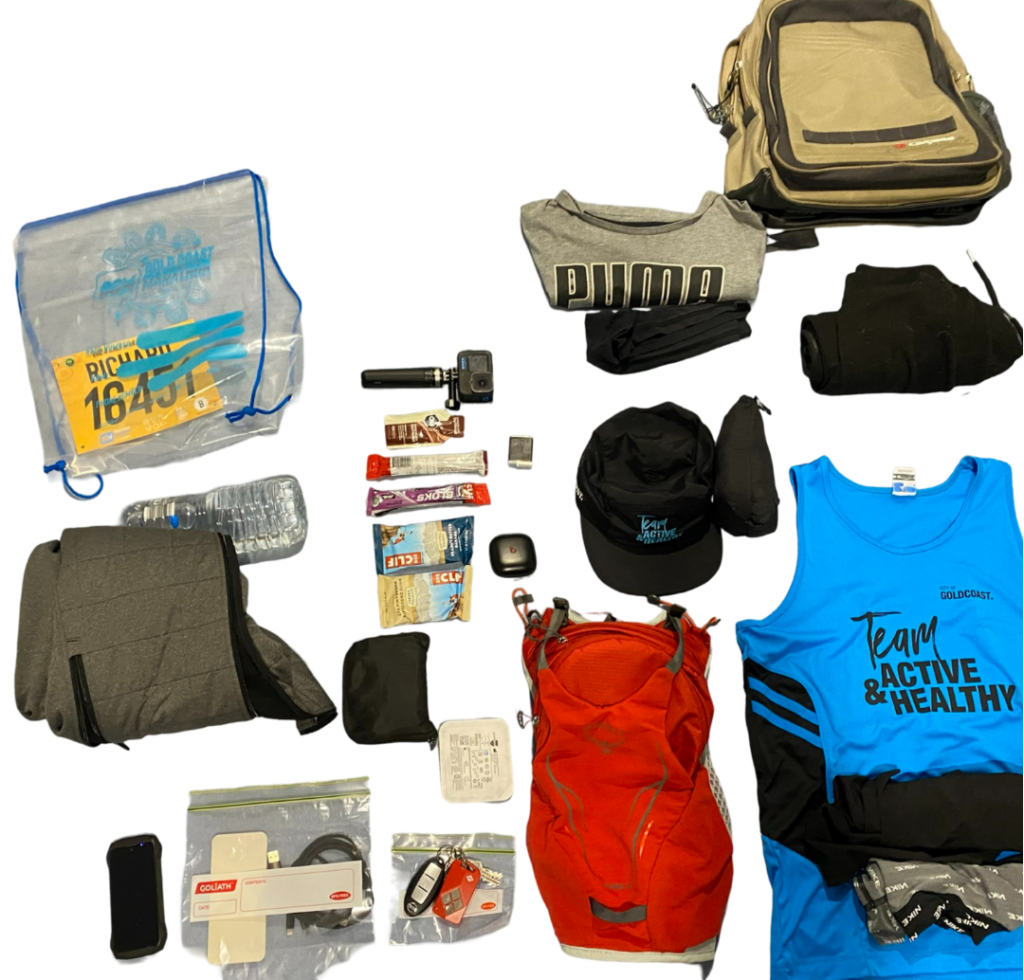
Equipment
I try to come prepared for all possibilities.
This year I spend a lot of time finding the perfect shoe for my unique requirements, namely that I supinate on my right foot due to an atrophied right calf muscle. In my testing, the Brooks Ghost performed the best, allowing me to run any distance with no pain or discomfort.
Final Thoughts
The food poisoning caused an electrolyte balance, which resulted in muscle cramps on race day. This was something I had not experienced during my training, an I was ill prepared for it.
My sugars were higher than during training again, and if I do this again I will refrain from coffee or any carbs prior to the event.
Recently my diabetic inspiration David Burren wrote an article about his results using an Artificial Pancreas System (APS). In this article he compared his results to those of 2019 CGM study of people without diabetes. His results are far better than my own, but I was interested to see how I stack up.
*The last two (2) weeks of data with me being back in the gym.
GMI – Glucose Management Indicator
TIR – Time in Range (3.9-10 / 70-180)
TITR – Time in Tighter Range (3.9-7.8 mmol/l / 70 -140 mg/dL)
CV – Coefficient of variation
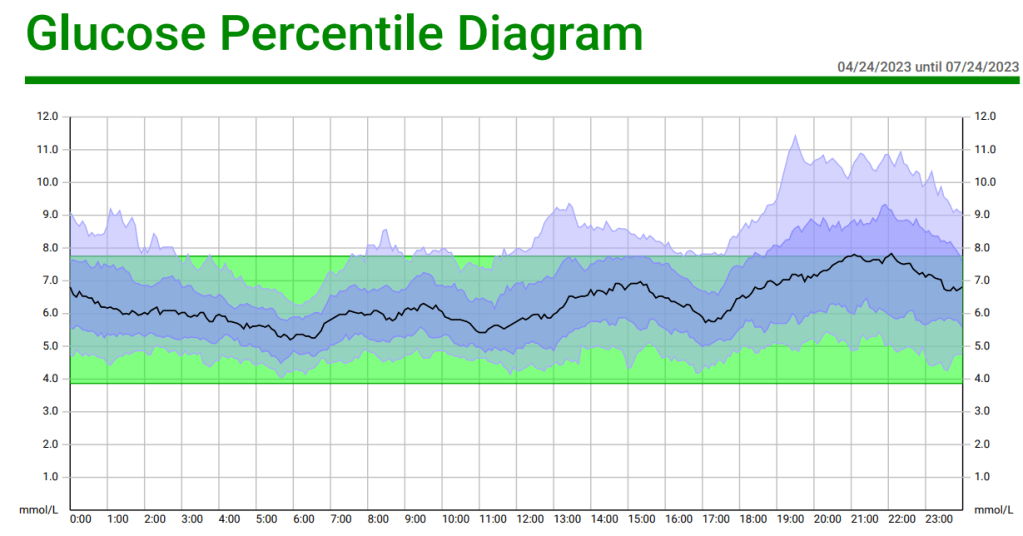
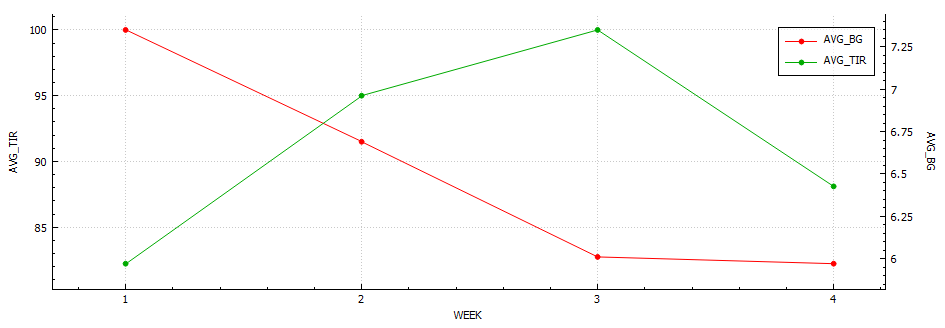
Analysis of current results
When analyzing my results on a glucose percentile diagram we can quickly see that the area I need the most work on is in the evenings. Making healthier choices here should have the most profound effect going forward.
Goals
I want to aim for an SD of less than 1.2 and an average BG of less than 6 to have a CV of 20% or less. This is considered to be an optimal range for non-diabetics. This equates to a TITR of around 90%.
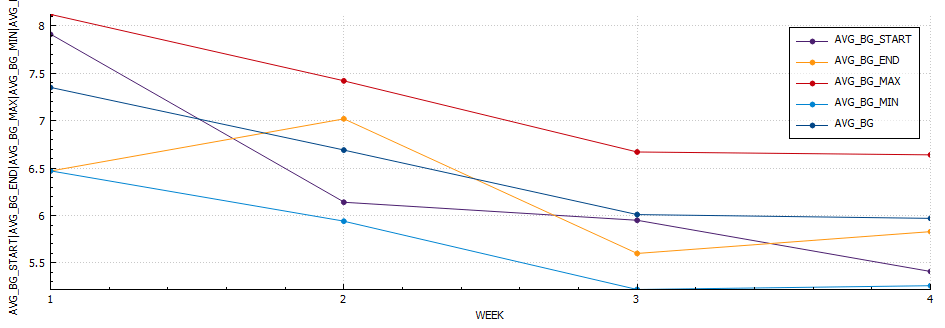
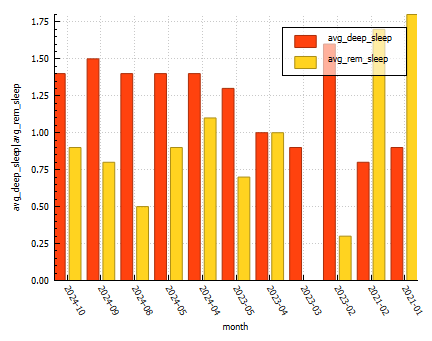
The Dawn Effect and Blood Glucose: When we wake up in the morning, our body experiences a surge of hormones, commonly referred to as the “dawn effect” or “dawn phenomenon.” This natural hormonal response can lead to an increase in blood glucose levels even before we consume any food or engage in physical activity. Cortisol, growth hormone, and other hormones play a role in this phenomenon. For individuals with diabetes, the dawn effect can pose challenges in maintaining stable blood glucose levels, especially during a race. The hormonal surge may contribute to higher blood sugar levels, making it crucial to adjust your diabetes management routine accordingly.
This graph shows the average blood sugar during training vs. my blood sugar from the Gold Coast Half Marathon.
Training vs. Race
Average distance (km)
Average time (min)
Average HR (bpm)
TIR (3.9 – 7.8)
Average Blood Glucose (mmol/l)
Coefficient of variation (%)
Pace
Training
14
92
156
92%
5.8
14
6:40
Race
21.4
140
151
21.4%
9.9
22.54
6:39
This table shows the average metrics during training vs. the same metrics during the Gold Coast Half Marathon.
Blood Glucose Management: Pre-Race Strategies: To optimize your blood glucose levels during a race, careful planning and preparation are key.
Here are some strategies to consider:
Race Day Automation: If you use an insulin pump or automated insulin delivery system, consider setting up a race day automation plan. Gradually reducing your insulin on board (IOB) and raising your blood sugar target before the race can help mitigate the impact of the dawn effect.
The automation I use if I plan on exercising at 06:30am. I use 05:00 – 06:00 so that if another automation is active at 05:00am there is opportunity for this automation to run after that one completes.
Timing of Pre-Exercise Snacks: To align the digestion of carbohydrates with the energy demands of the race, it is important to time your pre-race snack appropriately. If your blood glucose is around 5 mmol/l before starting, consuming a carbohydrate-rich snack approximately 15 minutes before the race can help maintain stable blood glucose levels, in my experience cliff bars have the perfect amount of nutrients for a long run.
Managing Blood Glucose During the Race: Once the race begins, various factors can influence your blood glucose levels.
Here are some considerations to keep in mind:
Listen to Your Body: Pay attention to any signs or symptoms that may indicate fluctuations in your blood glucose levels during the race. Feeling lightheaded, fatigued, or experiencing unusual thirst may indicate the need for carbohydrates. Regular Blood Glucose Monitoring: Carry a portable blood glucose meter to monitor your levels throughout the race. This will enable you to make timely adjustments and take appropriate remedial actions when necessary. Carbohydrate Consumption: Plan to consume carbohydrates during the race to maintain your blood glucose within a desirable range. Experiment with different forms of carbohydrates, such as gels, sports drinks, or energy bars, to find what works best for you. Remember to consider the impact of any exercise-induced insulin sensitivity and adjust your carbohydrate intake accordingly.
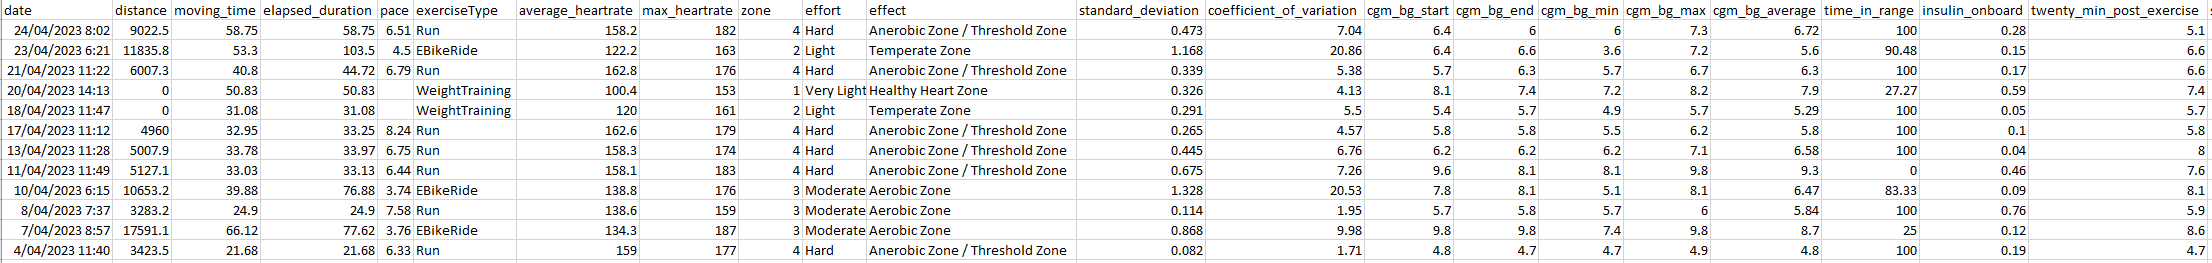
Data Extract from AAPS.
Post-Race Recovery: Upon crossing the finish line, it’s essential to prioritize your recovery and address any pain or discomfort that may have emerged during the race. Be mindful of the following:
Musculoskeletal Discomfort: Races can place significant stress on your body. Pay attention to any pain or discomfort in your muscles, joints, or tendons. Consult with a healthcare professional if necessary to address any post-race injuries. Blood Glucose Check: After the race, continue monitoring your blood glucose levels as they may fluctuate due to post-exercise hormonal responses. Adjust your post-race nutrition and insulin dosages accordingly.
Conclusion: Participating in a race as a person with diabetes requires careful consideration of blood glucose management strategies. Understanding the impact of waking up on hormonal levels, adjusting your approach accordingly, and incorporating remedial actions during the race are crucial steps towards maintaining stable blood glucose levels. By staying vigilant, prepared, and responsive to your body’s needs, you can conquer the challenges of a race while managing your diabetes effectively.
References:
American Diabetes Association. (2021). Diabetes and Exercise. Retrieved from https://www.diabetes.org/healthy-living/fitness/exercise-and-type-1-diabetesGupta, L., Khandelwal, D., Singla, R., Gupta, P., Kalra, S., & Dutta, D. (2017). Dawn Phenomenon and Its Impact on Blood Glucose Control. Indian Journal of Endocrinology and Metabolism, 21(6), 901–909. doi: 10.4103/ijem.IJEM_284_17
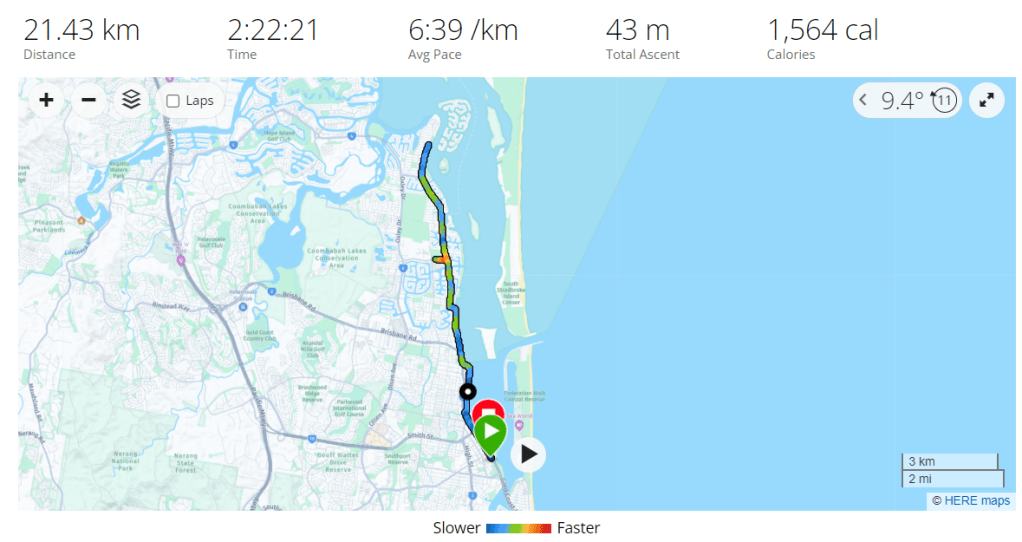
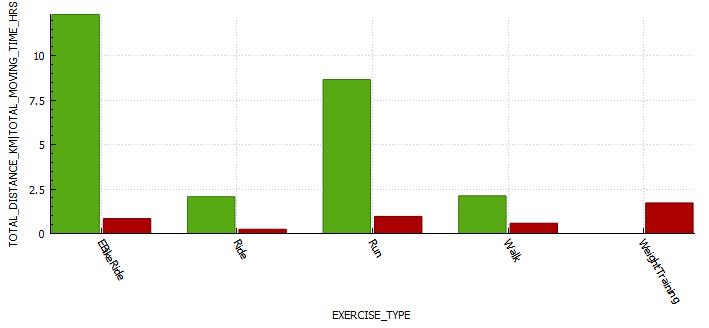
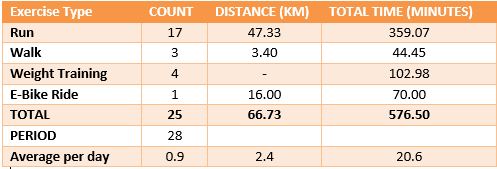
Exercise stats from Garmin
Equipment
Equipment Name
Note
Osprey duro 6 – Hydration pack
This hydration pack is a great option for long runs or cycles. It holds 1.5 liters of water, which is more than enough for most people to drink on a 2+ hour activity. It also has multiple pockets at the front of the vest, which allow you to store food, your phone, and your blood glucose meter. This makes it easy to access your essential items while you’re running or cycling.
Glucose gels
My general rule of thumb is bring at least twice the amount you expect you will need.
Cliff bar
The cliff bar was a new addition to my nutrition. These bars seemed to work well to stabilise blood glucose and I required no additional carbs for most runs between 14-18km.
Blood glucose meter + extra strips
If my sensor were to fail or I was to become dehydrated enough that my CGM reading was inaccurate I wanted to be able to assess my blood glucose.
Dexcom
Continuous glucose monitor. I ensured this had at least 24 hours to settle before the race. This way readings would more accurate.
Android APS phone
The phone that contain my artificial pancreas system.
Onmipod Dash
Bluetooth enabled insulin pump, allowing me to use Android APS. I ensured that I inserted the pod at least a day before the race so I had enough time to identify issues.
Brooks Ghost shoes
A comfortable pair of shoes you have tested and run in prior to the race. I still developed blisters so its imperative you get the correct size.
Asics running socks
A comfortable pair of socks.
Hat
A hat to ensure I don’t burn.
earbuds
To enjoy some music while I run.
Training
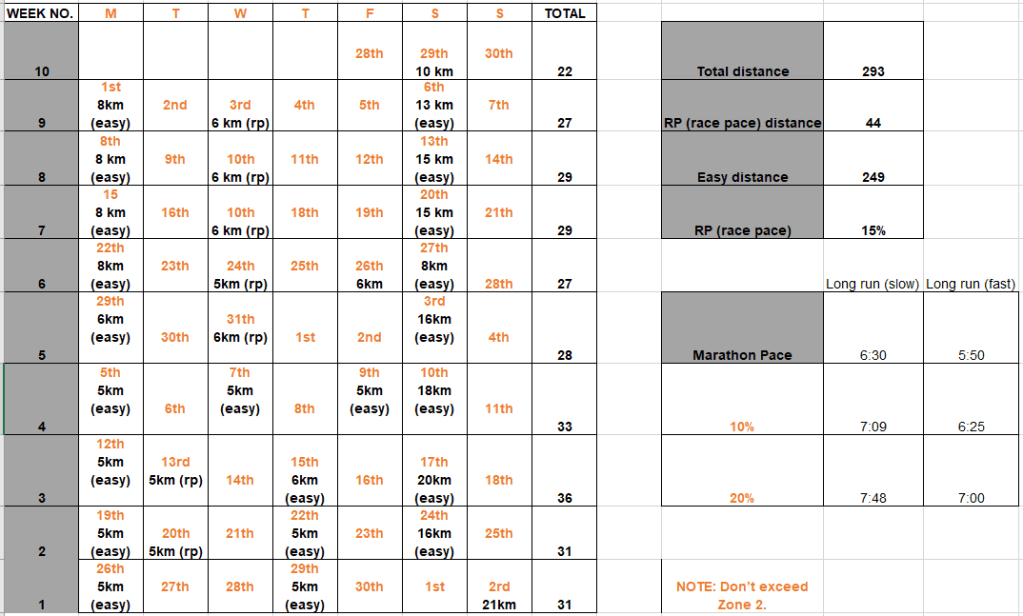
To prepare for the Gold Coast Marathon I did the following exercise;
Week 10 is done and dusted. During my long run on Friday I decided to use the New Balance Fresh Foam More V3 running shoes to see if that improved my experience. This is because they are the most padded shoes I own, and the small 3 mm drop is supposed to reduce the risk of injury. Unfortunately this only reduced the pins and needles, but I must have laced them poorly as I got a few blisters. I also started my run way to quickly, and if I cant maintain a few zone 2 runs I am not going to work my slow twitch muscle fibers and improve my fitness fast enough to enjoy this race. These were shoes I had used before so I think it was down to the lacing and running technique. The last run of the week was a 8 km zone 2 run on the treadmill. This was actually the first of run week 9, but I decided to mountain bike ride on the Monday as it was raining on the Sunday so I switched them. For this run I used the New Balance 1080v12 shoes, and this was a great run. Not sure if it was due to treadmill suspension but every second felt good, despise a hypo half way though.
Exercise stats
Blood glucose stats
My experience with AIMI AI has not been a good one, for some reason I keep going on the blood sugar roller coaster and the system either gives too much or too little insulin. I am eating way less at the moment so I would expect more control. I’m back to Boost once this Pod expires to try and improve my glucose values. Probably not a great time to be trying a new system while increasing my training.
Measurements
Weight 75.6 kg
Week 9 (01st – 07th)
In an attempt to reduce the pins and needles I was experiencing I got some 2XU vector compression socks. This seemed like it may have improved the experience somewhat, until I started wearing my Brooks Ghost shoes. During the 8km run with the Ghosts I experienced no issues whatsoever. Blood sugars with AIMI seemed to be much better this week, except for a few isolated incidences where AIMI provided too much insulin. Since AI (or in this instance machine learning) requires data to build its model accurately, its seems likely that I needed more data in order for the system to perform better.
Exercise stats
Blood glucose stats
AIMI – ModelAI
Measurements
Week 8 (08th – 14th)
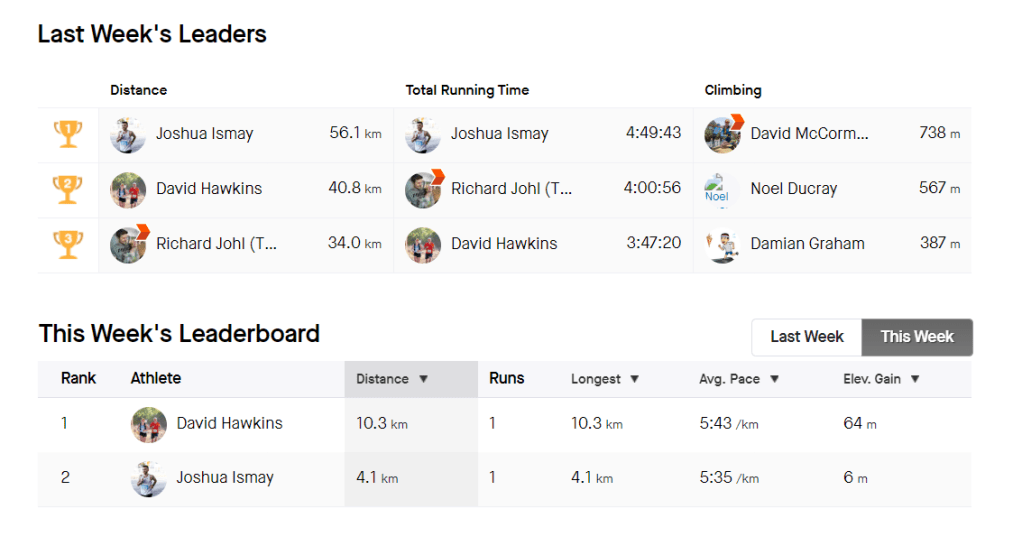
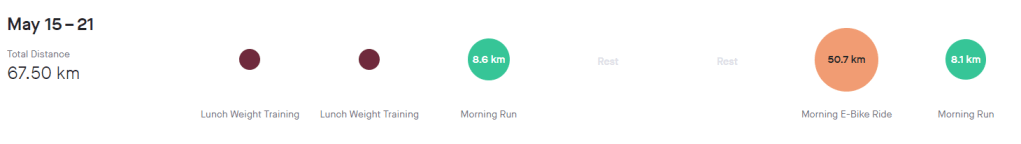
This week was was a big training week with the start of the extended distance (15-20 km) runs in the training plan. I have bee using the Ghosts more and although I no pain during my runs, I had quite a few blisters afterward the 15 km run. No vector socks this week. The long run was a little difficult to manage with my sugars requiring (22g+25g+28g) 75 g of carbs to stabilize for the run. I wasn’t expecting that. Quite a few more hypers that lasted longer than I had hoped. I think this is my last week of testing AIMI-AI before heading back to good old Boost. I like the fact I can very accurate with IOB with Boost, although my difficulty is due to AIMI adapting so well with all the changes. I also found myself on my Strava groups leader board twice 🙂
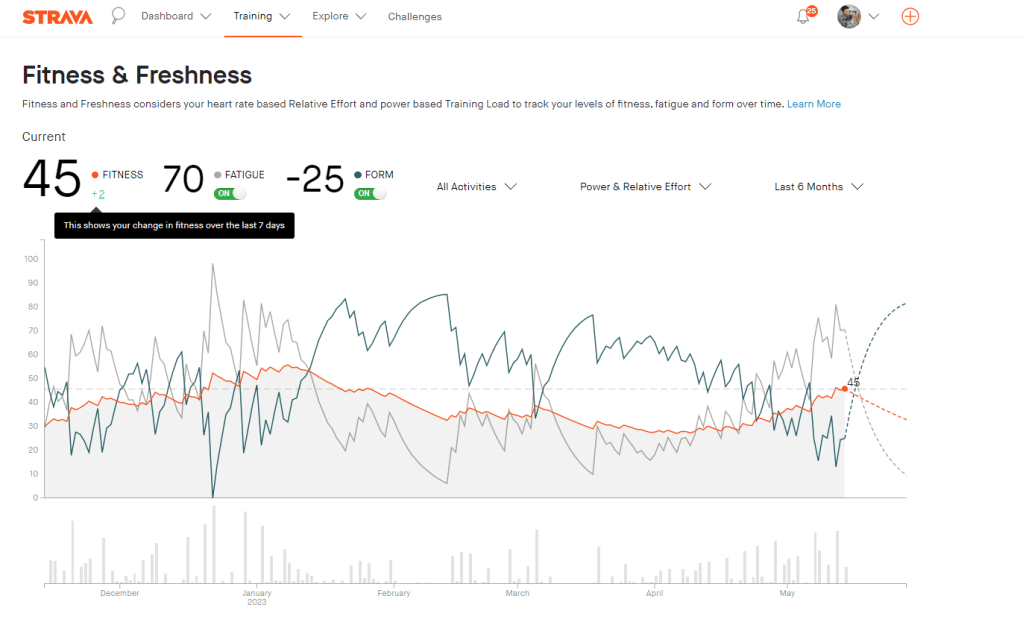
Its been interesting to see the difference between how Garmin and Strava track fitness, with Garmin using Vo2 max as its measurement and providing a stamina metric.
Exercise stats
Fitness
Below is a post highlighting the difference between the two systems in relation to fitness metrics.
The Strava fitness metric seems to build with every run, providing some motivation to keep hitting those zone 2 runs. I am still 10 fitness points lower than I was in December. I am currently averaging 6 points every two weeks. If keep at this pace I should reclaim my fitness in about 23 days, or by the 6th of June. So that leaves almost the whole of June to work on improving fitness.
Garmin fitness metrics
The Garmin fitness metric is Vo2 max, or maximal oxygen consumption. This refers to the maximum amount of oxygen that an individual can utilize during intense or maximal exercise. This measurement is generally considered the best indicator of cardiovascular fitness and aerobic endurance.
Blood glucose stats
AIMI – ModelAI
Measurements
Week 7
This week I decided to shake things up, do a little mountain biking in New South Wales and also travel to new beach locations for my runs. It was amazing and I had an incredible time. I have also been asked to be a front runner for the Gold Coast Marathon team training sessions at HOTA.
Exercise stats
Blood glucose stats
AIMI – ModelAI
Measurements
Week 6
This weeks long run was a little harder than usual, but it did have a beautiful view. I wanted to do a 15km but unfortunately was cut short to 14km. My feet felt good and good issues with blistering with the Ghosts. I also did a park run which almost ruined everything as my tendon issue faired up with the lack of a proper warm up. I was a little slower than I thought as I only managed 5min/km for 2,5km before burning out.
Exercise stats
Blood glucose stats
AIMI – ModelAI
Measurements
74kgs
Week 5
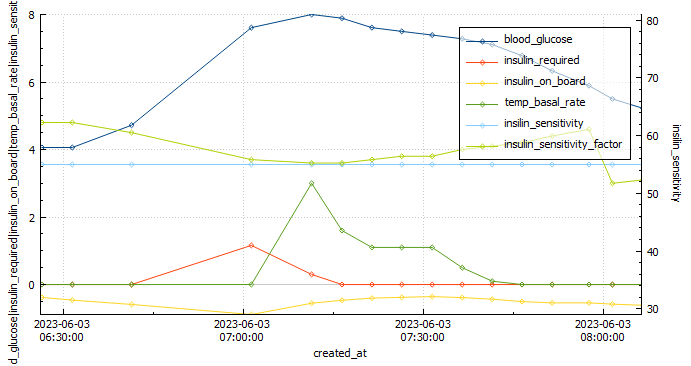
This week’s long run was fantastic! I completed the full 16 km without experiencing any pain or discomfort. As an experiment, I decided to try a Cliff Bar for the first time during my run, and I think I may have found my new go-to snack for long-distance running. I started my run with a blood glucose level of 4.1 mmol/l and waited approximately 20 minutes after consuming the bar before getting started. This slight delay caused a small spike in my glucose levels at the beginning of the run. To mitigate this, I plan to wait only 15 minutes before starting my next run.
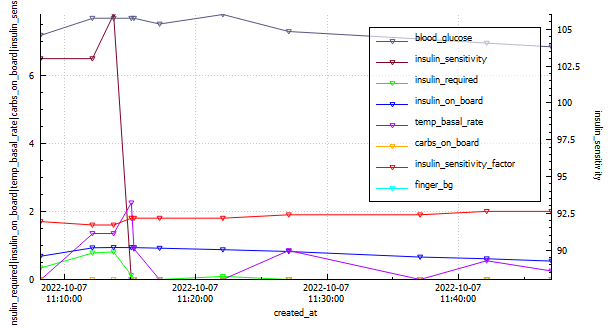
Analyzing the graph below, we can observe when the Automated Insulin Delivery Systems (AAPS) kicked in to provide a temporary basal rate adjustment to lower my blood sugar levels. Since I set a slightly higher temporary target of 8.3 mmol/l, AAPS registered my insulin sensitivity to be around 55% less than my standard needs. AAPS responded perfectly, gradually bringing my glucose levels down to a comfortable 5.2 mmol/l by the end of the run.
Overall, this run was a success, and the combination of the Cliff Bar and the effective response of AAPS made it even better. I’m excited to continue fine-tuning my routine and exploring the benefits of different strategies to optimize my long-distance running experiences.
Exercise stats
Blood glucose stats
AAPS – Boost 3.9
Measurements
74 kgs
Week 4
This week was a bit of a mixed bag for me as far as my diabetes management goes. On the one hand, I had a great park run, where I managed to run a respectable 5:10 min/km for the 5km duration. This landed me in second position overall for this particular park run.
My long run started off very strong, but towards the end I developed some pain in the glute which resulted in me needing to stop the run at 17km, rather than the planned 18km. I managed to stay in range 100% (3.9-7.8 mmol/l) for the duration of the run with an average of 5.8 mmol/l, and my standard deviation was 1.024. I attribute to this to the cliff bar I ate 15min prior to starting the run.
I had a high percentage of low blood glucose readings on my CGM this week, which was mainly due to CGM sensor issues. This, in conjunction with poor rest has resulted in my HRV being quite for low for the week.
I went one full work week without sugar free soda. This change was due to recent research released indicating the significant detriment to health sugar free soda can have.
Exercise stats
Blood glucose stats
AAPS – Boost 3.9
Measurements
Week 3 (12-18th)
Exercise stats
Blood glucose stats
Measurements
Week 2
During my last long run, I had to make the difficult decision to bail out early. Unfortunately, I was dealing with an ankle and tendon injury, which limited my capacity to cover the desired distance. Additionally, my blood sugar levels dropped significantly, adding another layer of challenge. Upon reflection, I realized that this low blood sugar episode was a consequence of inadequate planning. I had not set a high enough temporary target of 8.3 for a sufficient duration, leading to the drop in blood sugar levels.
To alleviate some stiffness in my legs, I sought a massage on Sunday. However, this revealed another issue – lower back pain on the left side. It became evident that this discomfort was likely a consequence of my existing tendon problem on the left side, as my body attempted to compensate for the imbalance. While I have been diligent in incorporating stretching exercises into my routine, it is unfortunate that I began doing so too late to make a significant impact on my current situation.
Despite the challenges I have faced, I consider these setbacks as valuable learning opportunities. Moving forward, I intend to implement the following lessons to prevent similar situations:
Prioritize Injury Prevention: Understanding the importance of injury prevention, I will be more cautious with my training and listen to my body’s signals. This means recognizing the need for adequate rest, seeking professional advice when necessary, and gradually increasing intensity and distance.
Establish Effective Blood Sugar Management: To avoid experiencing low blood sugar levels during physical activities, I will proactively set higher temporary targets and ensure their duration aligns with the demands of my workouts. This way, I can maintain stable energy levels and perform optimally.
Address Imbalances and Compensatory Patterns: By acknowledging the connection between my tendon issue and the resulting lower back pain, I will incorporate exercises and therapies that specifically target these areas. By addressing imbalances early on, I can prevent further complications and improve overall performance.
While my fitness has undeniably declined due to the limitations imposed by my injuries, I have gained valuable insights from these experiences. By emphasizing injury prevention, refining blood sugar management, and addressing compensatory patterns, I am confident in my ability to overcome these setbacks and continue progressing on my fitness journey. Remember, setbacks are not roadblocks but opportunities for growth and resilience.
Exercise stats
Blood glucose stats
Measurements
Week 1
The lead up to race week has been less than ideal. Unfortunately my injury is preventing me from training and is causing pain and discomfort when I run, especially at incline. This was a reminder that injury prevention is key, and if I ever attempt this again I will ensure I follow a program that prioritises injury prevention through intelligent training, gradually increasing mileage and strength training. Please read my retailed post about the race below.
It’s been three weeks since my last post on the half marathon goal for 2023. I had set myself a target of being able to run 10 km by the 28th of April in order to commit to the 21 km run. So far its undecided as I seem to keep getting a numb right foot during runs, although my fitness seems like its returning slowly.
Blood glucose Analysis for the last three weeks:
During this time I was using a dev branch of AAPS with automations to scale the insulin requirements.
Exercise analysis for the three weeks:
The last week was the start of my running ramp-up increasing distance more substantially from 3-4 km to 6-7 km.
Unfortunately I have been plagued by a numb right foot as I exceed the four (4) km distance. This prompted me to do a little research and the most common problem found seemed to be shoes that did not fit well, or that were laced too tightly.
This could of course be glucose related (neuropathy), as when my A1C was in the sevens (7) I experienced something similar, but It seemed to start as I laced up.
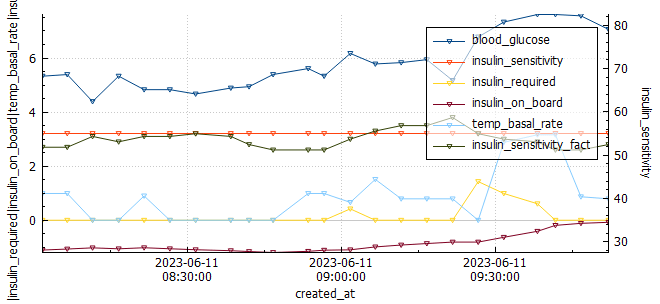
Today’s run I changed shoes to see if that helped, unfortunately I still experience the numbness quite early on in the run, but I kept going. At around the seven (7) km mark I decided to increase pace and this seemed to remedy the issue strangely. Below is a graph of the 9 km run from AAPS / Nightscout data using my custom Python scripts.
The next steps are to purchase some Omega 3 and Alpha lipoic acid and ascertain if that can assist with the foot pain.
It’s been a long-standing goal of mine to run a half marathon. It’s long enough to be a challenge, and short enough that I don’t need to be training all year round and can focus on my other sports.
Pre-requisites
Basal review – I will be doing an incremental basal review in the next few days (hopefully). Skipping meals where required.
Full profile review – Once the basal profile has been updated, I will check my CR (carb ratio) and CRR (carb rise ratio). No need to check ISF (insulin sensitivity factor) as its calculated in Android APS. I will need to be on the look out for blood sugar dips two or more hours after meals as I may need to reduce the Dynamic ISF Adjustment factor.
Injuries
At the moment I have an Achilles tendon issue I am in rehabilitating. It’s the first time I am experiencing this issue, so I am working with a Physio to remedy it.
Training Program
I plan on using the Garmin training program to do most of my training. My longest run prior to this was 16 km and I mountain bike so I think I may be ok with fitness if I can get back into training fairly quickly, but this is dependent on how well my current rehab program works.
This will be updated as and when I can, but the next 3 three (3) weeks are as follows:
Tendon Rehab Program:
Week
Monday
Tuesday
Wednesday
Thursday
Friday
Saturday
Sunday
1
Calf raise holds 5 x 45 seconds, Gym
3km run, double leg calf raise x 3 12-15, body weight single leg calf raise 3 x 10-15
Calf raise holds 5 x 45 seconds, Gym
Calf raise holds 5 x 45 seconds, Gym
3km run in AM, double leg calf raise x 3 12-15, body weight single leg calf raise 3 x 10-15
Calf raise holds 5 x 45 seconds, Gym
Bike in AM
2
Calf raise holds 5 x 45 seconds, Gym
4-5 km
Calf raise holds 5 x 45 seconds, Gym
Calf raise holds 5 x 45 seconds, Gym
4-5 km
Calf raise holds 5 x 45 seconds, Gym
Bike in AM
3
Calf raise holds 5 x 45 seconds, Gym
5-7km
Calf raise holds 5 x 45 seconds, Gym
Calf raise holds 5 x 45 seconds, Gym
5-7km
Calf raise holds 5 x 45 seconds, Gym
Bike in AM
NOTES: If pain/stiffness gets progressively worse, then reduce load and re-assess. If not monitor and keep working.
Strava Running Program:
I had really wanted to use the Garmin program, but I was too late to start it. The Strava program doesn’t seem to have the ability to select the days I plan on running or feedback on training progress at a granular level. My desired routine is 3 days per week.
Garmin Running:
Global Triathlon Network (GTN) half marathon training program
I really liked the plan from GTN, I have modified it a little to fit within my availability.
Disclaimer: The information contained within this blog post are my thoughts and do not constitute medical advice. Please consult your medical team before making any changes to your diet or blood sugar management program.
So far 2022 has been quite the year. With the return to my work offices Its been rather difficult to reach many of the goals I set myself, but I did make progress. It seems 2023 is set to be a particular difficult year, but perhaps this will be the inspiration I need to make some positive changes. The Python scripts I wrote to export data from Nightscout to create my mountain bike videos seem to be working well and I can’t wait to make a few more videos.
I was curious to see if there were any differences in insulin sensitivity between longer and shorter activity durations, as well as higher intensity (where average heart rate was more than 80% of max heart rate) training and it seemed there was, it just wasn’t what I was expecting.
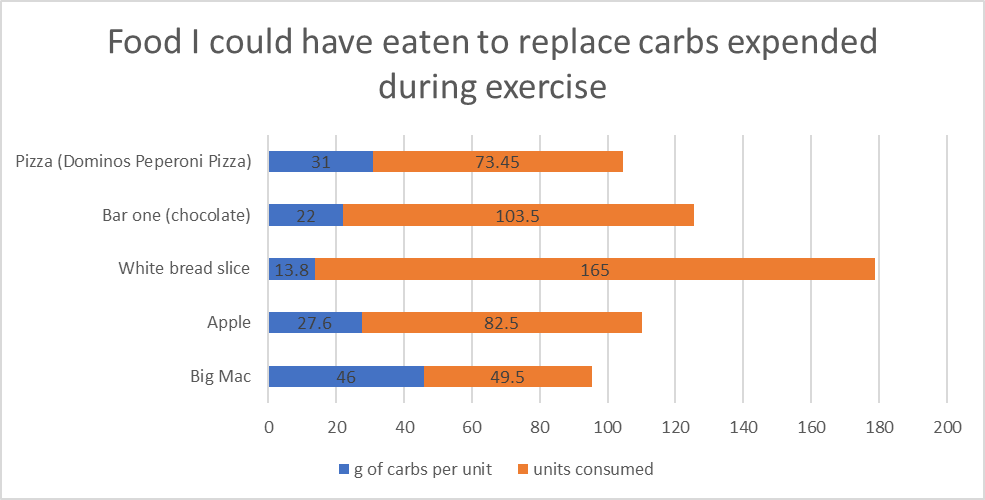
My average total daily dose (TDD) for 2022 was 32.9 units per day. If we analyse my aerobic activity (ride and runs) for the year and we use my sensitivity ratio from AAPS for 24 hours post exercise, I calculate that I saved 256 units of insulin in 2022 through exercise due to increased insulin sensitivity. During aerobic activity I consume 12g of carbs on average per 30 mins of activity unless I am exercising fasted. I can use this input to calculate that I ate 2277g of carbs during 2022. I would need 311 units of insulin to absorb 2277g of carbs. Since I don’t add carbs to AAPS while exercising I don’t have the exact numbers but I do believe this calculation to be pretty accurate. That equates to 49 Big Mac burgers / 82 Apples / 73 slices of Dominos peperoni pizza that I got to eat without insulin as a direct result of exercise.
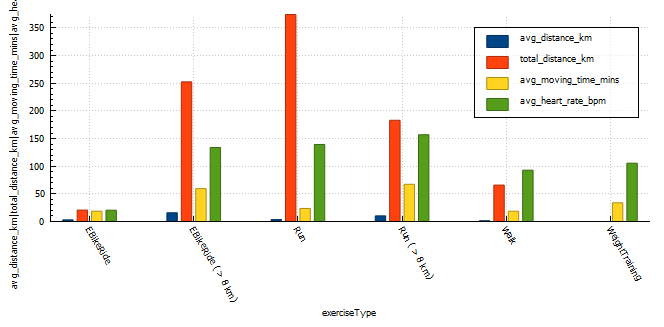
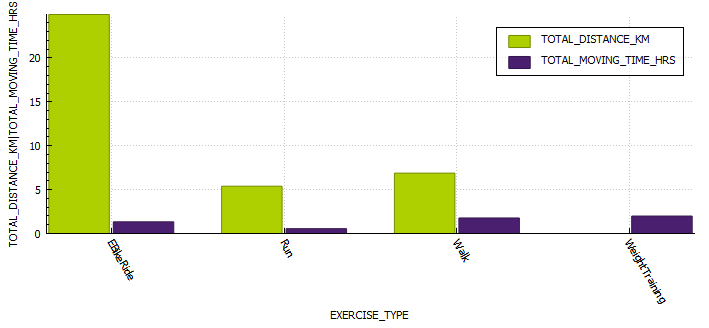
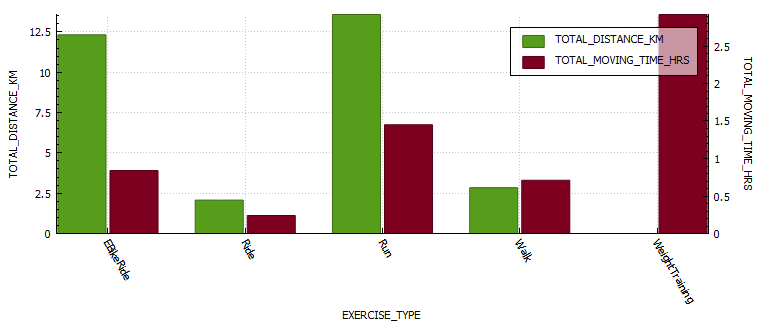
Exercise metrics
Analysing my exercise metrics I found that I was spending way too much time exercising at more than 75% of heart rate max, this would be hampering performance and building endurance. I did eighteen (18) runs at a distance greater than 8km, an improvement over the two (2) I did in 2021. I also managed my longest run ever at 16km.
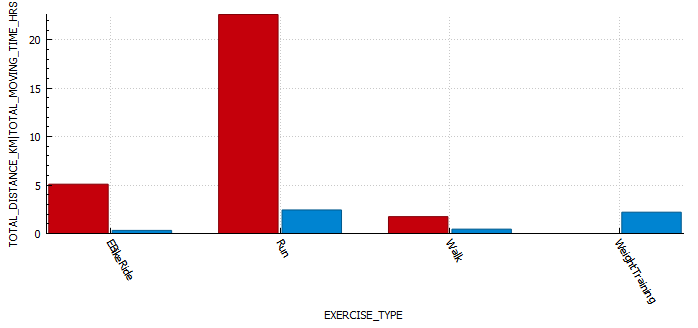
exercise type
exercise count
total distance (km)
average distance (km)
average moving time (minutes)
average heart rate (bpm)
EBikeRide
7
20.64
2.95
18.65
N/A
EBikeRide ( > 8 km)
17
252.4
15.7
59.4
133.8 (72% max HR)
Run
108
374.25
3.47
23.5
139.26 (75% max HR)
Run ( > 8 km)
18
183.1
10.1
67
156 (85% max HR)
Walk
48
65.8
1.37
18.6
93 (50% max HR)
WeightTraining
65
0.0
0
33.77
105 (57% max HR)
TOTAL
262
896
5.6
36
125 (68% max HR)
Exercise stats table for 2022
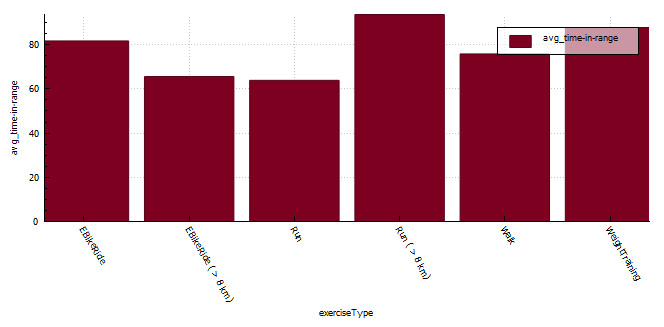
Time-in-range (TIR)
The longer distance running seem to result in the best time-in-range (TIR) (3.9-7.8 mmol/l) but I do feel that these runs also seem to happen at a similar time in the morning where I have more control over insulin-on-board (IOB) and carbs-on-board (COB) and I am the most resistant to insulin. My heart rate is also far more consistent (aerobic) during running than when mountain biking ( aerobic / anaerobic ).
If I start digging into the data for short runs more closely I find that;
TIR (3.9-7.8 mmol/l) from 04:00am – 10:00am is 63%
TIR (3.9-7.8 mmol/l) from 10:00am – 13:00pm is 83%
TIR (3.9-7.8 mmol/l) after 13:00pm is only 23%
exercise type
exercise count
time-in-range (%)
EBikeRide
7
81.67
EBikeRide ( > 8 km)
16
65.56
Run
108
56.8
Run (04:00 – 10:00 am)
18
63.8
Run (10:00 – 13:00 pm)
61
83.6
Run (13:00 – 10:00pm)
29
23.02
Run ( > 8 km)
18
93.6
Walk
45
75.8
WeightTraining
65
87.7
Exercise time-in-range table for 2022
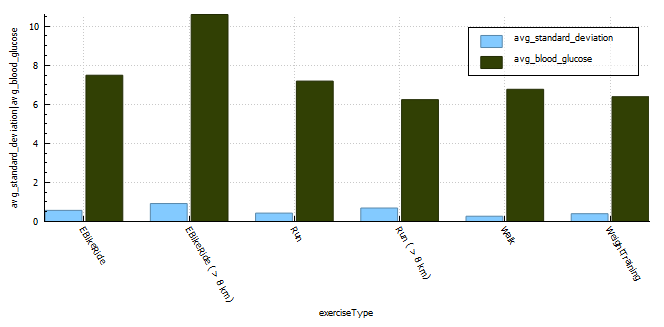
Blood glucose control metrics
The exercise that resulted in the lowest blood glucose fluctuations is walking with a CV of 4%. The exercise with the second lowest CS was weight training. I generally try to train with a little insulin-on-board to counteract the hormones released during training and I don’t need to set a high temp target in the lead-up to the activity, thus my reading is much lower at exercise commencement. The third lowest is short runs (< 8km) with CV of 6%. The higher blood glucose average will be a direct result of me setting a higher temp target (8 mmol/l) prior to exercising, but the duration of activity isn’t long enough to reduce the blood glucose substantially resulting in the high average. Long runs seem to result in the least stable blood glucose values with a CV of 12% but the average for long runs is lower as the sustained activity reduces blood glucose. I suppose on these longer runs I do consume a minimum of 30g of ultra-fast acting carbs (glucose, dextrose) which is going to result in some fluctuations in blood glucose.
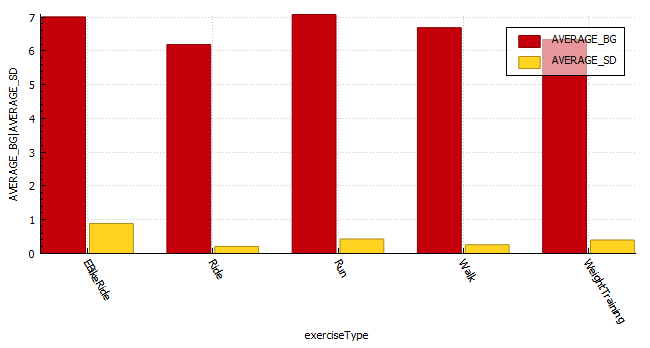
With coefficient of the variation (CV) a lower percentage is indicative of more stable blood glucose readings.
exercise type
exercise count
average standard deviation
average blood glucose
average coefficient of the variation (CV)
EBikeRide
7
0.57
7.49
8%
EBikeRide ( > 8 km)
16
0.92
10.6
9%
Run
108
0.43
7.19
6%
Run ( > 8 km)
18
0.69
6.24
11%
Walk
48
0.27
6.77
4%
WeightTraining
65
0.4
6.39
6%
Exercise breakdown for 2022
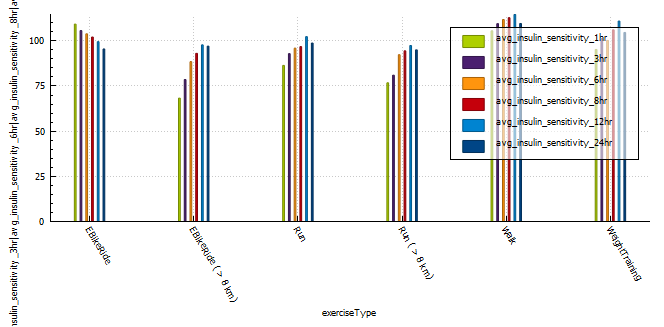
Insulin sensitivity
A very interesting observation was that longer, more intense activity resulted in sensitivity returning to normal quicker than less intense or shorter activity. Runs shorter than 8km resulted in a massive 12% insulin reduction for 24 hours post activity, that’s around 6.5 units less insulin in a 24 hour period. Long E-Bike rides resulted in the largest increase (35%) in sensitivity 1 hour post activity, with shorter E-Bike rides the second largest increase in sensitivity. Runs longer than 8 km increased sensitivity (25%) the third most, but the body seemed to return to normal more quickly than the shorter runs and was almost back to normal within 12 hours of activity.
(NOTE: I can’t comment on the validity of the results, only that patterns exist after exercise that are not usually observed in the absence of aforementioned exercise.)
average insulin sensitivity
exercise type
exercise count
1 hr post exercise
3 hr post exercise
6 hr post exercise
8 hr post exercise
12 hr post exercise
24 hr post exercise
EBikeRide
7
109
105
103
102
99
95
EBikeRide ( > 8 km)
16
68
78
88
93
97
79
Run
108
86
92
95
96
102
98
Run ( > 8 km)
18
76
80
92
94
97
94
Walk
48
105
109
111
112
114
109
WeightTraining
65
95
101
100
106
110
104
Average insulin sensitivity for multiple time blocks post exercise grouped by exercise type.
Profile Adjustments vs. Temporary Targets (TT)
In the past I used a combination of a 30% reduction in profile and a temporary target of 7 mmol/l while exercising.
This seemed to work quite well, with the caveat that profile adjustments can result in your autosens data being reset if you cancel the adjustment earlier than set.
One way to combat this is to set a higher temp target, this will not effect sensitivity data and can be cancelled at any time without needing to update the basal insulin profile in the pump of effecting autosense data. In order to do this I analysed the adjustments I was using to calculate a temp target that should reduce my insulin enough to keep me in range for the duration of activity.
It’s diabetes awareness month and so I wanted to talk to you about something I am very passionate about, Android artificial pancreas system (AAPS). It’s not the cure I wanted but as far as I am concerned, it’s the closest to normal I have felt in the 25 years I have been a diabetic.
Why ILOVEAndroid APS
I decided to try Android APS just prior to the birth of my daughter. At the time I was using multiple daily injections (MDI) on a low-carb diet (less than 45g per day excluding protein and fat) and trying to pick up some muscle. I found it rather challenging to eat the number of carbs the trainer suggested without compromising control. I was also anticipating the late nights having a baby entails and I wanted to be prepared. David Burren’s blog provided a blueprint of what could be expected if I committed to investing the time required to perform all necessary testing and fine-tuning.
Benefits of Android APS
Meal management
Meals can be managed through a number of mechanisms including;
Un-announced meals (UAM) – AAPS boluses insulin without intervention or carb entry.
Announcing carbs – Add the carbs into the system and the calculator estimates the amount of insulin required based on your COB, IOB, ISF, current blood glucose, blood glucose deltas, and insulin sensitivity.
Extended carbs – typically used to mimic the absorption of protein (gluconeogenesis) or delayed gastric emptying caused by high-fat meals.
Exercise management
Insulin scaling adjusts basal insulin based on current insulin sensitivity
Automations allow you to schedule profile changes and temporary blood sugar targets for the duration of activity or condition.
Directly or indirectly (via Nightscout) display various blood glucose-related data on compatible watches. If you are using an Android watch (WearOS) you can control AAPS via the watch. Garmin watches can display blood glucose data during an activity.
Utilise the blood glucose data from a wide variety of CGMs (continuous glucose monitors)
Software
Automations allow you to automate system actions based on conditions (eg. blood glucose increasing, blood glucose decreasing, leaving for work, pump disconnect) or schedules.
Highly customizable to your unique needs, with certain advanced builds allowing you to control more system variables (Boost, AIMI, Eating Now).
Cutting-edge development
Dynamic insulin sensitivity factor (ISF that changes based on blood glucose)
Improved prediction models
Improved insulin modeling (9-hour DIA)
Quality of Life
Reduced diabetic burden and stress.
Glucose is constantly monitored, with the ability for someone to follow you remotely, including community members. This can assist with fine-tuning settings.
Ability to eat more foods without compromising control
Improved glucose control reduces the possibility of long-term complications.
Safety
Objectives provide a level of safety as users need to understand basic principles of how to use the APS prior to closing the loop.
Nightscout reporter provides detailed reports that can assist with APS tuning and a detailed view of your risk rate through the comprehensive glucose pentagon.
As with all DIY systems, you are required to build the application prior to using it.
Cost of hardware
Phone
CGM
Pump and supplies
Connectivity fatigue
The burden of being connected to technology 24/7
Reliance
It is easy to become reliant on AAPS managing blood sugars.
Usability
Due to its complexity, you are required to invest a large amount of time in order to gain the understanding and skills required to configure and utilise it correctly.
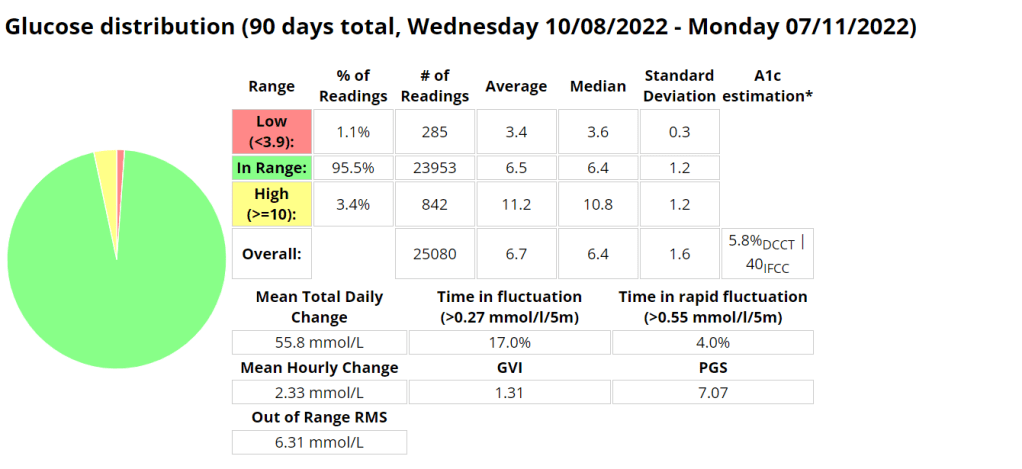
Statistics and examples:
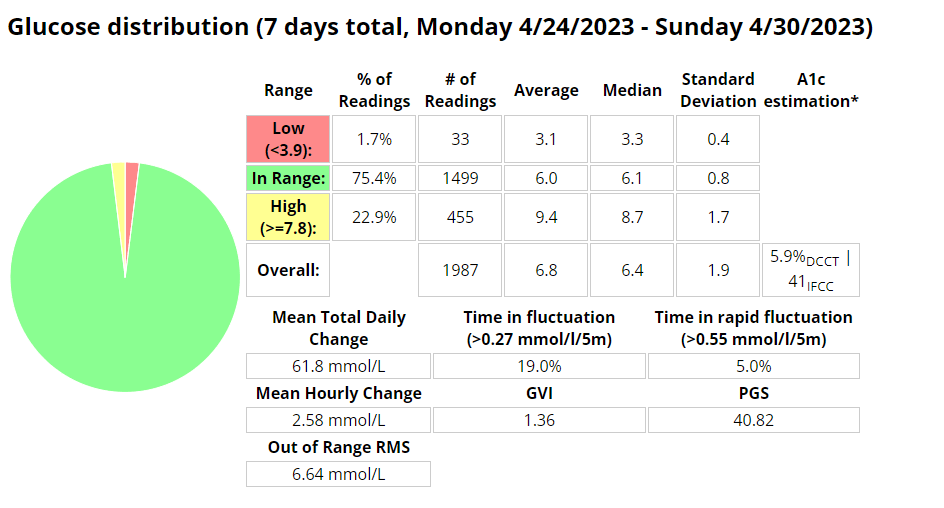
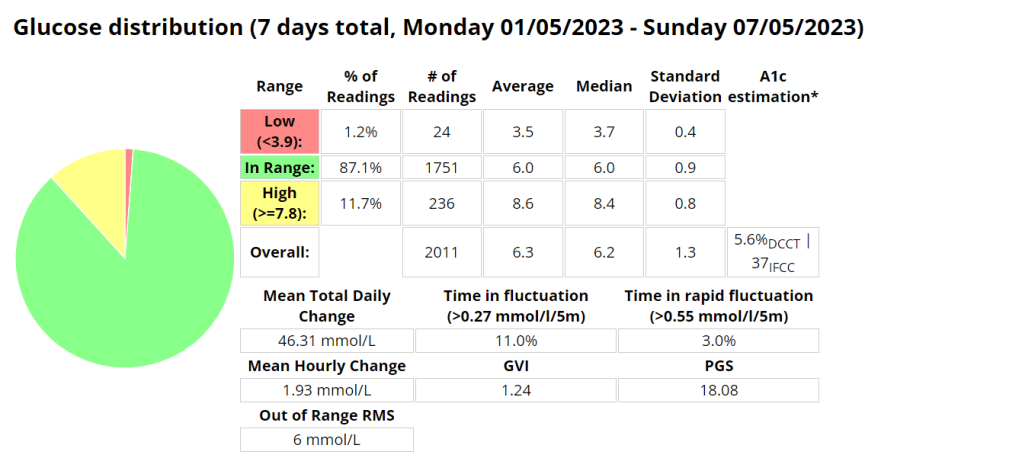
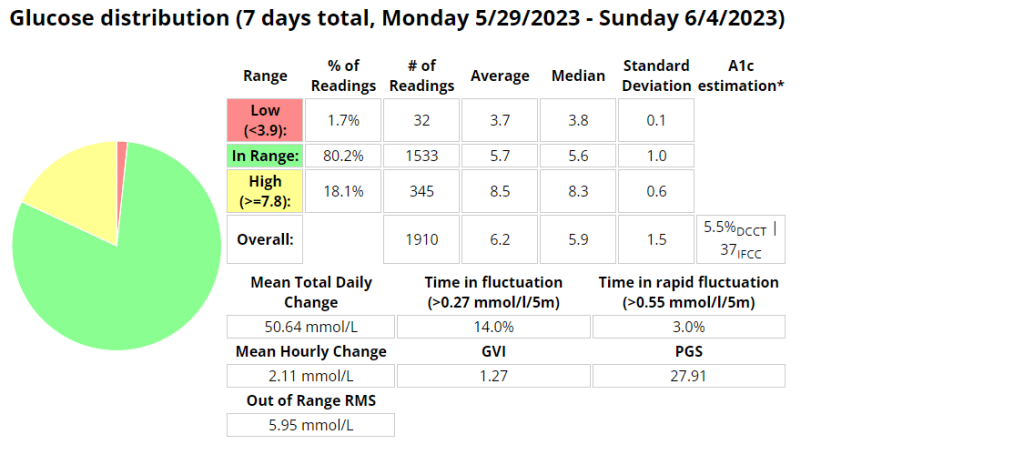
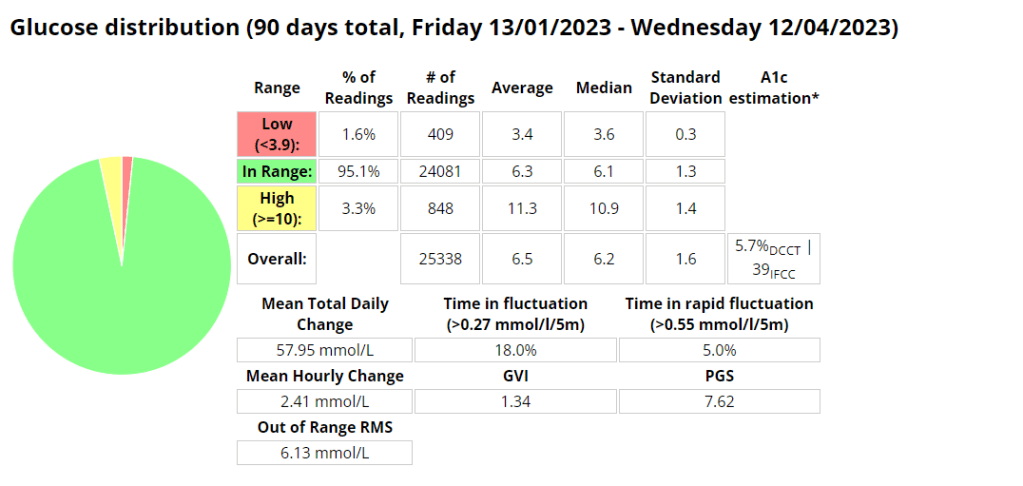
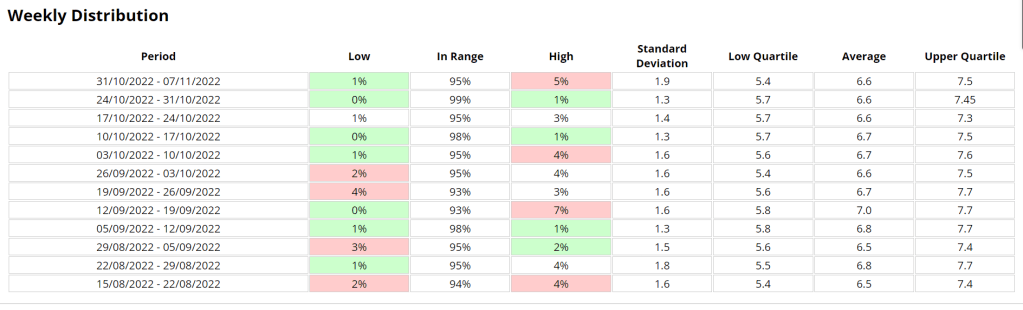
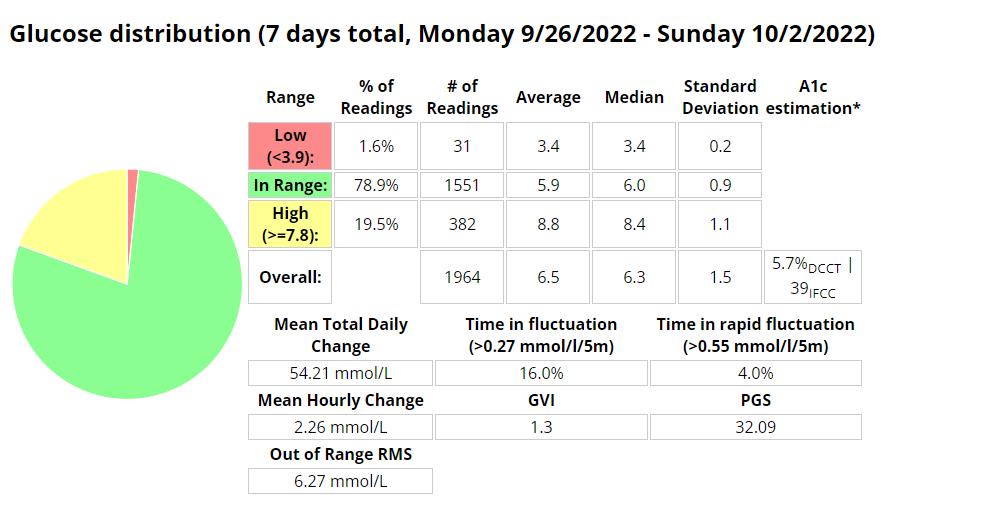
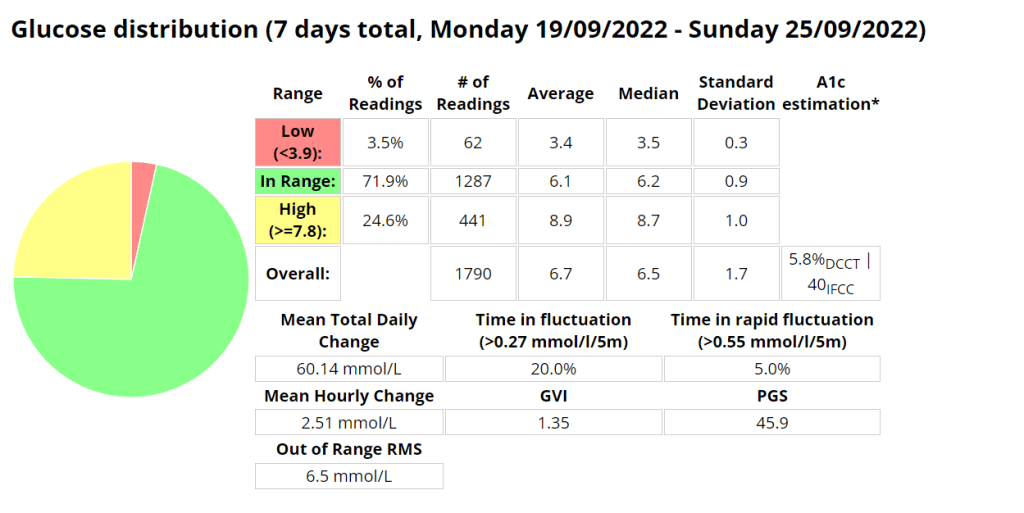
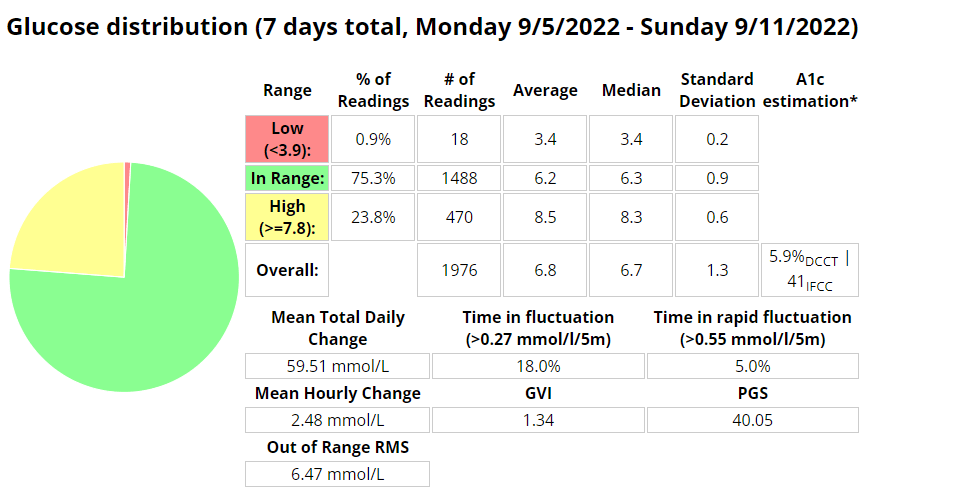
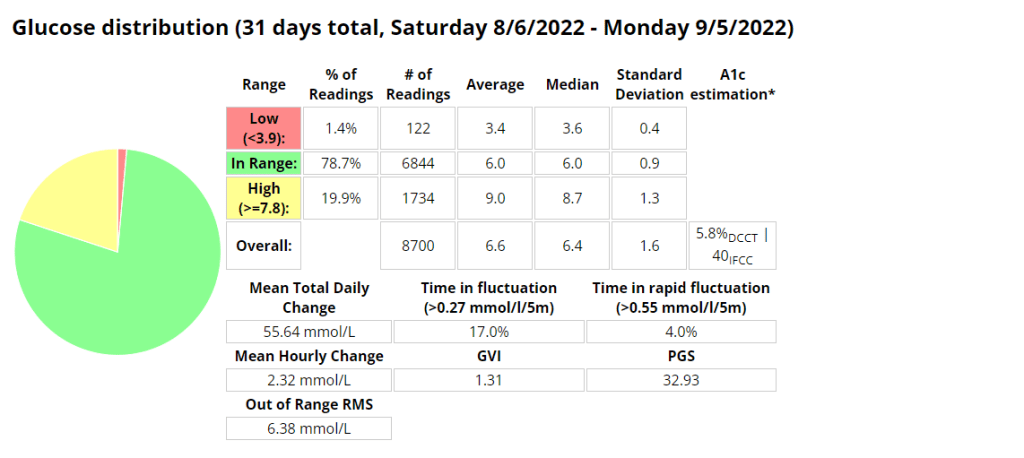
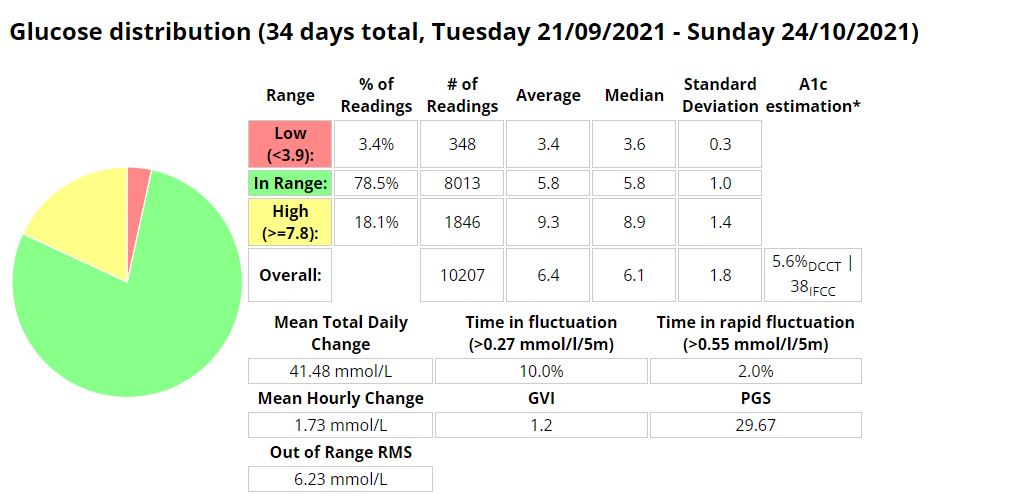
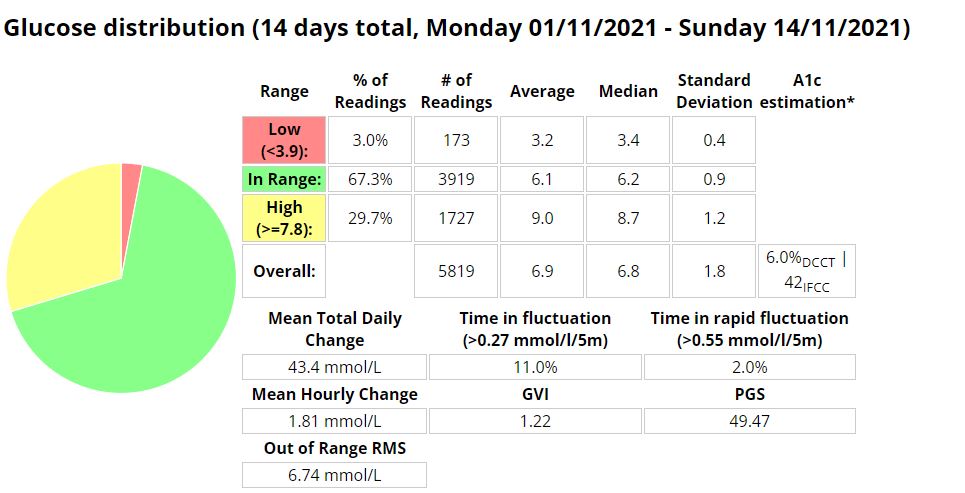
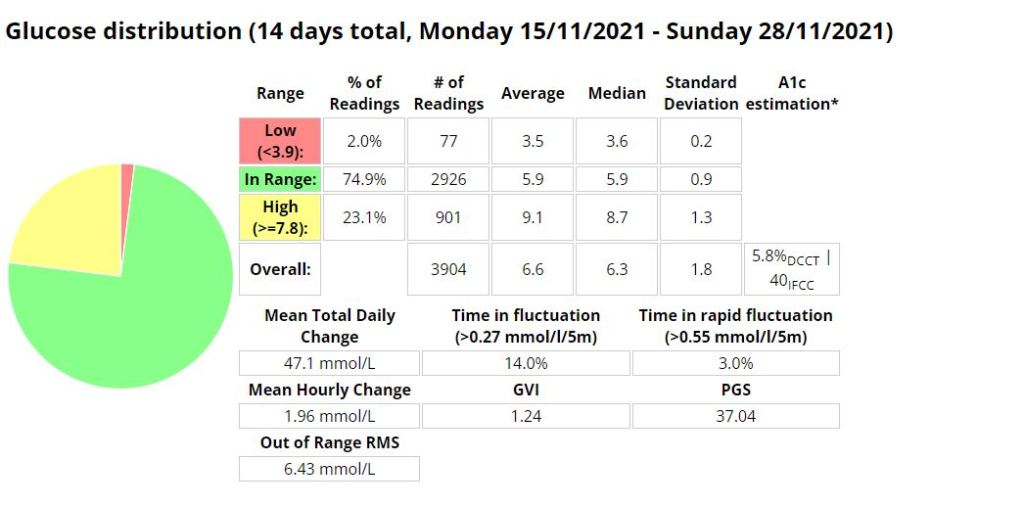
Nightscout statistics – 3 Months
Nightscout blood glucose distribution reportNightscout blood glucose weekly distribution report
Control stats for different systems
Date Started Test
Control Mechanism
e-A1C
Average Blood Glucose
Time In Range (TIR) 3.9 – 10
Standard Deviation
Average carbs consumed
GVI
PGS
CGP – PGR
20/11/2019
MDI
6.1%
7 mmol/l
87%
2.2 mmol/l
1.2
20.33
1.7
20/11/2020
MDI
5.6%
6.3 mmol/l
94%
1.7 mmol/l
< 60
1.17
8.67
1.3
20/11/2021
Loop
5.7%
6.5 mmol/l
94%
1.7 mmol/l
<100 (carb counting)
1.25
8.29
1.3
04/02/2022
Android APS
5.7%
6.5 mmol/l
96%
1.5 mmol/l
>200, little to no carb counting
1.24
5.70
1.2
Analysis stats provided by Nightscout reporter.
Comprehensive glucose pentagon from Nightscout reporter report.
Un-announced meal (UAM) example
Low-carb meal with UAM running (Low-carb bread with cheese, ham, and mayo.)
Extract from Android APS data for a low carb meal
As can be seen above the system manages low-carb meals quite well with no carb inputs from the user. The system constantly monitors for rapid changes in blood sugars and administers insulin when required to quickly brings sugars into range.
Nightscout screenshot of low carb meal being absorbed while AAPS manages sugars.
Exercise stats / examples
Year
Average Time in Range (3.9-7.8 mmol/l)
Average blood glucose (mmol/l)
Average Standard Deviation (mmol/l)
Total Hours
Total KM
2022
80.1 %
6.6
0.43
131
885
2021
71.9 %
6.7
0.4
149
920
2020
69.7 %
6.9
0.7
67
658
Annual improvements are made through tweaking system variables and my approach to exercise.
Weight Training
Date
IOB @ start
Moving time
Exercise Type
Average HR (bpm)
Standard Deviation (mmol/l)
CGM BG Start
CGM BG End
CGM BG Average (mmol/l)
TIR (3.9-10)
2022-10-07
0.14
36.93
WeightTraining
101.1
0.365
7.7
6.8
7.27
100.0%
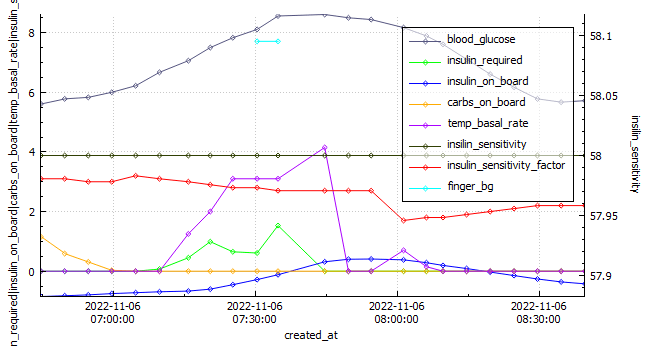
EBike Ride
Android APS data exported during an E-Bike Ride 2022-11-06.
Date
IOB @ start
Moving time
Exercise Type
Distance (km)
Average HR (bpm)
Standard Deviation (mmol\l)
CGM BG Start
CGM BG End
CGM BG Average (mmol\)
TIR (3.9-10)
2022-11-06
-0.849
115.92
eBikeRide
27
143
1.095
5.9
5.8
7.16
100%
Running
Android APS data exported during a run 2022-10-03.
This week was the best so far. I did my longest run to date (12km) and had a really good gym week lifting (approx. 20% more volume). My diabetes control is improving (thank you AAPS and exercise) and I have learned a lot digging though my data and through responses from the previous weeks question regarding carb sensitivity factor (CSF) being used to measure insulin sensitivity post exercise. I made some strides in my glucose management tool which also felt great.
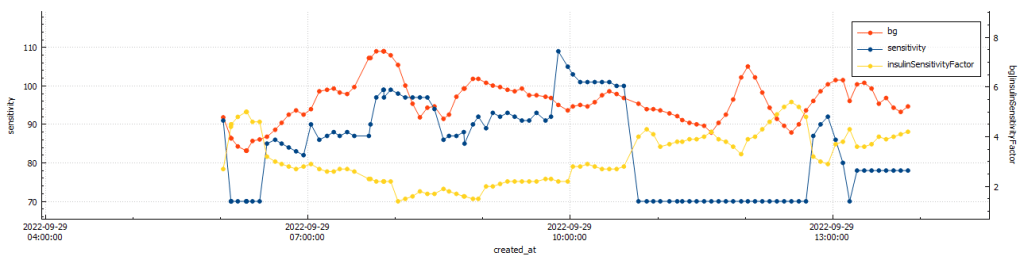
BG vs. ISF vs. insulin sensitivity post gym (@11:48:09 – 42min)BG vs. ISF vs. insulin sensitivity post run (@11:49:30 – 33min)
After gym sensitivity increased to 115% directly post training, while my sensitivity was stable at 78% post my run.
Body Metrics
Body mass vs. body fat
Start
Week 1
Week 2
Week 3
Week 4
Weight (kilograms)
75.8
74
75
74.1
73.1
Body fat percentage (according to Samsung)
17.3%
17.8
*
*
Body fat percentage (according to the navy seal calculator)
15%
15%
14.8%
14%
Total volume
Table stating the weekly body metrics I am tracking.
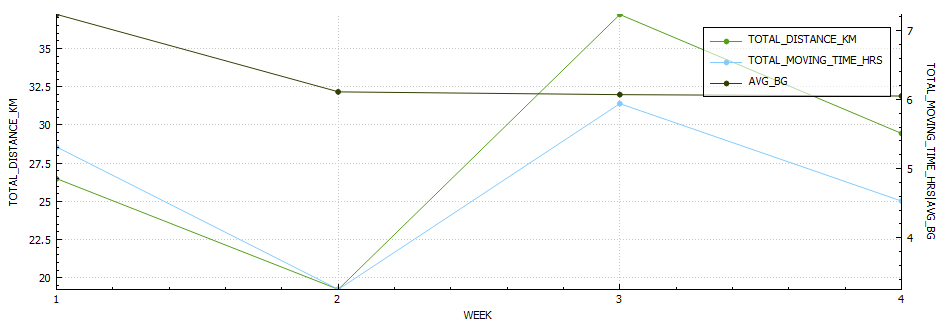
Exercise
Week 1
Week 2
Week 3
Week 4
Distance (kilometres)
25.17
20.54
37.22
29.4
Activity (hours)
4.34
3.65
5.64
5.4
Table stating the weekly exercise metrics I am tracking
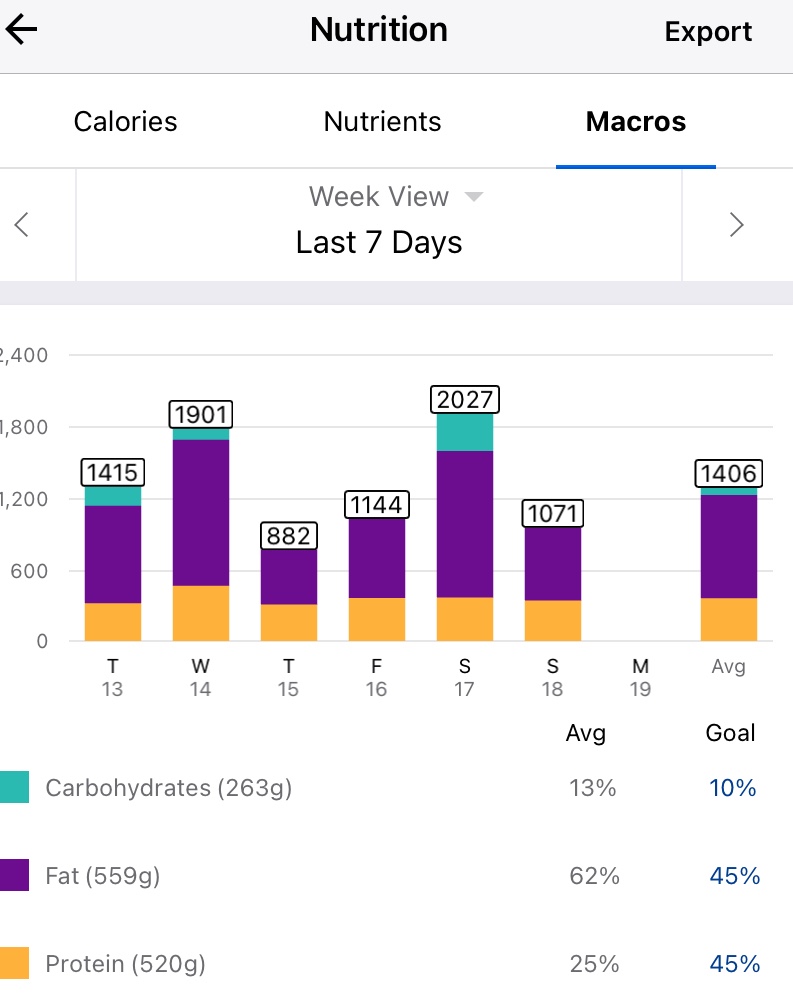
Nutrition
Screenshot of average macro-nutrients consumed during week 4
Screenshot of average macro-nutrients consumed during week 4
Diabetes
Week 1
Week 2
Week 3
Week 4
Low (<3.9) (%)
0.9
0.6
3.5
1.6
In Range (3.9-7.8) (%)
75.3
74.7
71.9
78.9
High (>= 7.8) (%)
23.8
24.7
24.6
19.5
Standard deviation (SD)
1.3
1.7
1.7
1.5
Average (mmol/l)
6.8
7.0
6.7
6.5
A1c estimation (%)
5.9
6.0
5.8
5.7
Table stating the weekly diabetic metrics I am tracking.
Ideally I want to see a time-in-range (TIR – 3.9-7.8 mmol/l) exceeding 90% with an average in the low sixes and a standard deviation (SD) around one (1).
I am starting to feel like a routine is forming, perhaps not around diet yet, but definitely in regards to training. In previous years of doing this I was eating clean most days, as it provided improved diabetic control in the absence of an APS/AID and pump.
This week was particularly heavy due to my birthday dinner, a new phone, a new version of AAPS (Boost test platform 3.6.5) and a 25 km cycle. *I have been unable to pair my galaxy watch with my new phone, which is sad as I really liked the watch and having the plethora of sensors.
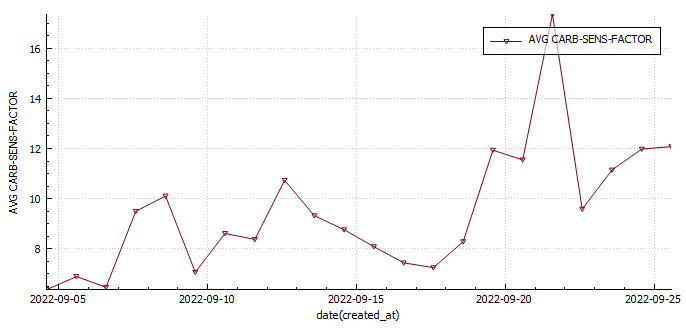
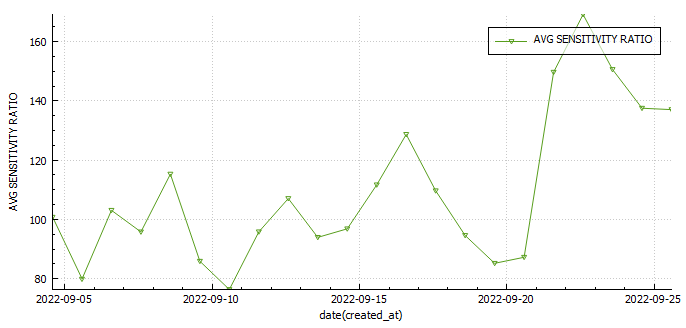
I was investigating the possibility of measuring insulin sensitivity changes in AAPS . One way would be to use the autosens feature in AAPS , but since I wasn’t including the carbs I ate to fix hypos, and I was snacking in-between to keep my readings steady that wasn’t going to work. The only metric that may prove useful may be my carb sensitivity factor (CSF). The average CSF over the 22 days so far is 8.7 while the average sensitivity ratio was 106%. This would mean that according to CSF I was 36% more sensitive to carbs yesterday or 29% less sensitive according to autosens.
Body Metrics
Start
Week 1
Week 2
Week 3
Week 4
Weight (kilograms)
75.8
74
75
74.1
Body fat percentage (according to Samsung)
17.3%
17.8
*
Body fat percentage (according to the navy seal calculator)
15%
15%
14.8%
Total volume
Table stating the weekly body metrics I am tracking.
Exercise
Week 1
Week 2
Week 3
Week 4
Distance (kilometres)
25.17
20.54
37.22
Activity (hours)
4.34
3.65
5.64
Table stating the weekly exercise metrics I am tracking
Nutrition
Screenshot of average macro-nutrients consumed during week 3
Screenshot of average macro-nutrients consumed during week 3
Diabetes
Week 1
Week 2
Week 3
Week 4
Low (<3.9) (%)
0.9
0.6
3.5
In Range (3.9-7.8) (%)
75.3
74.7
71.9
High (>= 7.8) (%)
23.8
24.7
24.6
Standard deviation (SD)
1.3
1.7
1.7
Average (mmol/l)
6.8
7.0
6.7
A1c estimation (%)
5.9
6.0
5.8
Table stating the weekly diabetic metrics I am tracking.
Ideally I want to see a time-in-range (TIR – 3.9-7.8 mmol/l) exceeding 90% with an average in the low sixes and a standard deviation (SD) around one (1).
The second week I have gained a little weight (surprise its not muscle) and had a reduction in exercise hours, which was mostly due to a very long ride I had the previous week.
My diabetic metrics have declined and I feel like all of this mostly due to my diet which needs tweaking.
Body Metrics
Start
Week 1
Week 2
Week 3
Week 4
Weight (kilograms)
75.8
74
75
Body fat percentage (according to Samsung)
17.3%
17.8
Body fat percentage (according to the navy seal calculator)
15%
15%
Total volume
Table stating the weekly body metrics I am tracking.
Exercise
Week 1
Week 2
Week 3
Week 4
Distance (kilometres)
25.17
20.54
Activity (hours)
4.34
3.65
Table stating the weekly exercise metrics I am tracking
Nutrition
Screenshot of average macronutrient consumed during week 2
Screenshot of average macronutrient consumed during week 2
Diabetes
Week 1
Week 2
Week 3
Week 4
Low (<3.9)
0.9%
0.6%
In Range (3.9-7.8)
75.3%
74.7%
High (>= 7.8)
23.8%
24.7%
Standard deviation (SD)
1.3
1.7
Average
6.8
7.0
A1c estimation
5.9%
6.0%
Table stating the weekly diabetic metrics I am tracking.
Ideally I want to see a time-in-range (TIR – 3.9-7.8 mmol/l) exceeding 90% with an average in the low sixes and a standard deviation (SD) around one (1).
Before my run yesterday my blood glucose was lower than I felt was safe to start exercising (around 4 mmol/l ) despite reducing insulin to 70% of requirements and setting a higher temp target ( 7 mmol/l) an hour prior to exercising. I decided to eat an Anzac cookie (20g carbs) and accidently devoured some deep fried bread (30g of carbs). This was excessive to say the least ( I needed around 12g according to my calculator). It also created a complicated situation where I would need to inject prior to exercise or forego exercising all together and rather focus on injecting the appropriate amount of insulin (8.62 units) to counteract the carbs.
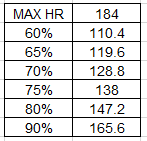
Factors to consider
As a rule of thumb I try to have as little insulin on-board as possible as this reduces the chances of hypoglycaemia (low blood sugar). Due to the carbs I ate I would now need to inject insulin prior to exercising or my blood glucose would rise excessively. I factored in that both fat (from the fried bread) and exercise would decrease the speed of digestion. Exercise decreases the speed of digestion as energy used for digestion would be diverted to my heart, lungs and muscles to fuel my activity and fat slows down gastric emptying and causes insulin resistance.
Insulin calculation
Utilising my IC ratio and exercise table I calculated I required around 1.7 units of insulin prior to the commencement of my run. I decided to be cautious and inject 1.5 units. I used a total of 4.4 units to return to euglycemia (normal blood sugar).
Insulin-to-carb ratio
carbs
Insulin Required
75%
50%
25%
20%
15%
5.8
50
8.62
6.47
4.31
2.16
1.72
1.29
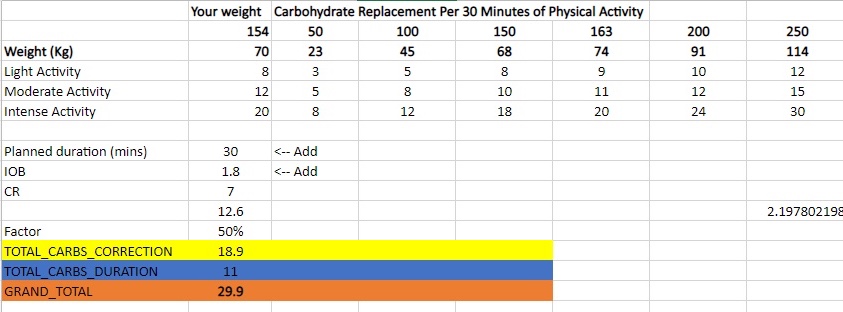
Insulin calculation table
Table containing the amount of carbs I require for a specific duration of activity. This was derived from information found on the internet and my own experience.
Results
The results were by no means perfect, but at the very least I learned how much insulin I require and more or less when I should be injecting after I finish exercising. Its extremely difficult to predict how much exercise will amplify insulins activity, so it’s always safer to take a cautious approach.
My final decision was to inject 1.5 units prior to starting my activity and inject the remaining amount once my sugars started rising due to digestion resuming (around 35 minutes after stopping exercise).
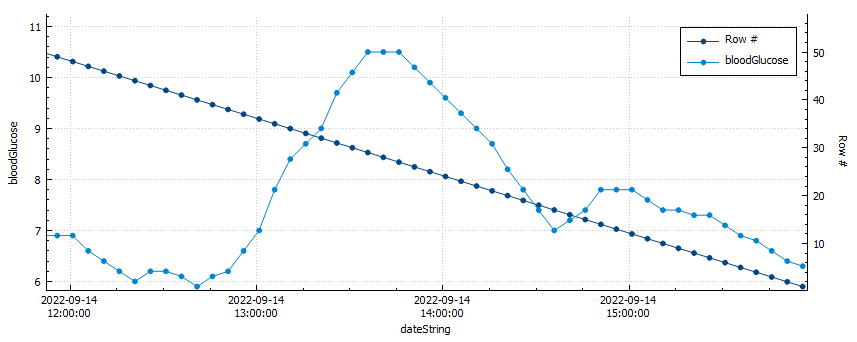
Blood glucose vs. row count
My blood sugar peaked at 10.5 mmol/l after only 1.5 units of insulin for 50g of carbs.
I used a total of 4.4 units of insulin (50% of the total insulin required) to return to euglycemia after my activity. My average blood glucose was 6.6 mmol/l and my time-in-range (TIR) was 100% for the duration of my activity.
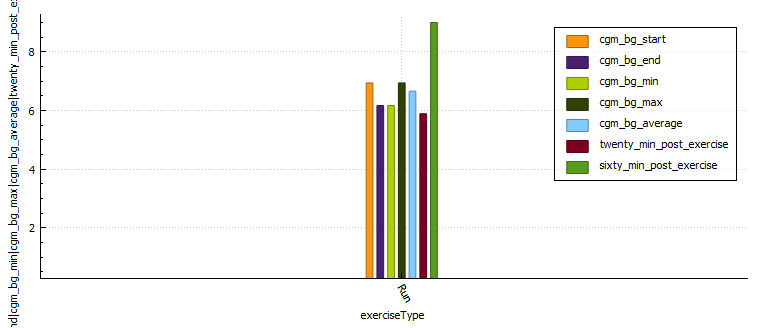
Graph with glucose control metrics during activity
Distance (km)
Moving time (minutes)
Average heart rate
Standard deviation
CGM BG start
CGM BG end
CGM BG min
CGM BG max
CGM BG average
Time in range
BG twenty minutes post exercise
BG sixty minutes post exercise
Lunch Run
4.92
29.53
170.2
0.308
6.94
6.17
6.17
6.94
6.66
100.0
5.89
9.0
Glucose control metrics
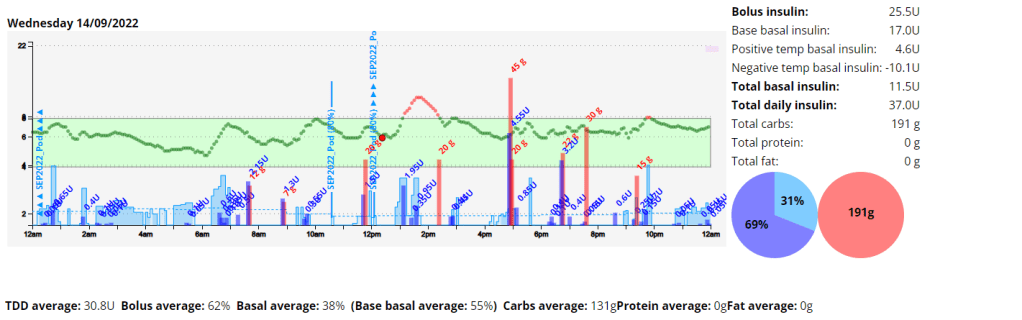
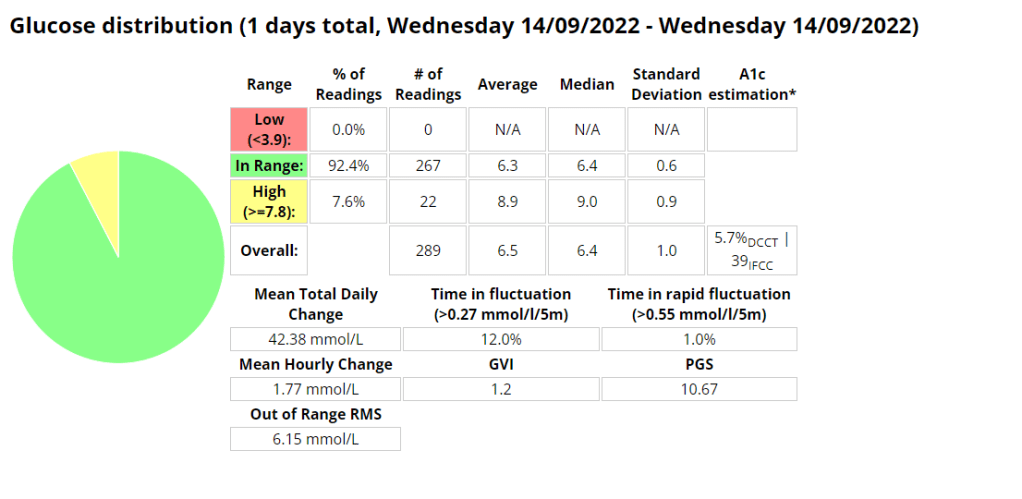
Daily overview graph with insulin and carbs.Diabetic management metrics.
My blood sugar control after exercise improved and I was happy with the results for the remainder of the day. Next time I would inject 20 minutes post exercise to prevent digestion resuming causing hyperglycaemia (high blood glucose).
The first week was challenging to say the least. As I have increased my physical activity my insulin needs seem to have fundamentally changed, and this resulted in quite a few lows. I also had some tech issues, my Android phone had an operating system error and my Dexcom sensor wasn’t enjoying the resistance training I was doing as it was inserted in my arm. I reached my activity goals but exceeded my diabetic and nutritional goals.
Body Metrics
Start
Week 1
Week 2
Week 3
Week 4
Weight (kilograms)
75.8
74
Body fat percentage (according to Samsung)
17.3%
Body fat percentage (according to the navy seal calculator)
15%
Total volume
Table stating the weekly body metrics I am tracking.
Exercise
Week 1
Week 2
Week 3
Week 4
Distance (kilometres)
25.17
Activity (hours)
6.24
Table stating the weekly exercise metrics I am tracking
Week 1 breakdown
Nutrition
Screenshot of the average and total macronutrients consumed during week 1.
Screenshot of average macronutrient consumed during week 1
Diabetes
Ideally I want to see a time-in-range (TIR – 3.9-7.8 mmol/l) exceeding 90% with an average in the low sixes and a standard deviation (SD) around one (1).
It’s spring, and after a brief ‘almost two months’ of going off the reservation snacking at all times of day and barely exercising, I decided to check my weight. I discovered I had picked up a few kilograms since my last weigh in. After learning this, I decided that it was time for me to get my life back together and start another 30 day challenge. I find these great to provide the reason to get back into a routine.
I know that setting unrealistic goals (like losing 5kgs) isn’t going to work, so I’m going to break down my plan in to nutrition, exercise and diabetes goals.
Exercise
My plan for the month is to gym three days a week, run a minimum of 2 times per week and to mountain bike at least once a week. (So I guess I lied about setting unrealistic goals 🙂 )
Nutrition
For my meals I plan to stick to my usual low-ish carbohydrate meals during the week and try to only go coo-coo bananas on the late night snacking over the weekend. I’ll start carb-counting again as this will almost always yield the best results. This will be supplemented with 2-3 liters of water, depending on length of cardio that day.
Diabetes
Above is a chart of my starting metrics. Lets see how quickly I can improve those values. Its going to be a little bit of an unfair test as I was not carb-counting during the above period.
We want to see the In range (Time-in-range) increase and the standard deviation decrease. By doing that the average and the A1c should follow. This will mostly be achieved by the diet component of the plan. The exercise component will allow me to eat more cabs and require less insulin, as well as improve circulation, sleep, blood pressure, mood, cholesterol, memory and overall mental and physical health.
I will check in with weekly updates to ensure I keep motivated and accountable.
Improved time-in-range during exercise with decreased exercise anxiety
Lets start with A1C and Time-in-Range (TIR)
If we look at my stats just prior to looping, I had an A1C of 5.6% and a time-in-range (TIR) of 78.5%. The GVI and PGS stats were also really decent (more on these metrics here https://bionicwookiee.com/2020/02/26/cgm-metrics-gvi-pgs/), with a GVI of 1.2 (non-diabetic) and a PGS of 29 (non-diabetic). A decent average of 6.4 mmol/l, and 3.4 % (1h4min) of time in the 3.0 mmol/l – 3.9 mmol/l range.
Now we look at my last month while on Loop. In order to reflect the learning curve involved from switching to a pump, I broke the stats into two (2) fortnightly blocks.
First two (2) weeks on LoopLast two (2) weeks on Loop
As can be seen in the charts above, some slight improvements are seen in all metrics discussed above with a 7.6% reduction in TIR and a 4.5% (-0.3) reduction in average blood glucose. The GVI and PGS metrics reflect modest variability and good control, as opposed to the previous non-diabetic results. I spent 22min (2%) in the 3-3.9 mmol/l range, down 10min from the previous periods 32min.
Reduce diabetic burden
This goal is subjective and difficult to quantify. Loop does make it easy to administer insulin, enable an over-ride, track carbohydrate absorption ( I was doing this with Spike) correct a hypo/hyper and even just wake up in-range. It does come with its own challenges and hurdles to overcome, like ensuring you have an up-to-date version, checking certificate expiry, ensuring your CGM is calibrated accurately, and then the challenges of constant site changes, reservoir and battery changes, insulin mixing and exercise.
Decrease food anxiety while increasing food options
It definitely feels like less of a burden to experiment with food or eat more carbs, as Loop can pick up any slack due to incorrect bolus calculations, or adjustments after exercise. I used to have 3.4 % (1h4min) hypos (3.0 mmol/l – 3.9 mmol/l) in a month due to incorrect dosing after exercise, but this number has significantly reduced to 2% (22min) while using Loop, as basal can be dynamically adjusted to fluctuations in blood glucose. Post prandial (meal) hyperglycaemia has also significantly been reduced, but I think in part due to Fiasp as it starts working immediately once injected.
MDI Average Carbs per day: 92.6 (*excluding ‘fake carbs’)
Loop Average Carbs per day: 121 (*including ‘fake carbs’)
*’Fake carbs’ are entered into Loop to manage the blood sugar spikes from gluconeogenesis (fat/protein synthesis into glucose)
Improve time-in-range (TIR) during exercise with decreased exercise anxiety
Unfortunately since switching to Loop the Python code I wrote to analyse blood glucose broke with the switch to Loop, so I only have the pre-loop analysis. I was quite happy with the control I had during exercise while on MDI.
I have included the table I have been updating while I work on the Python code, which doesn’t seem to accurately reflect the amount of hypo events I have experienced while running. On the whole cardio has been the item on my list I have struggled with the most, and has been a significant source of anxiety. I am quite certain that after a few months I will have a strategy nailed down and the anxiety associated with exercise will wane. As can be seen in the below table, I am currently focusing on running as its the exercise I am struggling to gain control over the most. I was able to stay in range for the entire duration of all my weight sessions.
I’ll write a follow up post in the next month before I start my Android APS experiment. Good luck fellow Loopers!!
Disclaimer: The information contained within this blog post are my thoughts and do not constitute medical advice. Please consult your medical team before making any changes to your diet or blood sugar management program.
I decided to get an analogue bicycle and I have loved the challenge of riding it. I had a terrible GC half marathon (GCHM), complete with muscle spasms, but I finished so that was nice. The training for the GCHM was amazing and I got to run in some pretty interesting places, like the NSW rail trail in Casino.
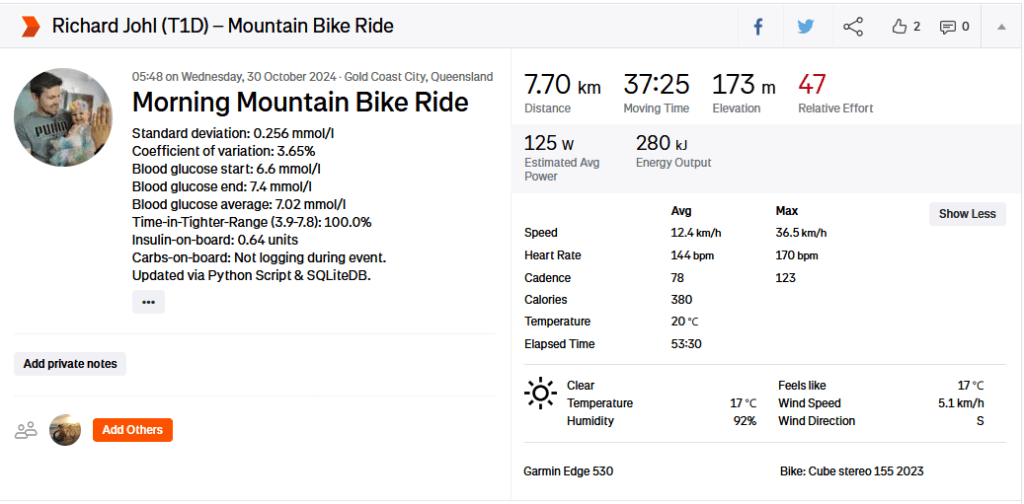
I have developed a host of new features for my Diabetes Analysis Tool, including an integration into Strava, where I update my exercise description with my exercise stats.
Physiological Metrics
I am currently on an average of 42.9 units per day and an average of 150g of carbs per day. These carbs include carbs from fat and protein (gluconeogenesis).
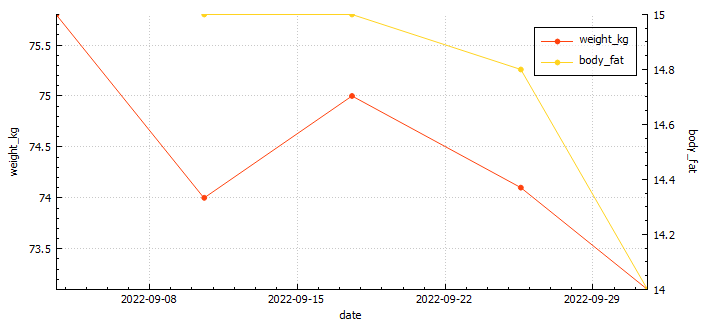
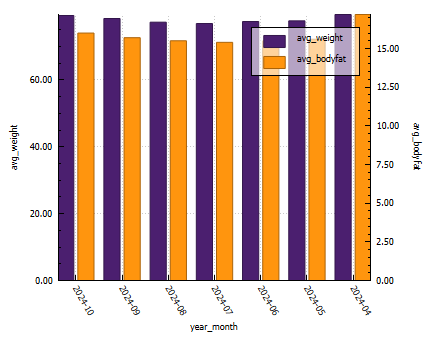
You can see from the graph below that my weight has fluctuated quite a bit this year, with poor eating habits (snacking at night) the biggest contributor to a lower time in range. My lowest bodyfat was 15% (confirmed by 3rd party testing). This dramatic weight shift was due to training for the GCHM.
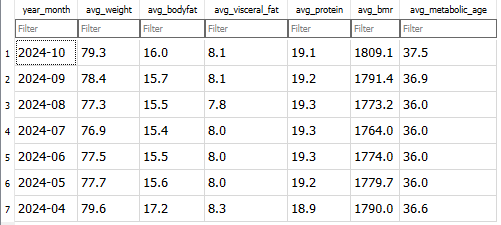
Extract from the Renpho smart scale imported for Analysis.
Weight and Bodyfat graph exported from Diabetic Analysis Tool.
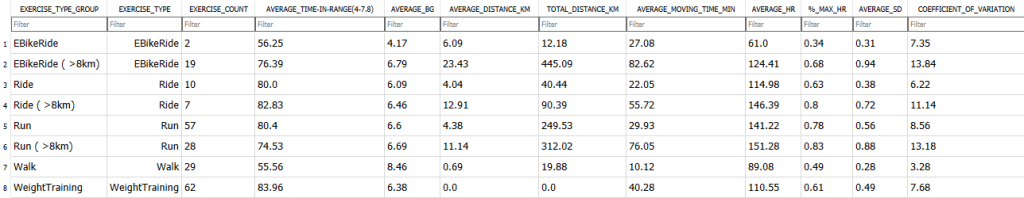
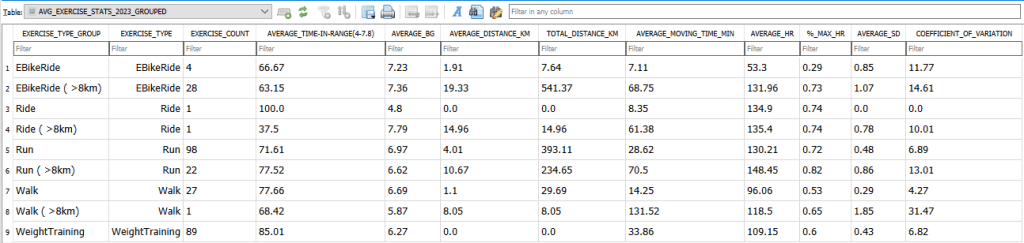
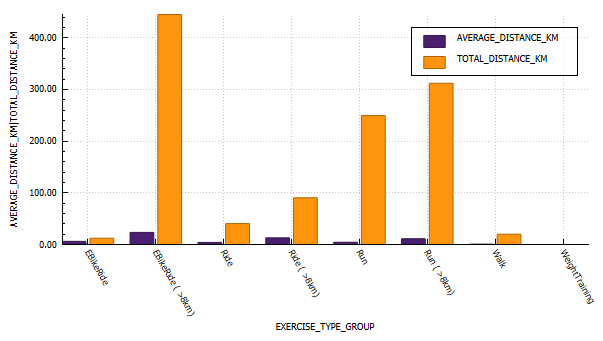
Exercise metrics
Every year I try to increase my distances and time in range (TIR). This year I increased my TIR by 2%, which is incredible. Although my CV and SD are lower, average glucose is down 0.06 mmol/l. I attribute this to lower insulin closer to exercise time, and refuelling at appropriate time intervals.
Annual view of exercise stats2024 exercise stats (grouped by distance)2023 exercise stats (grouped by distance)
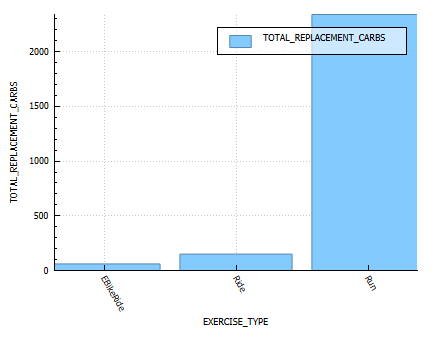
Energy Burn Rates
A table of the estimated energy replacement carbs consumed.
Time-in-range (TIR)
A graph of Time in Range (3.8-7.8) per exercise.
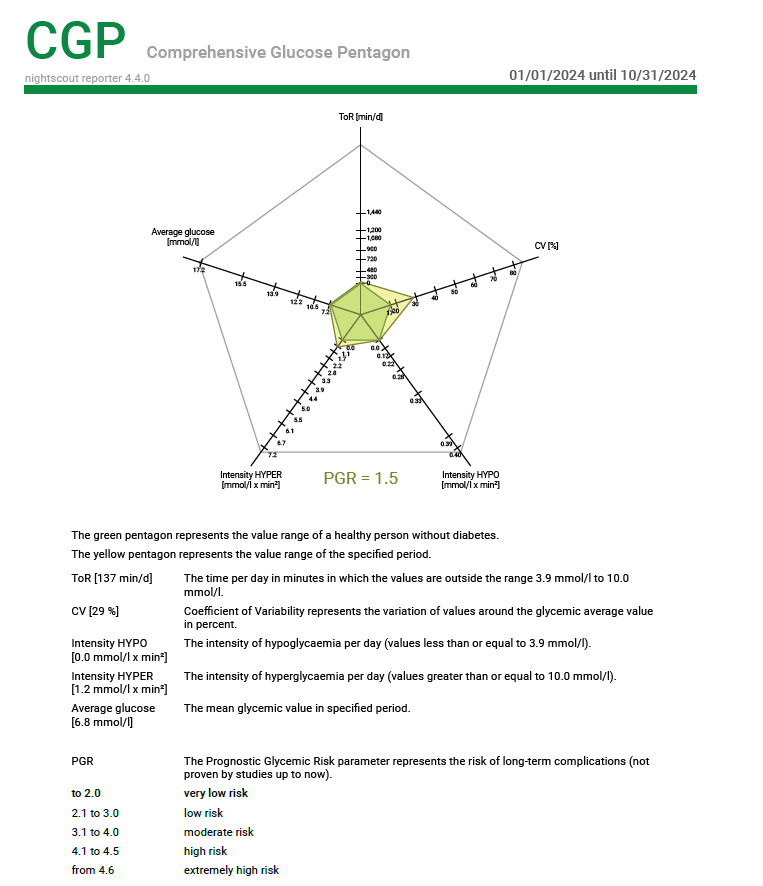
Blood glucose control metrics
Extracted from Nightscout Reporter
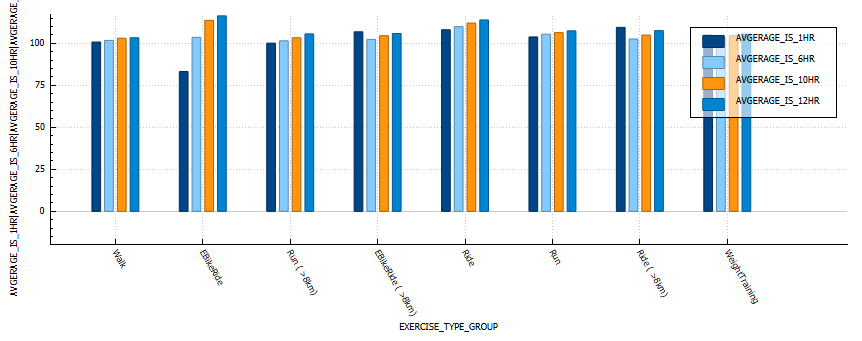
Insulin sensitivity
In the below graph we can see that walking and weight training result in the lowest changes in sensitivity.
Graph derived from AVG_EXERCISE_STATS_2024_GROUPED_INSULIN_SENSITIVITY table.
Maintaining optimal levels of vitamins and minerals is crucial for overall health, especially for those with diabetes. Nutrient deficiencies can exacerbate symptoms or lead to complications, while proper supplementation can support glucose metabolism, insulin sensitivity, and prevent long-term issues. Here’s a guide to essential vitamins and minerals, their clinical dosages, and benefits for people with diabetes.
1. Vitamin D
Clinical Dosage: 600-800 IU per day, but some may require higher doses (up to 2,000 IU daily) depending on deficiency.
Benefits: Vitamin D plays a critical role in insulin production and sensitivity. Deficiency is linked with an increased risk of Type 2 diabetes and poor glucose control . Supplementing with Vitamin D helps improve insulin sensitivity, supports bone health, and reduces inflammation.
2. Vitamin K
Clinical Dosage: 90 mcg/day for women, 120 mcg/day for men.
Benefits: Vitamin K2 helps regulate blood sugar by activating proteins involved in insulin sensitivity. It also improves cardiovascular health, which is crucial for diabetics who are at higher risk of heart disease .
3. Magnesium
Clinical Dosage: 310-420 mg/day.
Benefits: Magnesium plays a vital role in glucose metabolism and insulin action. Many diabetics are deficient in magnesium, which can lead to insulin resistance. Magnesium supplementation improves blood sugar control, reduces insulin resistance, and may lower the risk of diabetes complications .
4. Zinc
Clinical Dosage: 8 mg/day for women, 11 mg/day for men.
Benefits: Zinc is crucial for insulin production, storage, and release. Studies show that people with diabetes may have lower zinc levels, and supplementation can help improve insulin sensitivity and enhance blood sugar control . It also supports immune function, making it beneficial for preventing infections, which can be a concern for diabetics.
5. Vitamin B Complex (especially B6 and B12)
Clinical Dosage: Daily intake varies based on the specific B vitamin; typically, 1.3-2.4 mcg/day for B6 and B12.
Benefits: B vitamins are essential for energy production and nerve health. Vitamin B12, in particular, can help prevent diabetic neuropathy, a common complication. Vitamin B6 may improve glucose tolerance, making it important for maintaining metabolic health .
6. Fish Oil (DHA and EPA)
Clinical Dosage: 250-500 mg/day of EPA and DHA combined.
Benefits: Fish oil, rich in omega-3 fatty acids (EPA and DHA), has anti-inflammatory properties that benefit cardiovascular health, which is often compromised in diabetics. Omega-3s help reduce triglycerides, improve blood pressure, and enhance insulin sensitivity . They may also help reduce the risk of diabetic complications, such as heart disease.
7. Chromium
Clinical Dosage: 200-1,000 mcg/day.
Benefits: Chromium plays a key role in carbohydrate metabolism and helps improve insulin sensitivity by enhancing the action of insulin . Supplementation with chromium can lead to better blood sugar control, particularly in those with Type 2 diabetes.
Additional Recommendations for Diabetics
Alpha-Lipoic Acid (ALA): An antioxidant that helps reduce oxidative stress and improve insulin sensitivity. Clinical dosage: 300-600 mg/day.
CoQ10: Supports cardiovascular health and reduces oxidative stress. Diabetics may benefit from 100-200 mg/day.
Probiotics: Gut health can influence insulin sensitivity. Supplementing with a multi-strain probiotic can support glucose control.
Conclusion
A balanced intake of these vitamins and minerals supports optimal metabolic health for diabetics. Always consult with a healthcare provider before starting supplementation, especially if you are managing diabetes, as they can help tailor the right doses for your needs. Maintaining a healthy diet alongside these supplements is key to improving your overall well-being.
It’s been just over a year since I permanently switched to the Omnipod, and my experience has been a blend of highs and lows. Despite a slight increase in my A1C from 5.7% to 6%, in part due to increased carbohydrate consumption, I appreciate the benefits of the Omnipod’s tubeless design. Not having to deal with tubes and the convenience of the Omnipod’s form factor have made managing my diabetes a bit less intrusive.
However, the transition hasn’t been without challenges. The Omnipod system requires immediate activation upon insertion, which can cause insulin resistance due to the initial trauma of insertion. Its design also means that you experience any issues with insulin resistance or site trauma and need to change a pump early, it can be a costly endeavour. This resistance is difficult to manage, especially around meal times when precise insulin delivery is crucial.
Another problem I encountered was tunnelling, where insulin leaks out from the cannula site. This not only affects insulin delivery but can also cause irritation. The excipient nicotinamide in the insulin formulation has also caused some site reactions for me so I mix insulin with a 50-50 ratio with Humalog. Please note this is off label.
Tips and Tricks I’ve Learned
Despite these challenges, I’ve discovered several strategies to improve my experience with the Omnipod:
Adjusting Insulin Profiles:
When installing a new pump, I set my profile to 120% to counteract any initial insulin resistance.
I try to install the pump a few hours before or after a meal to avoid the insulin resistance coinciding with a meal.
If I miscalculate the timing and need to change a pump around meal times, a short 5-10 minute walk on the treadmill helps improve insulin absorption.
Securing the Cannula:
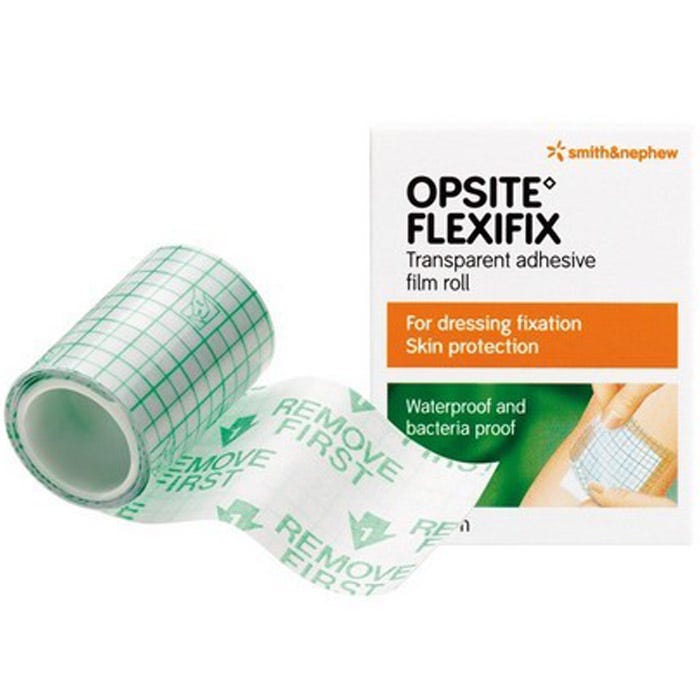
Using Opsite Flexifix under the pump has been a game-changer. It keeps the cannula in place and reduces the need to replace the pump after activities like running.
For additional security, I use Smith+Nephew Primaflex Plus or Fixomull stretch over the pump. I use an old pump or the over-tape provided by Dexcom as a template to cut pieces as needed.
These tips have significantly improved my experience with the Omnipod, making blood sugar management more consistent and reducing the frequency of pump replacements due to physical activity.
Interesting Facts and Supporting Information
A1C and Diabetes Management: An A1C level of 6% is considered good diabetes control. According to the American Diabetes Association, an A1C below 7% is recommended for most adults with diabetes .
Insulin Absorption: The angle and method of insulin delivery can impact absorption. Studies have shown that the angle of insertion can affect how well insulin is absorbed, with certain angles potentially causing more issues like tunneling .
Use of Adhesives: Using adhesives like Opsite Flexifix can help secure insulin pumps, reducing the risk of dislodgement and improving insulin delivery reliability .
In conclusion, while my journey with the Omnipod has had its ups and downs, the freedom from tubes and the ability to manage my diabetes with less visible technology are significant benefits. With the right strategies, I’ve been able to mitigate some of the challenges and maintain effective blood sugar control.
For individuals living with diabetes, maintaining stable blood glucose levels is a critical aspect of managing their condition effectively. Traditionally, glycated hemoglobin (HbA1c) has been the primary metric for evaluating long-term glucose control. However, it provides only a snapshot of average glucose levels over several months. To gain deeper insights into daily glycemic patterns and fluctuations, healthcare professionals and patients are turning to a more comprehensive and dynamic metric called “Time in Tighter Range” (TITR).
What is Time in Tighter Range (TITR)?
Time in Tighter Range (TITR) is a metric that quantifies the percentage of time blood glucose levels remain within a specific target range. The target range is often defined as the optimal window where glucose levels are considered both safe and effective in reducing the risk of diabetes-related complications. Commonly, the TITR target range is set between 70-140 mg/dL (3.9-7.8 mmol/L), but it can be tailored to an individual’s needs based on age, health status, and treatment goals.
Why TIR Matters in Diabetes Management
Real-Time Assessment: Unlike HbA1c, which provides a retrospective average, TIR offers real-time data, empowering patients and healthcare professionals to make immediate adjustments to diabetes management strategies.
Insights into Glucose Patterns: TITR helps reveal patterns and trends in glucose control, identifying potential trouble spots and offering opportunities for targeted interventions.
Reduction of Hypoglycemia and Hyperglycemia: Maintaining TIR within the target range can reduce both hypoglycemic episodes (dangerously low blood glucose levels) and hyperglycemia (elevated blood glucose levels), enhancing overall quality of life and mitigating diabetes-related complications.
Tracking and Monitoring with TITR
Using TIR involves continuous glucose monitoring (CGM) or frequent blood glucose measurements. The data is then analyzed to determine the percentage of time spent within the target range. Several approaches can be used to track TIR:
CGM Devices: Advanced CGM devices automatically calculate and display TIR data, offering users real-time feedback on their glucose control.
Data Logs: Patients and healthcare professionals can manually record blood glucose readings and calculate TIR using spreadsheets or dedicated apps.
TITR in Real-Life Scenarios
Personalized Diabetes Management: TITR allows for a tailored approach to diabetes management. It helps healthcare professionals customize treatment plans and make timely adjustments to insulin dosing, diet, and exercise regimens.
Pregnancy and Diabetes: During pregnancy, TITR is critical for expectant mothers with diabetes, as tight glucose control is vital for the health of both the mother and the baby.
Sports and Physical Activity: For athletes with diabetes, TITR provides insights into glucose fluctuations during physical activity, helping them optimize performance and avoid glucose-related issues during exercise.
Conclusion
Time in Tighter Range (TITR) is a valuable and dynamic metric that goes beyond traditional HbA1c measurements, providing real-time insights into daily glycemic patterns. With its ability to track fluctuations and trends within the target range, TITR empowers individuals and healthcare professionals to take proactive steps towards better diabetes management. By striving for optimal TITR, patients can enhance their quality of life, reduce the risk of complications, and achieve greater control over their diabetes. As TITR continues to gain prominence in diabetes care, it offers new possibilities for personalized and effective diabetes management strategies.
The Glycemic Management Indicator (GMI) is an essential tool used to evaluate and monitor long-term glycemic control in individuals with diabetes. It is derived from continuous glucose monitoring (CGM) data or frequent fingerstick blood glucose measurements obtained over a specific period, typically ranging from two weeks to three months. GMI is considered an alternative to traditional HbA1c (glycated hemoglobin) measurements, offering a more comprehensive and insightful assessment of glucose management.
Benefits of GMI Compared to HbA1c:
GMI provides several advantages over traditional HbA1c measurements:
a. Real-Time Data: Unlike HbA1c, which reflects an average of blood glucose levels over the past 2-3 months, GMI is based on current and recent glucose data. This real-time aspect allows for timely adjustments to diabetes management strategies.
b. More Comprehensive: GMI incorporates a broader range of glucose data, capturing variations and fluctuations in glucose levels that HbA1c may not reveal. It considers both hyperglycemia and hypoglycemia, offering a more comprehensive view of glycemic control.
c. Better Glucose Trend Assessment: GMI can monitor trends in glucose levels, helping healthcare professionals and individuals with diabetes identify patterns and make targeted interventions to improve glycemic management.
Examples of Using GMI for Glycemic Control Monitoring:a. Personalized Treatment Plans: GMI data enables healthcare professionals to tailor treatment plans to individual needs. For instance, if a person has a high GMI with frequent hyperglycemic excursions, treatment adjustments can be made to reduce these excursions and improve overall glycemic control.b. Predicting Hypoglycemia: GMI can help identify periods of increased risk for hypoglycemia, allowing patients to take preventive measures, such as adjusting insulin doses or modifying meal plans.c. Assessing Treatment Changes: When implementing changes in diabetes management, GMI can track the impact of those changes over time, providing valuable feedback on the effectiveness of the modifications.
Addressing Variations in GMI Calculation:The formula to calculate GMI is generally (Mean Glucose + 46.7) / 28.7. However, it’s essential to acknowledge that different devices, CGM systems, and methodologies might use alternative formulas or constants for GMI calculation. To obtain accurate and specific information on GMI calculation, users should refer to the guidelines and documentation provided by the manufacturer of the CGM device or the healthcare professional overseeing diabetes management. This ensures consistency and proper interpretation of GMI results.
In summary, GMI is a valuable tool in diabetes management, offering real-time insights and a more comprehensive assessment of glycemic control compared to traditional HbA1c measurements. By leveraging GMI data, healthcare professionals and individuals with diabetes can make informed decisions and take proactive steps to optimize diabetes management strategies.
Continuous glucose monitoring (CGM) is a technology that allows people with diabetes to track their blood sugar levels in real time. A CGM sensor is inserted under the skin and measures glucose levels in the interstitial fluid, which is the fluid that surrounds the cells. The sensor sends readings to a receiver or smartphone every few minutes, so you can see how your blood sugar levels are changing throughout the day.
What is traditional blood glucose testing?
Traditional blood glucose testing involves pricking your finger to draw a drop of blood, which is then applied to a test strip. The test strip is inserted into a blood glucose meter, which provides a reading of your blood sugar level. Traditional blood glucose testing is typically done several times a day, but it can be more frequent if you have diabetes that is not well controlled.
Advantages of CGM
CGM has several advantages over traditional blood glucose testing, including:
Real-time monitoring: CGM allows you to see your blood sugar levels changing throughout the day, which can help you make better decisions about insulin dosing and food choices.
More data: CGM provides more data about your blood sugar levels than traditional blood glucose testing. This data can be used to identify trends and patterns in your blood sugar levels, which can help you improve your diabetes management and has allowed for advances like Artificial pancreas systems (APS) to be created.
Less finger pricks: CGM can help you reduce the number of finger pricks you need to do each day. This can be helpful for people who have diabetes and are sensitive to pain.
Disadvantages of CGM
CGM also has some disadvantages, including:
Cost: CGM devices can be expensive, and the sensors need to be replaced every 7-10 days.
Accuracy: CGM sensors are not always accurate, and they can be affected by factors such as exercise, illness, and food.
Inconvenience: CGM sensors can be uncomfortable to wear, and they can be damaged if they are not properly cared for.
When to use CGM
CGM is a good option for people with diabetes who want to improve their diabetes management. It is especially helpful for people who:
Have frequent highs and lows
Have difficulty controlling their blood sugar levels with traditional blood glucose testing
Are at risk for hypoglycemia or hyperglycemia
Are pregnant
What happens when you are dehydrated or playing sports?
When you are dehydrated, your blood sugar levels can rise. This is because your body is not able to get enough water to flush out excess glucose. When you are playing sports, your blood sugar levels can also rise. This is because your body is using more energy, which can lead to a release of stored glucose.
If you are using a CGM, it is important to monitor your blood sugar levels closely when you are dehydrated or playing sports. You may need to adjust your insulin dose or eat more carbohydrates to keep your blood sugar levels in a safe range.
Dexcom sensor settling time
The Dexcom sensor needs about 24 hours to settle after it is inserted. During this time, the sensor may be less accurate. It is important to monitor your blood sugar levels closely during this time and to use a backup method of blood sugar testing, such as a finger prick, if you are concerned about your blood sugar levels.
Sensor placement
The placement of the Dexcom sensor is important. The sensor should be placed on the abdomen or the back of the upper arm. It is important to avoid placing the sensor on areas of the skin that are:
Injured
Irritated
Tattooed
Scarred
Acceptable tolerance of CGMS and blood sugar testers
CGMS devices are not always accurate, and they can be affected by factors such as exercise, illness, and food. Dexcom accepts a tolerance of 20% from blood readings. This means that a CGM reading that is 20% higher or lower than a blood reading is still considered to be accurate.
Most finger prick testers can be different to laboratory results. This is because finger prick testers measure blood sugar levels in the blood, while laboratory results measure blood sugar levels in plasma. Plasma is a thicker fluid that contains more glucose than blood. This is why laboratory results are typically higher than finger prick results.
Conclusion
CGM is a valuable tool for people with diabetes. It can help you improve your diabetes management and reduce the risk of complications. If you are considering using a CGM, talk to your doctor about the best option for you.
Introduction: Monitoring blood glucose levels is a vital aspect of managing diabetes, as it helps individuals make informed decisions about their diet, insulin dosage, and overall health. For many years, traditional blood testers were the primary method of measuring glucose levels. However, with advancements in technology, continuous glucose monitors (CGMs) have emerged as a game-changer in diabetes management. In this blog post, we will explore the key differences between CGMs and traditional blood testers, delve into the effects of dehydration and sports activities on glucose readings, and touch upon the settling time required for CGM sensors like Dexcom.
CGMs vs. Traditional Blood Testers: An Overview: Traditional blood testers, commonly known as fingerstick glucose meters, require a small blood sample obtained by pricking the finger with a lancet. The sample is then placed on a test strip, which is inserted into the meter for analysis. This process provides a snapshot of the blood glucose level at the specific moment the test is performed. It requires periodic testing throughout the day to get an idea of how glucose levels fluctuate.
On the other hand, CGMs provide continuous and real-time glucose readings throughout the day without the need for fingerstick tests. CGMs consist of a small sensor inserted under the skin, which measures interstitial fluid glucose levels, usually every few minutes. The data collected is transmitted wirelessly to a receiver or a smartphone app, allowing users to monitor their glucose levels continuously and detect trends and patterns.
The Benefits of CGMs:
Continuous Monitoring: CGMs offer a comprehensive view of glucose levels, revealing trends, highs, and lows that might be missed with traditional blood testers.
Alerts and Alarms: CGMs can be set to provide notifications when glucose levels fall outside of a target range, helping individuals take immediate action and avoid severe hypo- or hyperglycemia.
Data Analysis: CGMs generate detailed reports and graphs, enabling healthcare providers to analyze glucose patterns over extended periods, leading to more informed treatment decisions.
Dehydration and Sports: Implications for Glucose Monitoring: Dehydration and engaging in physical activities such as sports can affect glucose readings. When dehydrated, the blood becomes more concentrated, leading to a higher glucose concentration in the blood. Consequently, both CGMs and traditional blood testers may yield elevated glucose readings in dehydrated individuals. Therefore, it is crucial to stay adequately hydrated to ensure accurate glucose measurements.
During sports or rigorous exercise, the body’s demand for energy increases, resulting in the release of stored glucose. This can lead to a temporary decrease in glucose levels. CGMs, with their continuous monitoring capabilities, can help individuals track these fluctuations in real-time and take necessary steps to prevent hypoglycemia.
Sensor Settling Time: Dexcom and the 24-Hour Period: Dexcom, one of the leading manufacturers of CGMs, suggests a 24-hour settling period for their sensors. This recommendation accounts for the initial trauma caused by sensor insertion. During this period, users may experience inaccurate readings or fluctuations. Waiting for the sensor to settle allows for stabilization and more reliable glucose measurements.
Conclusion: The advent of CGMs has revolutionized glucose monitoring, offering substantial benefits over traditional blood testers. With continuous monitoring, alerts, and data analysis capabilities, CGMs empower individuals with diabetes to make more informed decisions about their health. However, it is important to stay hydrated and consider the effects of physical activities on glucose readings. Furthermore, users of CGMs like Dexcom should allow for a 24-hour settling period to ensure accurate and reliable measurements. Embracing this technological advancement can significantly enhance the management of diabetes, promoting better health outcomes for individuals worldwide.