
Is the Quest protein bar type 1 diabetic friendly? Yes I think it is, read more below to discover why I think it is.
Review
- Nutritional Information
- Insulin Strategy
- Goal
- Results
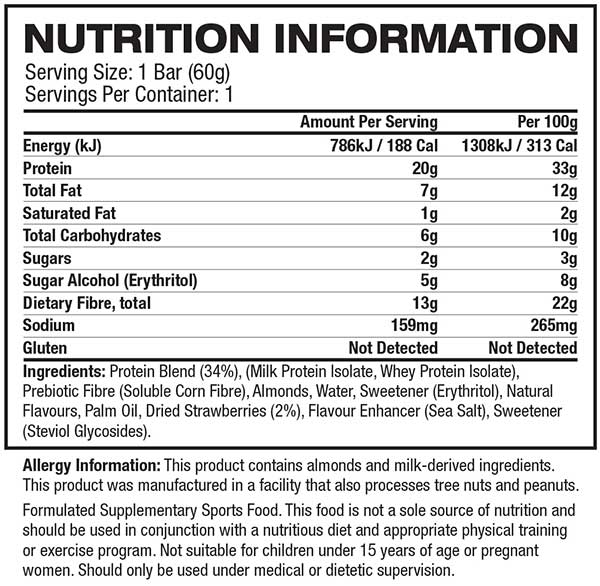
When trying anything new I always read the nutritional information on order to determine the impact it will have on my body. Certain high fat foods can cause insulin resistance and inflammation and will delay gastric emptying while protein will digest and get synthesised into carbohydrates.
Below are two great resources you should read before deciding on your final dosing strategy. Its important to note that in Australia, most items don’t have total carbohydrate count that includes fibre and sugar alcohol, which can make it difficult to assess the impact of products that don’t list sugar alcohols in the nutritional information.
Net Carbs Vs. Total Carbs: What Counts?
Insulin Strategy
Based on the nutritional information above, my inulin to carb ratio and my proximity to recent exercise I decided to inject as follows; I didn’t input my eCarbs for the protein as I knew that AAPS would be able to manage. Read my post for injecting for protein and fat if you are not on an AAPS or experience elevated blood glucose two (2) hours after eating.

Goal
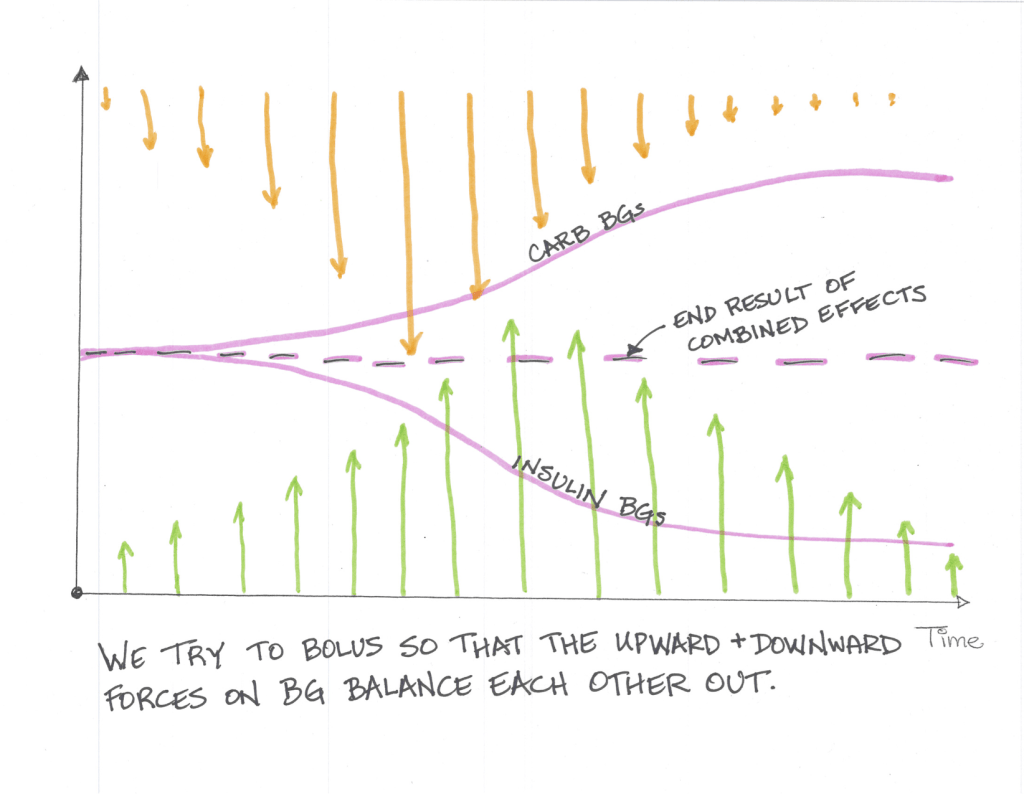
The goal of any insulin strategy would be to inject enough insulin at the correct time so that the upward force the carbohydrates exert is counteracted by the downward force the insulin exerts and you stay in range for the duration of the meal.
To analyse this I use three (3) values, standard deviation, time in range (TIR) and Coefficient of the variation. These three (3) values will assist you in determining how good or bad a meal was for you in terms of blood sugar impact (BGI).
Time in Range (TIR): For TIR we are looking for a high percentage of your readings within a normal (I use 3.9-7.8 mmol/l ) range.
Standard Deviation: For standard deviation I look for values under 1 as a meal that has little to no blood glucose impact (BGI).
Coefficient of the variation (CV): Is the standard deviation divided by the average glucose. Its a measure that helps normalise the results by reducing the influence on average glucose. Most studies indicate that anything under 33% is good.
Results
As we can see by the table below that this snack consumed with the correct insulin strategy resulted in very stable blood glucose over a number of hours, with little deviation. What should be noted is that the sugar alcohol started to effect readings after 3 hours and that 1 hour prior to consumption I had exercised. The exercise would have increased my insulin sensitivity.

Time in Range (TIR): 100%
Standard Deviation: 0.38
Coefficient of the variation (CV): 0.06

Read my post on some common foods I eat to gain a better understanding of how this meal impacted me in comparison.
