Summary
The first week was challenging to say the least. As I have increased my physical activity my insulin needs seem to have fundamentally changed, and this resulted in quite a few lows. I also had some tech issues, my Android phone had an operating system error and my Dexcom sensor wasn’t enjoying the resistance training I was doing as it was inserted in my arm. I reached my activity goals but exceeded my diabetic and nutritional goals.
Body Metrics
| Start | Week 1 | Week 2 | Week 3 | Week 4 | |
| Weight (kilograms) | 75.8 | 74 | |||
| Body fat percentage (according to Samsung) | 17.3% | ||||
| Body fat percentage (according to the navy seal calculator) | 15% | ||||
| Total volume | |||||
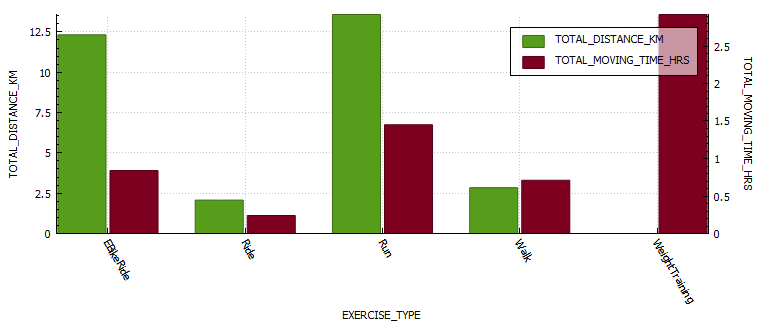
Exercise
| Week 1 | Week 2 | Week 3 | Week 4 | |
| Distance (kilometres) | 25.17 | |||
| Activity (hours) | 6.24 |
Nutrition


Diabetes
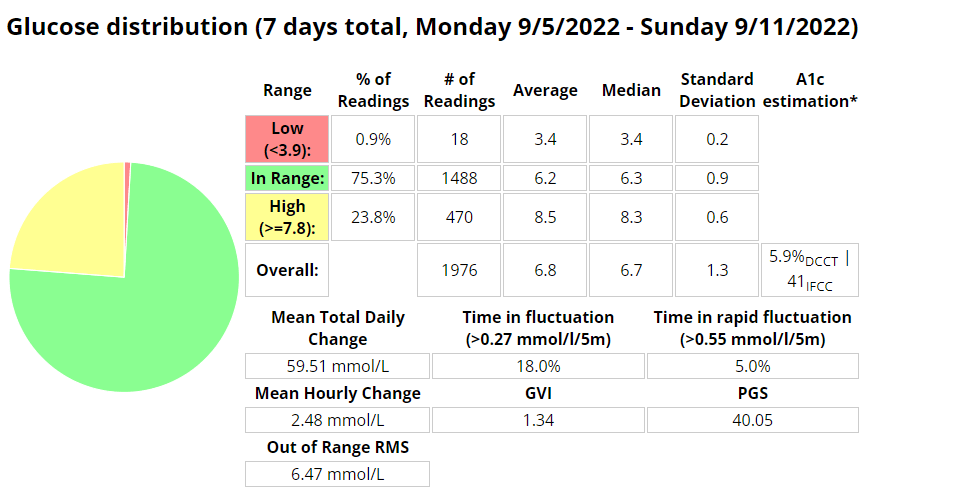
Ideally I want to see a time-in-range (TIR – 3.9-7.8 mmol/l) exceeding 90% with an average in the low sixes and a standard deviation (SD) around one (1).
