Summary
The second week I have gained a little weight (surprise its not muscle) and had a reduction in exercise hours, which was mostly due to a very long ride I had the previous week.
My diabetic metrics have declined and I feel like all of this mostly due to my diet which needs tweaking.
Body Metrics
| Start | Week 1 | Week 2 | Week 3 | Week 4 | |
| Weight (kilograms) | 75.8 | 74 | 75 | ||
| Body fat percentage (according to Samsung) | 17.3% | 17.8 | |||
| Body fat percentage (according to the navy seal calculator) | 15% | 15% | |||
| Total volume | |||||
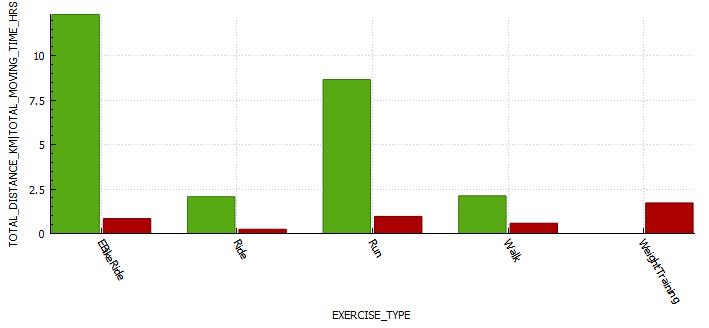
Exercise
| Week 1 | Week 2 | Week 3 | Week 4 | |
| Distance (kilometres) | 25.17 | 20.54 | ||
| Activity (hours) | 4.34 | 3.65 |
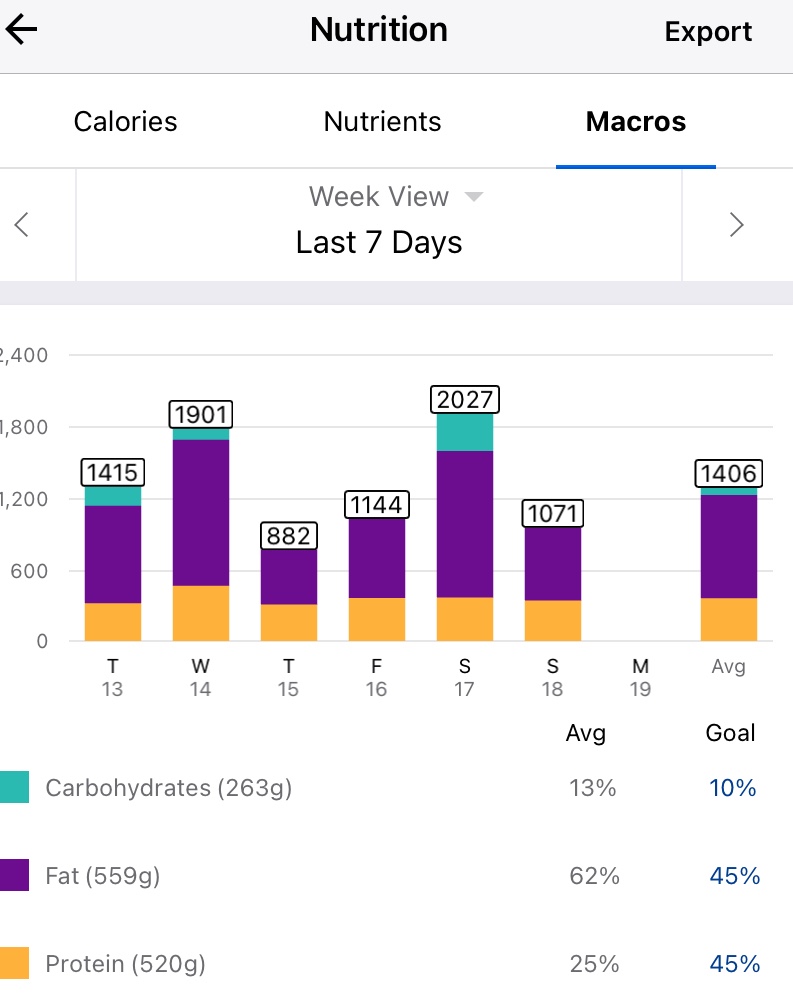
Nutrition

Diabetes

| Week 1 | Week 2 | Week 3 | Week 4 | |
| Low (<3.9) | 0.9% | 0.6% | ||
| In Range (3.9-7.8) | 75.3% | 74.7% | ||
| High (>= 7.8) | 23.8% | 24.7% | ||
| Standard deviation (SD) | 1.3 | 1.7 | ||
| Average | 6.8 | 7.0 | ||
| A1c estimation | 5.9% | 6.0% |
Ideally I want to see a time-in-range (TIR – 3.9-7.8 mmol/l) exceeding 90% with an average in the low sixes and a standard deviation (SD) around one (1).
