Disclaimer: The information contained within this blog post are my thoughts and do not constitute medical advice. Please consult your medical team before making any changes to your diet or blood sugar management program.
I decided to get an analogue bicycle and I have loved the challenge of riding it. I had a terrible GC half marathon (GCHM), complete with muscle spasms, but I finished so that was nice. The training for the GCHM was amazing and I got to run in some pretty interesting places, like the NSW rail trail in Casino.
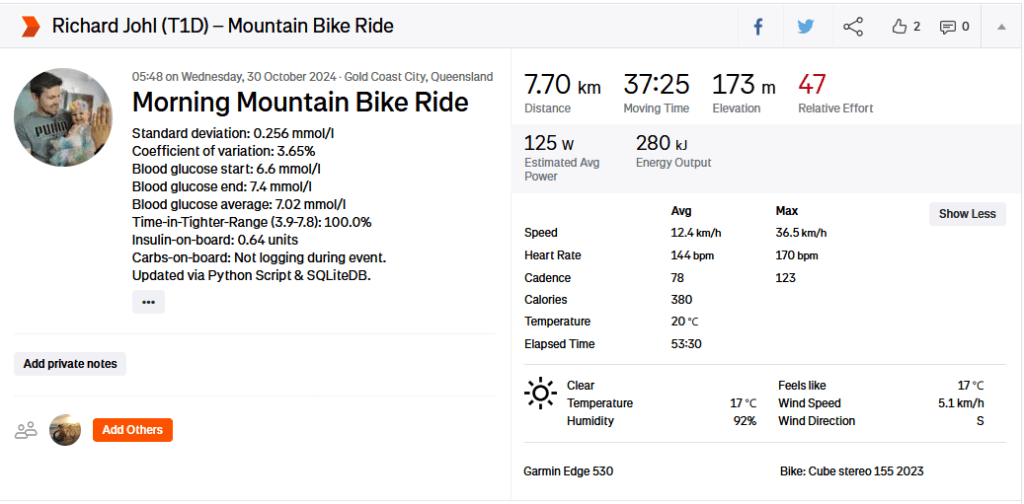
I have developed a host of new features for my Diabetes Analysis Tool, including an integration into Strava, where I update my exercise description with my exercise stats.
Physiological Metrics
I am currently on an average of 42.9 units per day and an average of 150g of carbs per day. These carbs include carbs from fat and protein (gluconeogenesis).
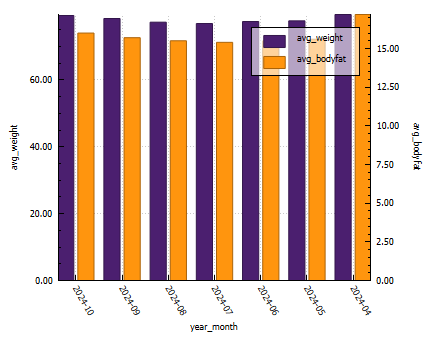
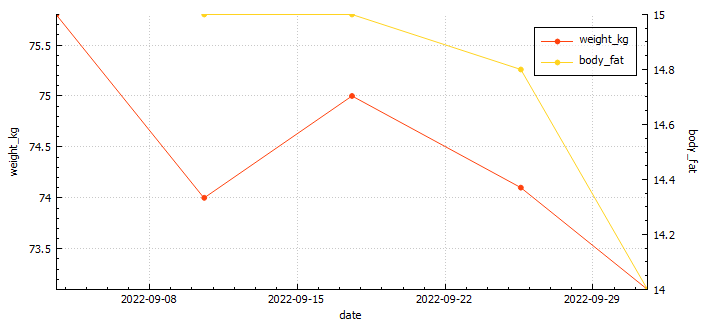
You can see from the graph below that my weight has fluctuated quite a bit this year, with poor eating habits (snacking at night) the biggest contributor to a lower time in range. My lowest bodyfat was 15% (confirmed by 3rd party testing). This dramatic weight shift was due to training for the GCHM.
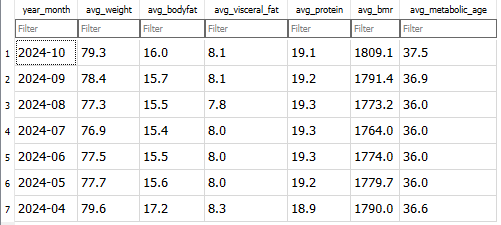
Extract from the Renpho smart scale imported for Analysis.
Weight and Bodyfat graph exported from Diabetic Analysis Tool.
Exercise metrics
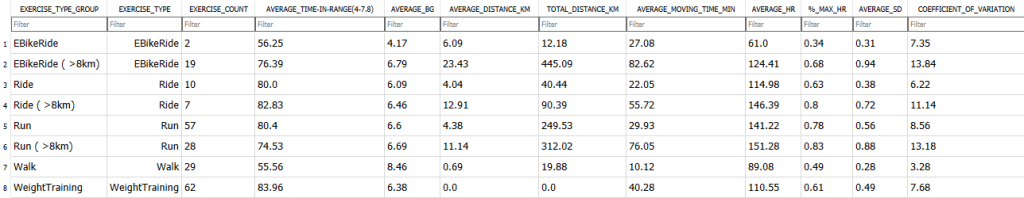
Every year I try to increase my distances and time in range (TIR). This year I increased my TIR by 2%, which is incredible. Although my CV and SD are lower, average glucose is down 0.06 mmol/l. I attribute this to lower insulin closer to exercise time, and refuelling at appropriate time intervals.
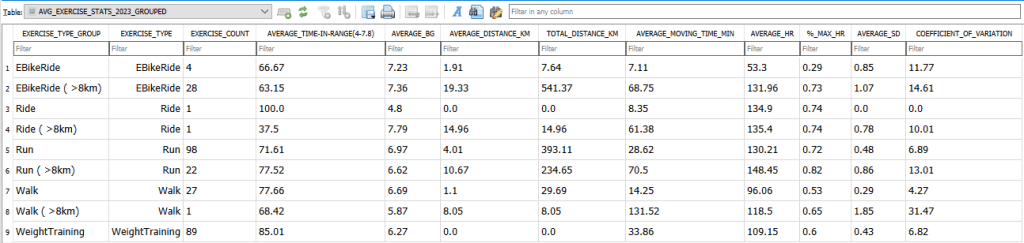
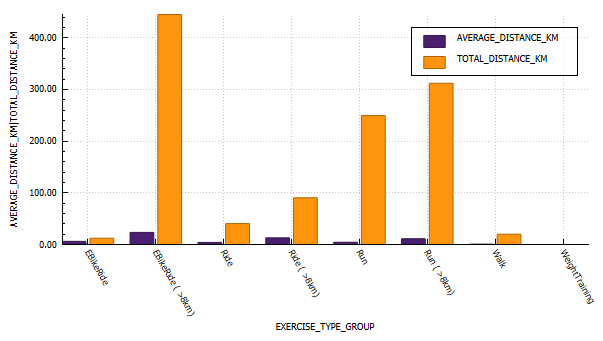
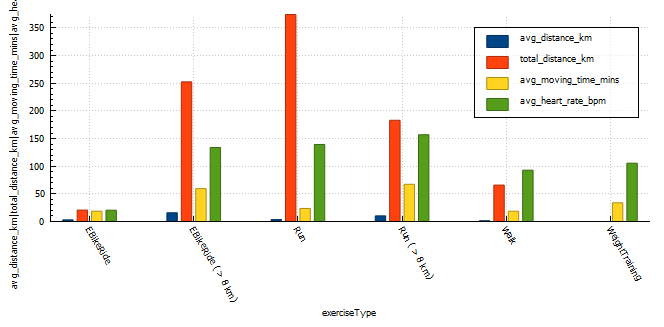
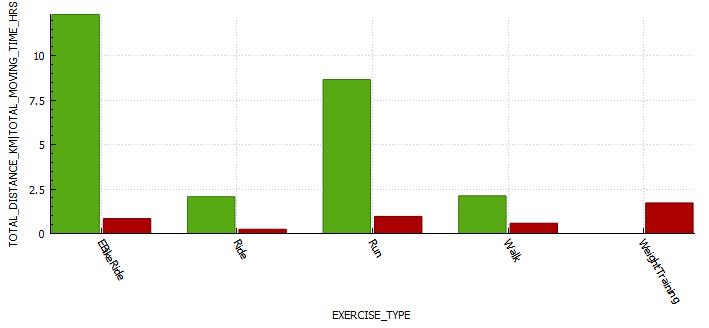
Annual view of exercise stats2024 exercise stats (grouped by distance)2023 exercise stats (grouped by distance)
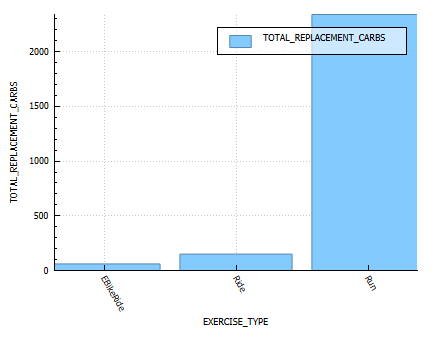
Energy Burn Rates
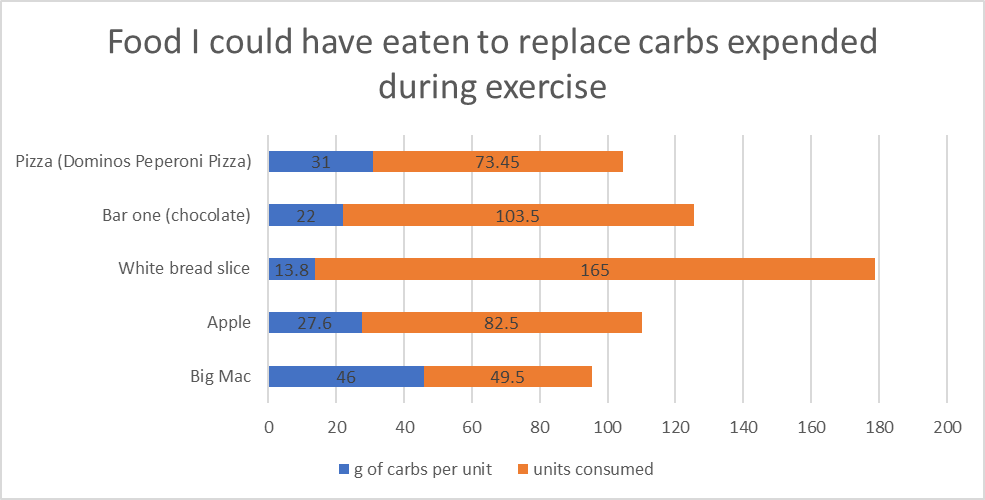
A table of the estimated energy replacement carbs consumed.
Time-in-range (TIR)
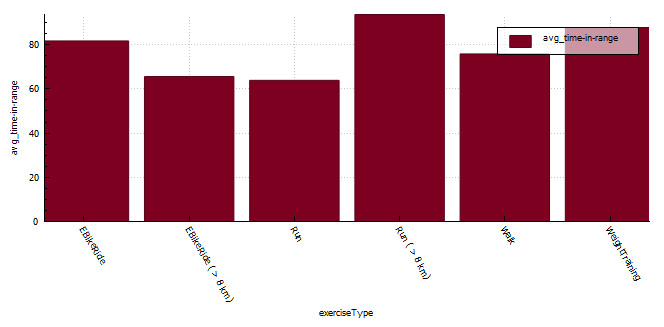
A graph of Time in Range (3.8-7.8) per exercise.
Blood glucose control metrics
Extracted from Nightscout Reporter
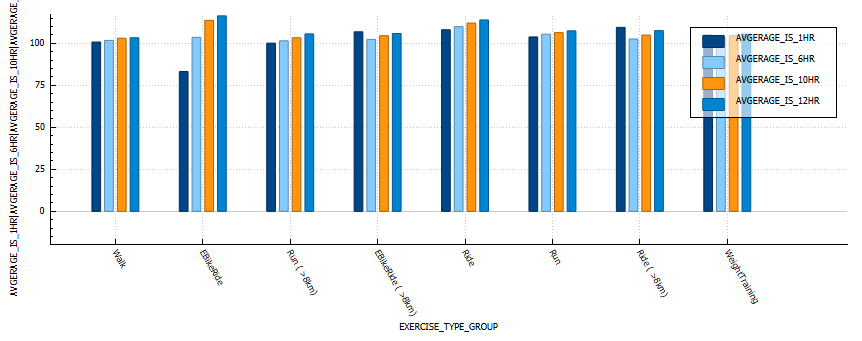
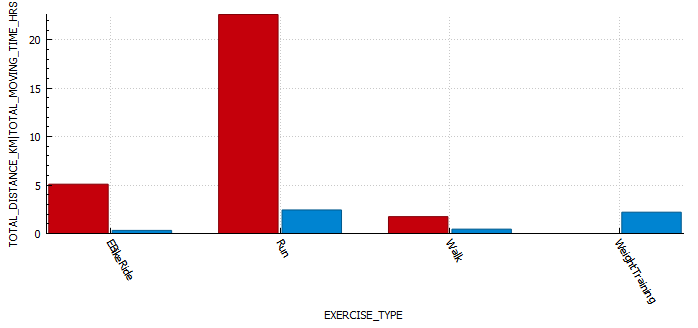
Insulin sensitivity
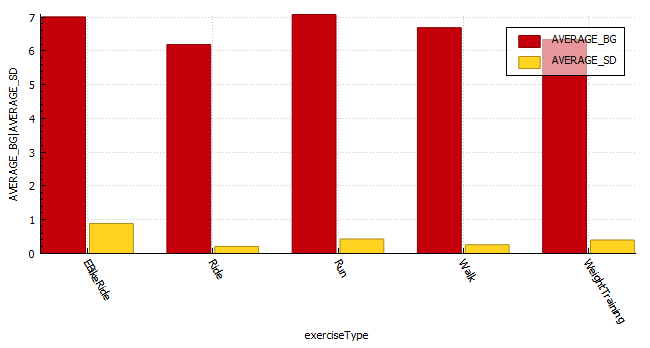
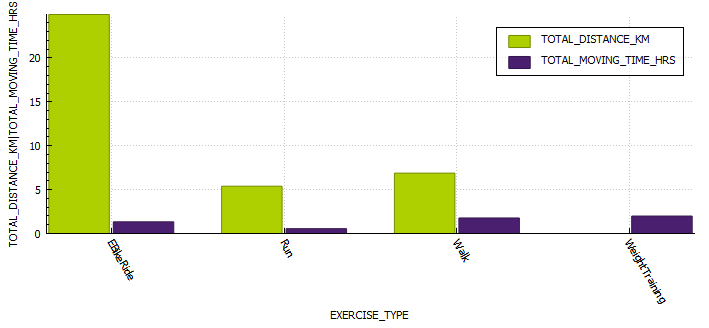
In the below graph we can see that walking and weight training result in the lowest changes in sensitivity.
Graph derived from AVG_EXERCISE_STATS_2024_GROUPED_INSULIN_SENSITIVITY table.
The half marathon has passed. The training this year went well, with no running related injuries to speak of at the point of writing, although I did get food poisoning a week before the race and I missed my last long run. I have learned a lot over the course of the year, which has helped get me to this point. The actual race was a totally different experience, it rained for the first few kilometres, I had stomach cramps and I suffered intense muscles spasms, none of which happened in over a thousand kilometres of my training over the course of the last two (2) years.
Race Day
Race day 2024 was very different than I expected. I felt confident due to all my training. The rain was an annoyance, but one easily overcome by a running jacket (if I race again I’ll get a opaque poncho).
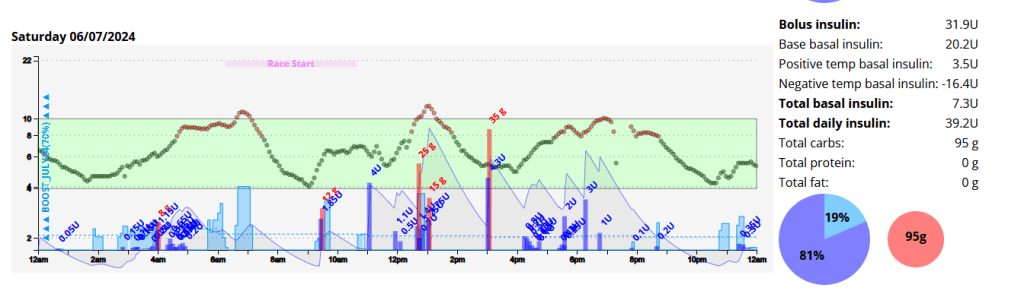
I woke up at 03:50am with little sleep and a blood glucose of 5.8 mmol/l. This crept up steadily, likely due to cortisol and adrenaline. By race start time I was 9.0 mmol/l with 0.9 units of insulin on board (IOB). Due to the IOB I ate about one third of a Cliff Bar (18g of carbohydrates) which in hind-sight was a mistake.
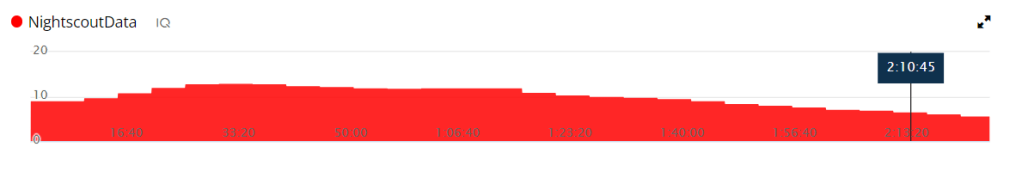
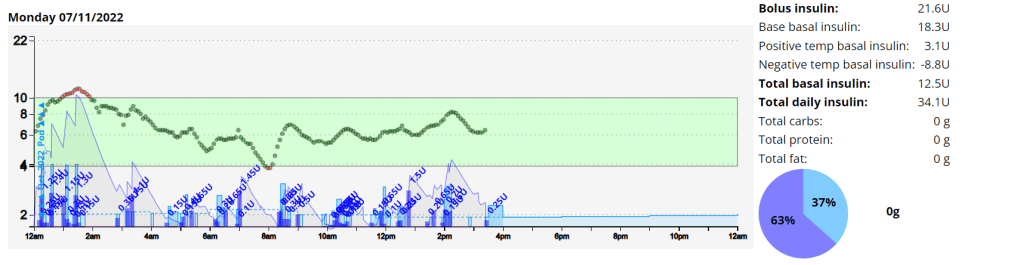
Nightscout graph for the entire day.
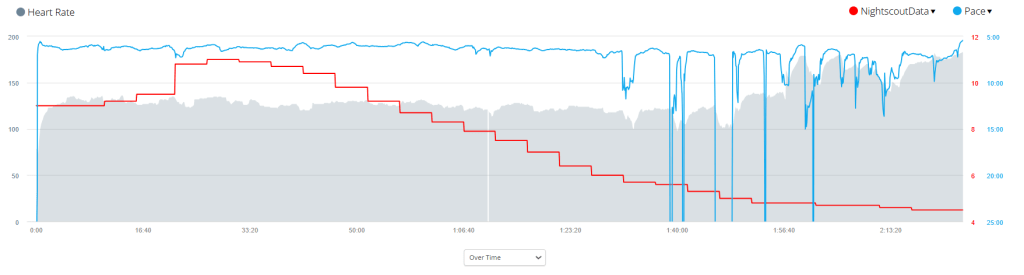
Due to the inclement weather my Garmin didn’t pick up my heart rate on my watch consistency, or perhaps even accurately. I found my Garmin advising I was running at approximately 130 BPM even though I felt I was pushing quite hard. I got a personal best (61 minutes) for the first 10 kilometres.
AAPS graph for race day.
Label
Race Day
Average during Training
Start Time
06:23 am
Distance
21.2km
Average HR
133 BPM
Standard Deviation
2.3 mmol/l
0.8
Coefficient of the variation
31.9%
11.3%
Blood Glucose – start
9 mmol/l
6.5
Blood Glucose – min
4.4 mmol/l
Blood Glucose – max
11.1 mmol
Blood Glucose – average
7.4 mmol/l
6.7
Time in Range (3.9-7.8)
51%
71.9%
Insulin on board
0.99
0.1
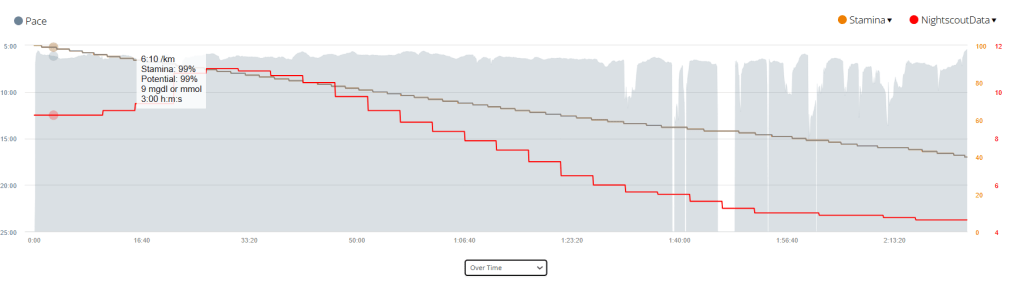
Race day compared to training was wildly different, I will need to analyse the data and come up with a better race day strategy.
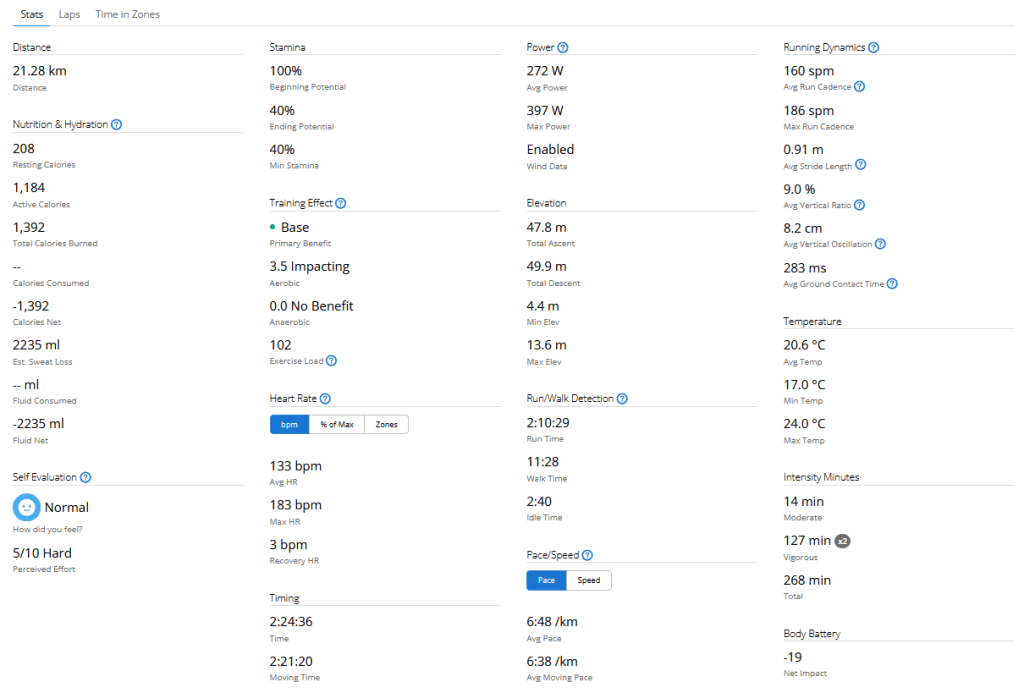
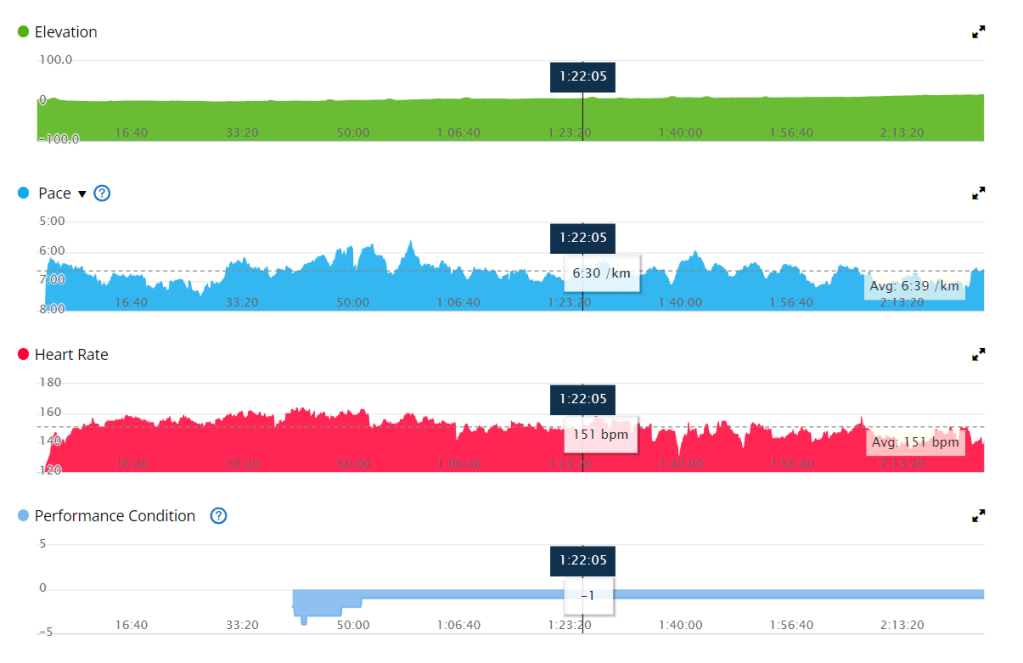
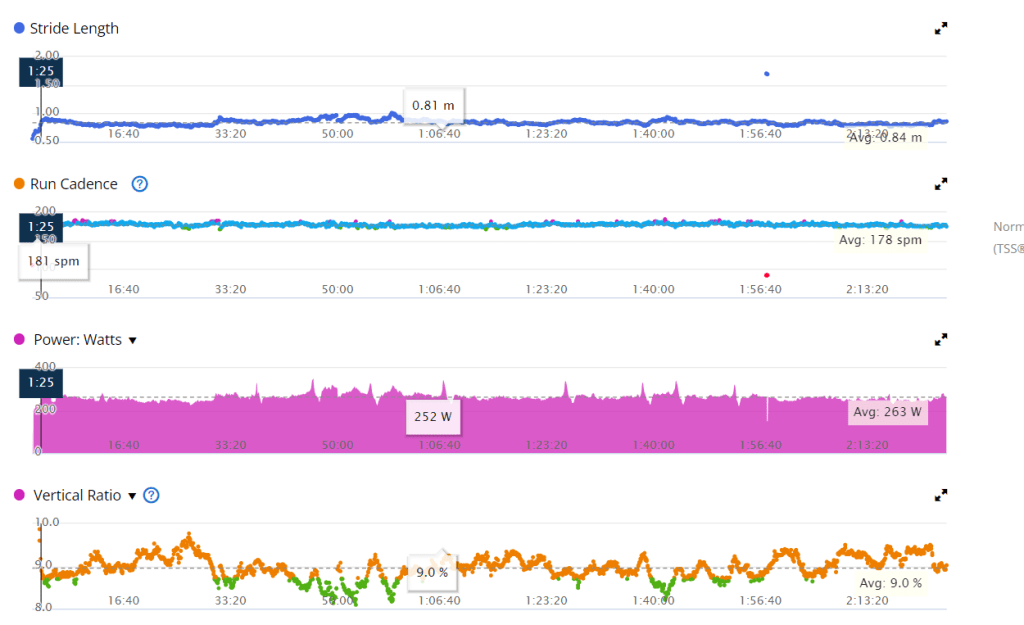
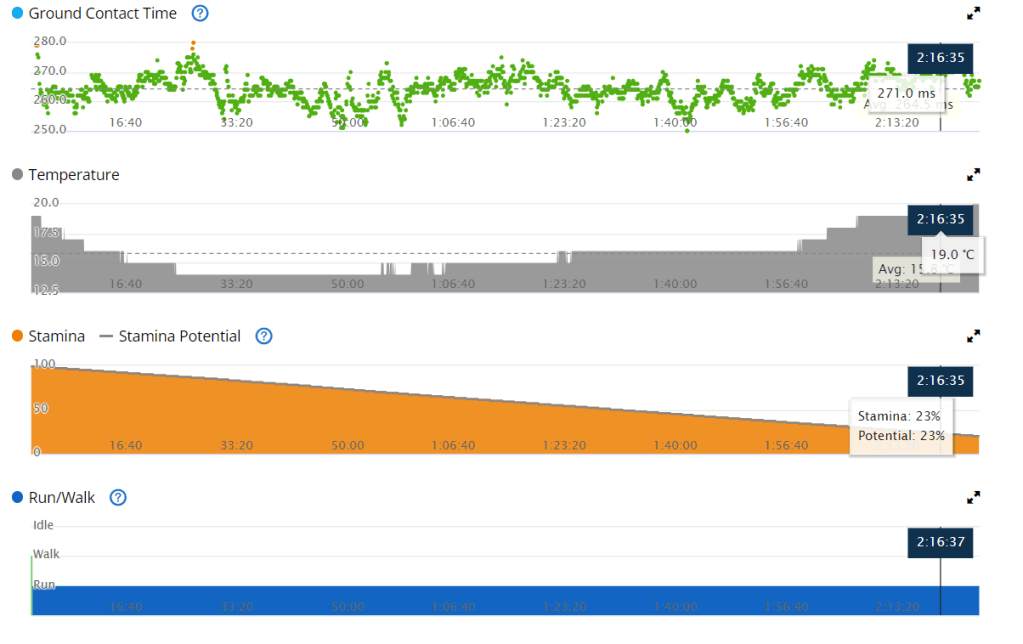
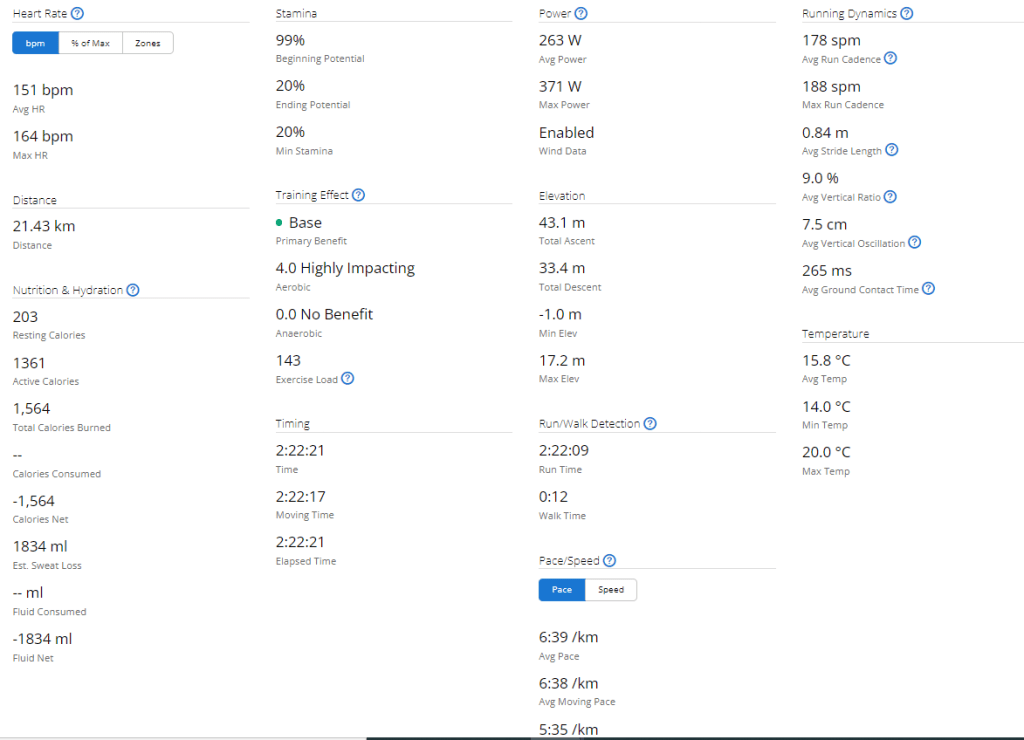
Time vs. Pace with a Stamina and Blood sugar overlay. Time vs. Heart Rate with a Pace and Blood sugar overlay. All Garmin Race Stats
Training
I’ll add the link once all data is processed.
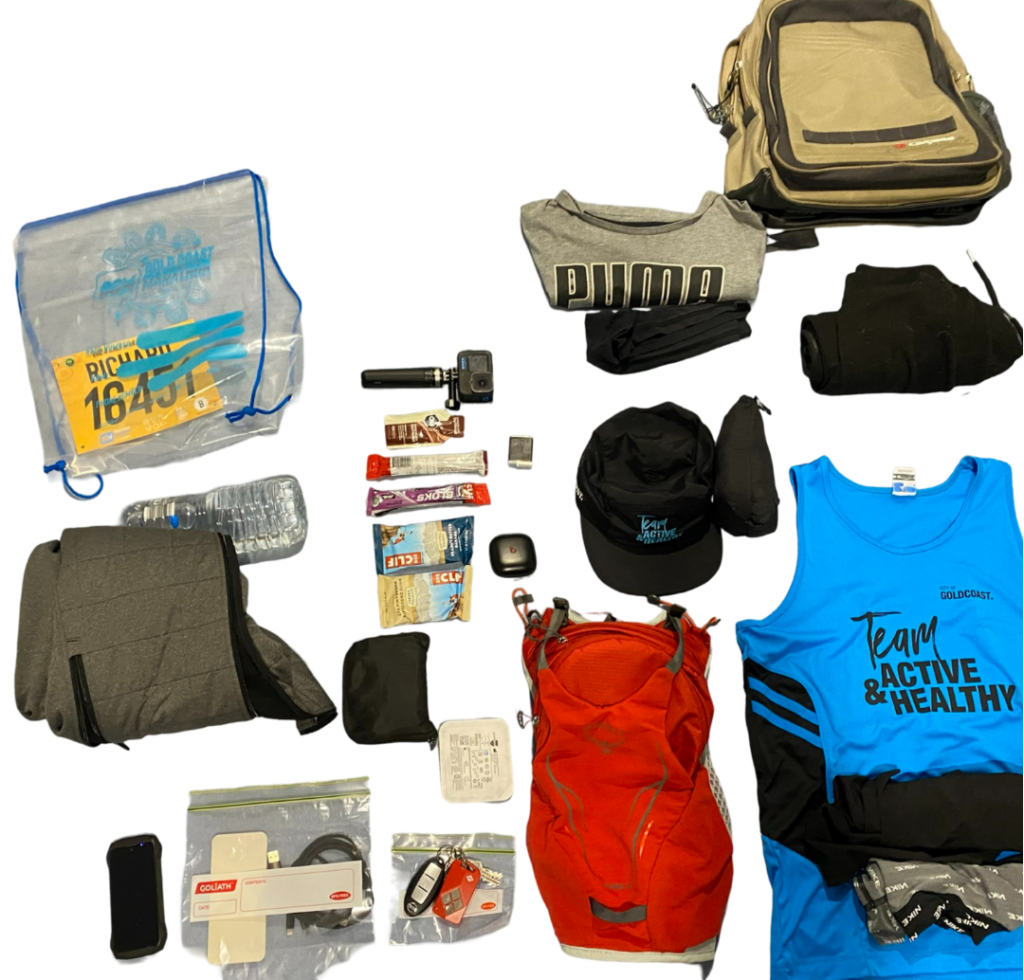
Equipment
I try to come prepared for all possibilities.
This year I spend a lot of time finding the perfect shoe for my unique requirements, namely that I supinate on my right foot due to an atrophied right calf muscle. In my testing, the Brooks Ghost performed the best, allowing me to run any distance with no pain or discomfort.
Final Thoughts
The food poisoning caused an electrolyte balance, which resulted in muscle cramps on race day. This was something I had not experienced during my training, an I was ill prepared for it.
My sugars were higher than during training again, and if I do this again I will refrain from coffee or any carbs prior to the event.
It’s been just over a year since I permanently switched to the Omnipod, and my experience has been a blend of highs and lows. Despite a slight increase in my A1C from 5.7% to 6%, in part due to increased carbohydrate consumption, I appreciate the benefits of the Omnipod’s tubeless design. Not having to deal with tubes and the convenience of the Omnipod’s form factor have made managing my diabetes a bit less intrusive.
However, the transition hasn’t been without challenges. The Omnipod system requires immediate activation upon insertion, which can cause insulin resistance due to the initial trauma of insertion. Its design also means that you experience any issues with insulin resistance or site trauma and need to change a pump early, it can be a costly endeavour. This resistance is difficult to manage, especially around meal times when precise insulin delivery is crucial.
Another problem I encountered was tunnelling, where insulin leaks out from the cannula site. This not only affects insulin delivery but can also cause irritation. The excipient nicotinamide in the insulin formulation has also caused some site reactions for me so I mix insulin with a 50-50 ratio with Humalog. Please note this is off label.
Tips and Tricks I’ve Learned
Despite these challenges, I’ve discovered several strategies to improve my experience with the Omnipod:
Adjusting Insulin Profiles:
When installing a new pump, I set my profile to 120% to counteract any initial insulin resistance.
I try to install the pump a few hours before or after a meal to avoid the insulin resistance coinciding with a meal.
If I miscalculate the timing and need to change a pump around meal times, a short 5-10 minute walk on the treadmill helps improve insulin absorption.
Securing the Cannula:
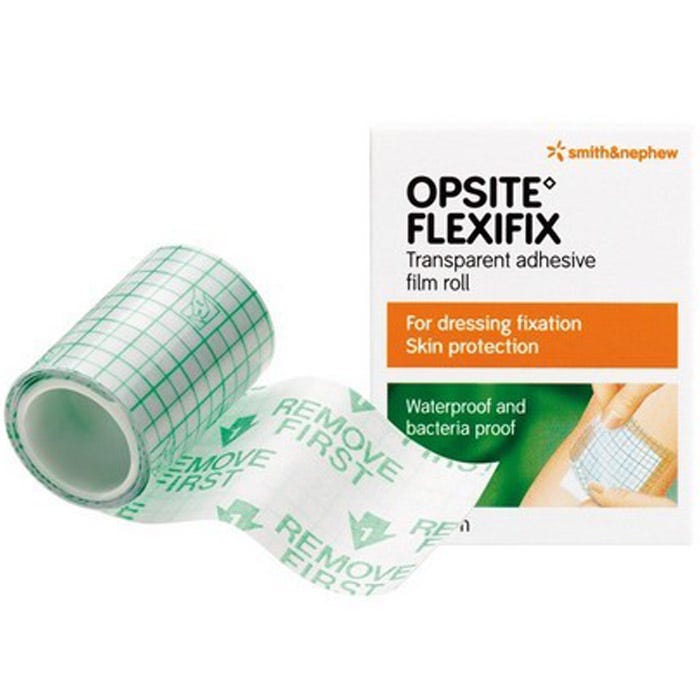
Using Opsite Flexifix under the pump has been a game-changer. It keeps the cannula in place and reduces the need to replace the pump after activities like running.
For additional security, I use Smith+Nephew Primaflex Plus or Fixomull stretch over the pump. I use an old pump or the over-tape provided by Dexcom as a template to cut pieces as needed.
These tips have significantly improved my experience with the Omnipod, making blood sugar management more consistent and reducing the frequency of pump replacements due to physical activity.
Interesting Facts and Supporting Information
A1C and Diabetes Management: An A1C level of 6% is considered good diabetes control. According to the American Diabetes Association, an A1C below 7% is recommended for most adults with diabetes .
Insulin Absorption: The angle and method of insulin delivery can impact absorption. Studies have shown that the angle of insertion can affect how well insulin is absorbed, with certain angles potentially causing more issues like tunneling .
Use of Adhesives: Using adhesives like Opsite Flexifix can help secure insulin pumps, reducing the risk of dislodgement and improving insulin delivery reliability .
In conclusion, while my journey with the Omnipod has had its ups and downs, the freedom from tubes and the ability to manage my diabetes with less visible technology are significant benefits. With the right strategies, I’ve been able to mitigate some of the challenges and maintain effective blood sugar control.
The Dawn Effect and Blood Glucose: When we wake up in the morning, our body experiences a surge of hormones, commonly referred to as the “dawn effect” or “dawn phenomenon.” This natural hormonal response can lead to an increase in blood glucose levels even before we consume any food or engage in physical activity. Cortisol, growth hormone, and other hormones play a role in this phenomenon. For individuals with diabetes, the dawn effect can pose challenges in maintaining stable blood glucose levels, especially during a race. The hormonal surge may contribute to higher blood sugar levels, making it crucial to adjust your diabetes management routine accordingly.
This graph shows the average blood sugar during training vs. my blood sugar from the Gold Coast Half Marathon.
Training vs. Race
Average distance (km)
Average time (min)
Average HR (bpm)
TIR (3.9 – 7.8)
Average Blood Glucose (mmol/l)
Coefficient of variation (%)
Pace
Training
14
92
156
92%
5.8
14
6:40
Race
21.4
140
151
21.4%
9.9
22.54
6:39
This table shows the average metrics during training vs. the same metrics during the Gold Coast Half Marathon.
Blood Glucose Management: Pre-Race Strategies: To optimize your blood glucose levels during a race, careful planning and preparation are key.
Here are some strategies to consider:
Race Day Automation: If you use an insulin pump or automated insulin delivery system, consider setting up a race day automation plan. Gradually reducing your insulin on board (IOB) and raising your blood sugar target before the race can help mitigate the impact of the dawn effect.
The automation I use if I plan on exercising at 06:30am. I use 05:00 – 06:00 so that if another automation is active at 05:00am there is opportunity for this automation to run after that one completes.
Timing of Pre-Exercise Snacks: To align the digestion of carbohydrates with the energy demands of the race, it is important to time your pre-race snack appropriately. If your blood glucose is around 5 mmol/l before starting, consuming a carbohydrate-rich snack approximately 15 minutes before the race can help maintain stable blood glucose levels, in my experience cliff bars have the perfect amount of nutrients for a long run.
Managing Blood Glucose During the Race: Once the race begins, various factors can influence your blood glucose levels.
Here are some considerations to keep in mind:
Listen to Your Body: Pay attention to any signs or symptoms that may indicate fluctuations in your blood glucose levels during the race. Feeling lightheaded, fatigued, or experiencing unusual thirst may indicate the need for carbohydrates. Regular Blood Glucose Monitoring: Carry a portable blood glucose meter to monitor your levels throughout the race. This will enable you to make timely adjustments and take appropriate remedial actions when necessary. Carbohydrate Consumption: Plan to consume carbohydrates during the race to maintain your blood glucose within a desirable range. Experiment with different forms of carbohydrates, such as gels, sports drinks, or energy bars, to find what works best for you. Remember to consider the impact of any exercise-induced insulin sensitivity and adjust your carbohydrate intake accordingly.
Data Extract from AAPS.
Post-Race Recovery: Upon crossing the finish line, it’s essential to prioritize your recovery and address any pain or discomfort that may have emerged during the race. Be mindful of the following:
Musculoskeletal Discomfort: Races can place significant stress on your body. Pay attention to any pain or discomfort in your muscles, joints, or tendons. Consult with a healthcare professional if necessary to address any post-race injuries. Blood Glucose Check: After the race, continue monitoring your blood glucose levels as they may fluctuate due to post-exercise hormonal responses. Adjust your post-race nutrition and insulin dosages accordingly.
Conclusion: Participating in a race as a person with diabetes requires careful consideration of blood glucose management strategies. Understanding the impact of waking up on hormonal levels, adjusting your approach accordingly, and incorporating remedial actions during the race are crucial steps towards maintaining stable blood glucose levels. By staying vigilant, prepared, and responsive to your body’s needs, you can conquer the challenges of a race while managing your diabetes effectively.
References:
American Diabetes Association. (2021). Diabetes and Exercise. Retrieved from https://www.diabetes.org/healthy-living/fitness/exercise-and-type-1-diabetesGupta, L., Khandelwal, D., Singla, R., Gupta, P., Kalra, S., & Dutta, D. (2017). Dawn Phenomenon and Its Impact on Blood Glucose Control. Indian Journal of Endocrinology and Metabolism, 21(6), 901–909. doi: 10.4103/ijem.IJEM_284_17
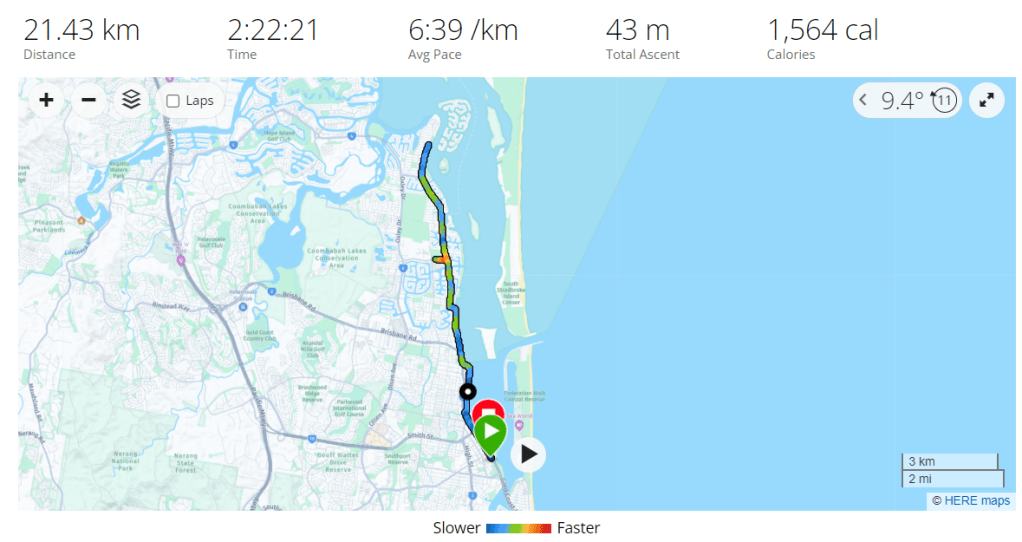
Exercise stats from Garmin
Equipment
Equipment Name
Note
Osprey duro 6 – Hydration pack
This hydration pack is a great option for long runs or cycles. It holds 1.5 liters of water, which is more than enough for most people to drink on a 2+ hour activity. It also has multiple pockets at the front of the vest, which allow you to store food, your phone, and your blood glucose meter. This makes it easy to access your essential items while you’re running or cycling.
Glucose gels
My general rule of thumb is bring at least twice the amount you expect you will need.
Cliff bar
The cliff bar was a new addition to my nutrition. These bars seemed to work well to stabilise blood glucose and I required no additional carbs for most runs between 14-18km.
Blood glucose meter + extra strips
If my sensor were to fail or I was to become dehydrated enough that my CGM reading was inaccurate I wanted to be able to assess my blood glucose.
Dexcom
Continuous glucose monitor. I ensured this had at least 24 hours to settle before the race. This way readings would more accurate.
Android APS phone
The phone that contain my artificial pancreas system.
Onmipod Dash
Bluetooth enabled insulin pump, allowing me to use Android APS. I ensured that I inserted the pod at least a day before the race so I had enough time to identify issues.
Brooks Ghost shoes
A comfortable pair of shoes you have tested and run in prior to the race. I still developed blisters so its imperative you get the correct size.
Asics running socks
A comfortable pair of socks.
Hat
A hat to ensure I don’t burn.
earbuds
To enjoy some music while I run.
Training
To prepare for the Gold Coast Marathon I did the following exercise;
Disclaimer: The information contained within this blog post are my thoughts and do not constitute medical advice. Please consult your medical team before making any changes to your diet or blood sugar management program.
So far 2022 has been quite the year. With the return to my work offices Its been rather difficult to reach many of the goals I set myself, but I did make progress. It seems 2023 is set to be a particular difficult year, but perhaps this will be the inspiration I need to make some positive changes. The Python scripts I wrote to export data from Nightscout to create my mountain bike videos seem to be working well and I can’t wait to make a few more videos.
I was curious to see if there were any differences in insulin sensitivity between longer and shorter activity durations, as well as higher intensity (where average heart rate was more than 80% of max heart rate) training and it seemed there was, it just wasn’t what I was expecting.
My average total daily dose (TDD) for 2022 was 32.9 units per day. If we analyse my aerobic activity (ride and runs) for the year and we use my sensitivity ratio from AAPS for 24 hours post exercise, I calculate that I saved 256 units of insulin in 2022 through exercise due to increased insulin sensitivity. During aerobic activity I consume 12g of carbs on average per 30 mins of activity unless I am exercising fasted. I can use this input to calculate that I ate 2277g of carbs during 2022. I would need 311 units of insulin to absorb 2277g of carbs. Since I don’t add carbs to AAPS while exercising I don’t have the exact numbers but I do believe this calculation to be pretty accurate. That equates to 49 Big Mac burgers / 82 Apples / 73 slices of Dominos peperoni pizza that I got to eat without insulin as a direct result of exercise.
Exercise metrics
Analysing my exercise metrics I found that I was spending way too much time exercising at more than 75% of heart rate max, this would be hampering performance and building endurance. I did eighteen (18) runs at a distance greater than 8km, an improvement over the two (2) I did in 2021. I also managed my longest run ever at 16km.
exercise type
exercise count
total distance (km)
average distance (km)
average moving time (minutes)
average heart rate (bpm)
EBikeRide
7
20.64
2.95
18.65
N/A
EBikeRide ( > 8 km)
17
252.4
15.7
59.4
133.8 (72% max HR)
Run
108
374.25
3.47
23.5
139.26 (75% max HR)
Run ( > 8 km)
18
183.1
10.1
67
156 (85% max HR)
Walk
48
65.8
1.37
18.6
93 (50% max HR)
WeightTraining
65
0.0
0
33.77
105 (57% max HR)
TOTAL
262
896
5.6
36
125 (68% max HR)
Exercise stats table for 2022
Time-in-range (TIR)
The longer distance running seem to result in the best time-in-range (TIR) (3.9-7.8 mmol/l) but I do feel that these runs also seem to happen at a similar time in the morning where I have more control over insulin-on-board (IOB) and carbs-on-board (COB) and I am the most resistant to insulin. My heart rate is also far more consistent (aerobic) during running than when mountain biking ( aerobic / anaerobic ).
If I start digging into the data for short runs more closely I find that;
TIR (3.9-7.8 mmol/l) from 04:00am – 10:00am is 63%
TIR (3.9-7.8 mmol/l) from 10:00am – 13:00pm is 83%
TIR (3.9-7.8 mmol/l) after 13:00pm is only 23%
exercise type
exercise count
time-in-range (%)
EBikeRide
7
81.67
EBikeRide ( > 8 km)
16
65.56
Run
108
56.8
Run (04:00 – 10:00 am)
18
63.8
Run (10:00 – 13:00 pm)
61
83.6
Run (13:00 – 10:00pm)
29
23.02
Run ( > 8 km)
18
93.6
Walk
45
75.8
WeightTraining
65
87.7
Exercise time-in-range table for 2022
Blood glucose control metrics
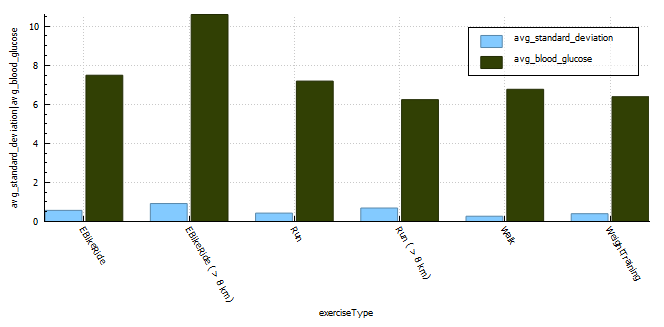
The exercise that resulted in the lowest blood glucose fluctuations is walking with a CV of 4%. The exercise with the second lowest CS was weight training. I generally try to train with a little insulin-on-board to counteract the hormones released during training and I don’t need to set a high temp target in the lead-up to the activity, thus my reading is much lower at exercise commencement. The third lowest is short runs (< 8km) with CV of 6%. The higher blood glucose average will be a direct result of me setting a higher temp target (8 mmol/l) prior to exercising, but the duration of activity isn’t long enough to reduce the blood glucose substantially resulting in the high average. Long runs seem to result in the least stable blood glucose values with a CV of 12% but the average for long runs is lower as the sustained activity reduces blood glucose. I suppose on these longer runs I do consume a minimum of 30g of ultra-fast acting carbs (glucose, dextrose) which is going to result in some fluctuations in blood glucose.
With coefficient of the variation (CV) a lower percentage is indicative of more stable blood glucose readings.
exercise type
exercise count
average standard deviation
average blood glucose
average coefficient of the variation (CV)
EBikeRide
7
0.57
7.49
8%
EBikeRide ( > 8 km)
16
0.92
10.6
9%
Run
108
0.43
7.19
6%
Run ( > 8 km)
18
0.69
6.24
11%
Walk
48
0.27
6.77
4%
WeightTraining
65
0.4
6.39
6%
Exercise breakdown for 2022
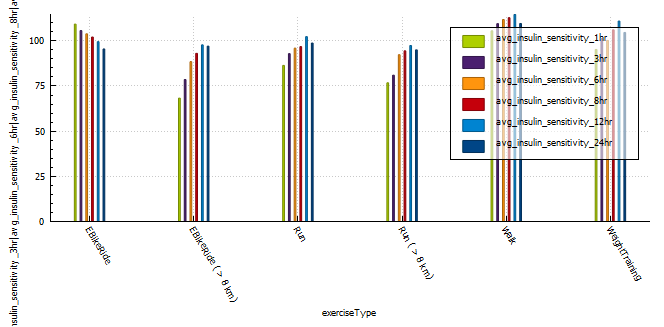
Insulin sensitivity
A very interesting observation was that longer, more intense activity resulted in sensitivity returning to normal quicker than less intense or shorter activity. Runs shorter than 8km resulted in a massive 12% insulin reduction for 24 hours post activity, that’s around 6.5 units less insulin in a 24 hour period. Long E-Bike rides resulted in the largest increase (35%) in sensitivity 1 hour post activity, with shorter E-Bike rides the second largest increase in sensitivity. Runs longer than 8 km increased sensitivity (25%) the third most, but the body seemed to return to normal more quickly than the shorter runs and was almost back to normal within 12 hours of activity.
(NOTE: I can’t comment on the validity of the results, only that patterns exist after exercise that are not usually observed in the absence of aforementioned exercise.)
average insulin sensitivity
exercise type
exercise count
1 hr post exercise
3 hr post exercise
6 hr post exercise
8 hr post exercise
12 hr post exercise
24 hr post exercise
EBikeRide
7
109
105
103
102
99
95
EBikeRide ( > 8 km)
16
68
78
88
93
97
79
Run
108
86
92
95
96
102
98
Run ( > 8 km)
18
76
80
92
94
97
94
Walk
48
105
109
111
112
114
109
WeightTraining
65
95
101
100
106
110
104
Average insulin sensitivity for multiple time blocks post exercise grouped by exercise type.
Profile Adjustments vs. Temporary Targets (TT)
In the past I used a combination of a 30% reduction in profile and a temporary target of 7 mmol/l while exercising.
This seemed to work quite well, with the caveat that profile adjustments can result in your autosens data being reset if you cancel the adjustment earlier than set.
One way to combat this is to set a higher temp target, this will not effect sensitivity data and can be cancelled at any time without needing to update the basal insulin profile in the pump of effecting autosense data. In order to do this I analysed the adjustments I was using to calculate a temp target that should reduce my insulin enough to keep me in range for the duration of activity.
It’s diabetes awareness month and so I wanted to talk to you about something I am very passionate about, Android artificial pancreas system (AAPS). It’s not the cure I wanted but as far as I am concerned, it’s the closest to normal I have felt in the 25 years I have been a diabetic.
Why ILOVEAndroid APS
I decided to try Android APS just prior to the birth of my daughter. At the time I was using multiple daily injections (MDI) on a low-carb diet (less than 45g per day excluding protein and fat) and trying to pick up some muscle. I found it rather challenging to eat the number of carbs the trainer suggested without compromising control. I was also anticipating the late nights having a baby entails and I wanted to be prepared. David Burren’s blog provided a blueprint of what could be expected if I committed to investing the time required to perform all necessary testing and fine-tuning.
Benefits of Android APS
Meal management
Meals can be managed through a number of mechanisms including;
Un-announced meals (UAM) – AAPS boluses insulin without intervention or carb entry.
Announcing carbs – Add the carbs into the system and the calculator estimates the amount of insulin required based on your COB, IOB, ISF, current blood glucose, blood glucose deltas, and insulin sensitivity.
Extended carbs – typically used to mimic the absorption of protein (gluconeogenesis) or delayed gastric emptying caused by high-fat meals.
Exercise management
Insulin scaling adjusts basal insulin based on current insulin sensitivity
Automations allow you to schedule profile changes and temporary blood sugar targets for the duration of activity or condition.
Directly or indirectly (via Nightscout) display various blood glucose-related data on compatible watches. If you are using an Android watch (WearOS) you can control AAPS via the watch. Garmin watches can display blood glucose data during an activity.
Utilise the blood glucose data from a wide variety of CGMs (continuous glucose monitors)
Software
Automations allow you to automate system actions based on conditions (eg. blood glucose increasing, blood glucose decreasing, leaving for work, pump disconnect) or schedules.
Highly customizable to your unique needs, with certain advanced builds allowing you to control more system variables (Boost, AIMI, Eating Now).
Cutting-edge development
Dynamic insulin sensitivity factor (ISF that changes based on blood glucose)
Improved prediction models
Improved insulin modeling (9-hour DIA)
Quality of Life
Reduced diabetic burden and stress.
Glucose is constantly monitored, with the ability for someone to follow you remotely, including community members. This can assist with fine-tuning settings.
Ability to eat more foods without compromising control
Improved glucose control reduces the possibility of long-term complications.
Safety
Objectives provide a level of safety as users need to understand basic principles of how to use the APS prior to closing the loop.
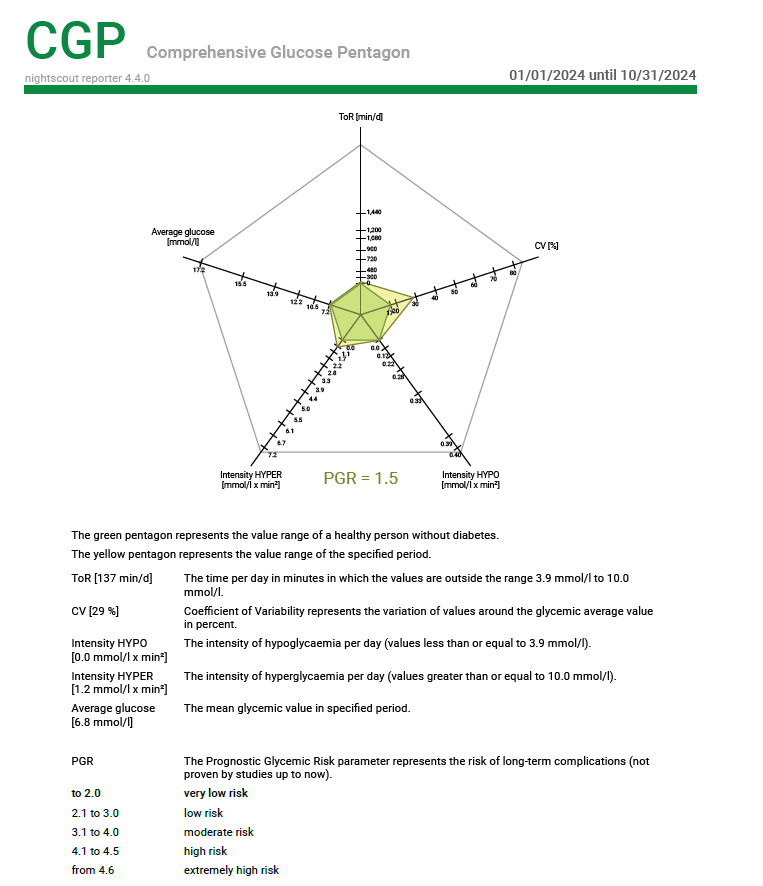
Nightscout reporter provides detailed reports that can assist with APS tuning and a detailed view of your risk rate through the comprehensive glucose pentagon.
As with all DIY systems, you are required to build the application prior to using it.
Cost of hardware
Phone
CGM
Pump and supplies
Connectivity fatigue
The burden of being connected to technology 24/7
Reliance
It is easy to become reliant on AAPS managing blood sugars.
Usability
Due to its complexity, you are required to invest a large amount of time in order to gain the understanding and skills required to configure and utilise it correctly.
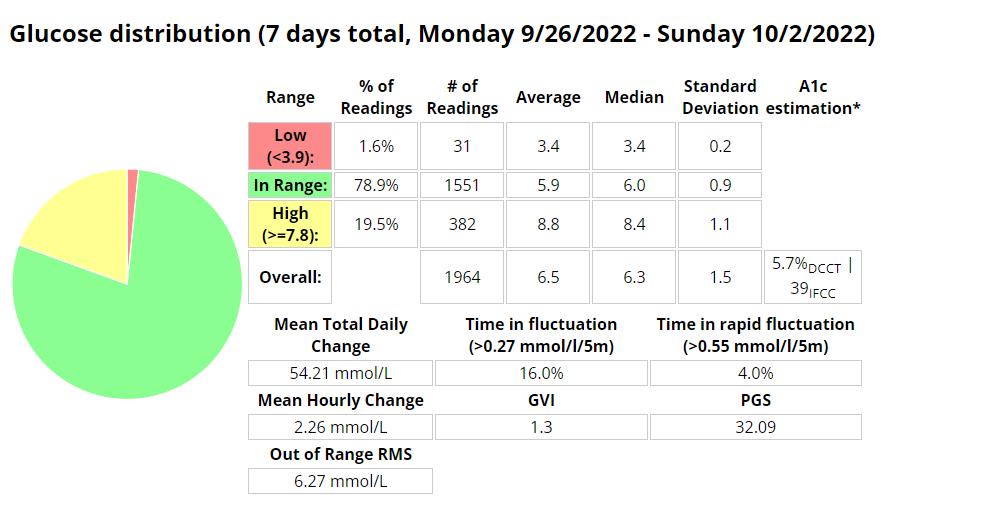
Statistics and examples:
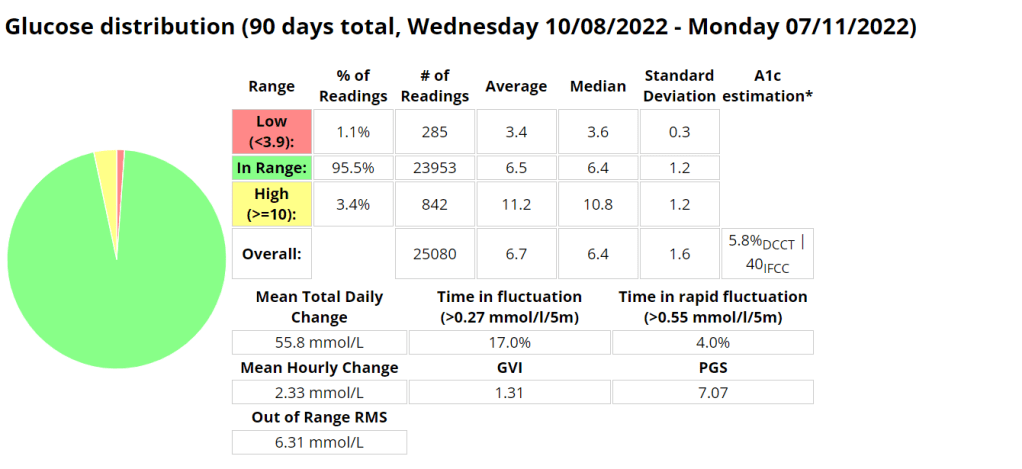
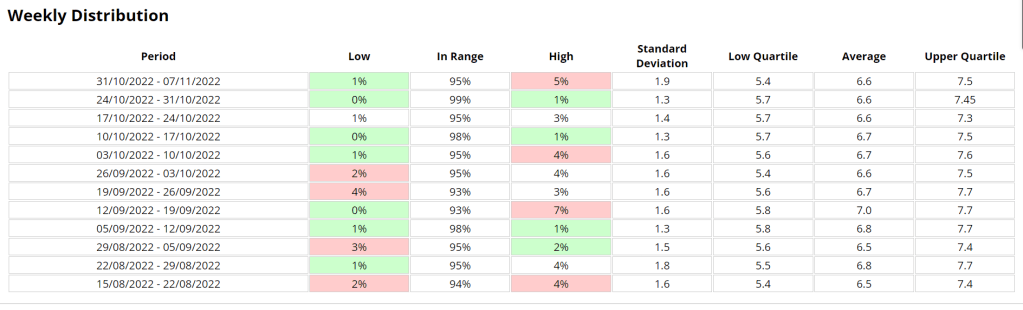
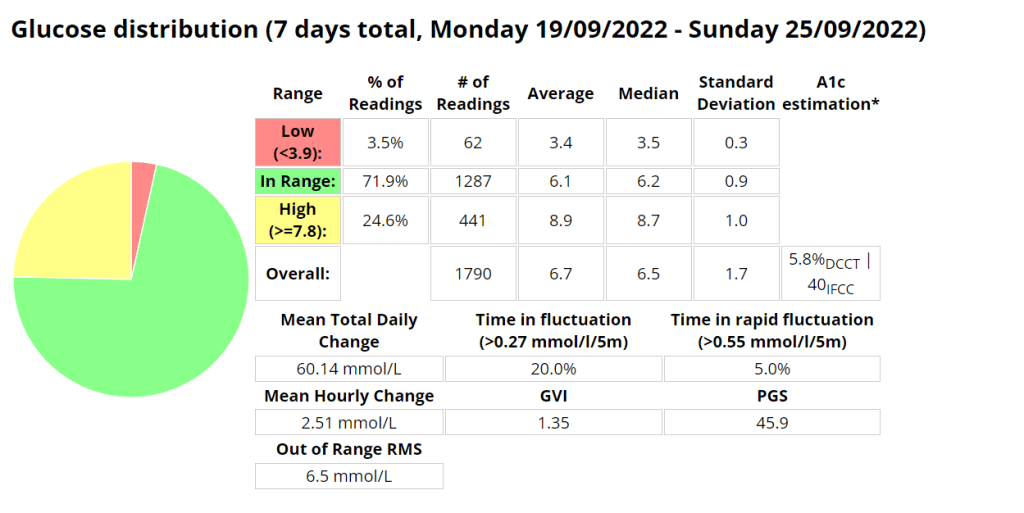
Nightscout statistics – 3 Months
Nightscout blood glucose distribution reportNightscout blood glucose weekly distribution report
Control stats for different systems
Date Started Test
Control Mechanism
e-A1C
Average Blood Glucose
Time In Range (TIR) 3.9 – 10
Standard Deviation
Average carbs consumed
GVI
PGS
CGP – PGR
20/11/2019
MDI
6.1%
7 mmol/l
87%
2.2 mmol/l
1.2
20.33
1.7
20/11/2020
MDI
5.6%
6.3 mmol/l
94%
1.7 mmol/l
< 60
1.17
8.67
1.3
20/11/2021
Loop
5.7%
6.5 mmol/l
94%
1.7 mmol/l
<100 (carb counting)
1.25
8.29
1.3
04/02/2022
Android APS
5.7%
6.5 mmol/l
96%
1.5 mmol/l
>200, little to no carb counting
1.24
5.70
1.2
Analysis stats provided by Nightscout reporter.
Comprehensive glucose pentagon from Nightscout reporter report.
Un-announced meal (UAM) example
Low-carb meal with UAM running (Low-carb bread with cheese, ham, and mayo.)
Extract from Android APS data for a low carb meal
As can be seen above the system manages low-carb meals quite well with no carb inputs from the user. The system constantly monitors for rapid changes in blood sugars and administers insulin when required to quickly brings sugars into range.
Nightscout screenshot of low carb meal being absorbed while AAPS manages sugars.
Exercise stats / examples
Year
Average Time in Range (3.9-7.8 mmol/l)
Average blood glucose (mmol/l)
Average Standard Deviation (mmol/l)
Total Hours
Total KM
2022
80.1 %
6.6
0.43
131
885
2021
71.9 %
6.7
0.4
149
920
2020
69.7 %
6.9
0.7
67
658
Annual improvements are made through tweaking system variables and my approach to exercise.
Weight Training
Date
IOB @ start
Moving time
Exercise Type
Average HR (bpm)
Standard Deviation (mmol/l)
CGM BG Start
CGM BG End
CGM BG Average (mmol/l)
TIR (3.9-10)
2022-10-07
0.14
36.93
WeightTraining
101.1
0.365
7.7
6.8
7.27
100.0%
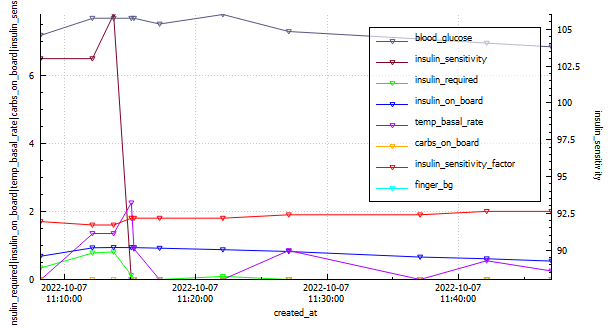
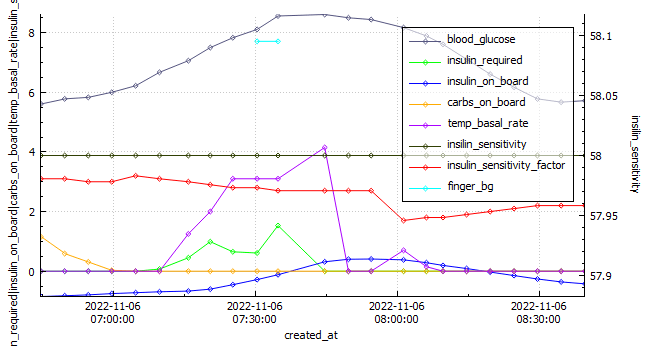
EBike Ride
Android APS data exported during an E-Bike Ride 2022-11-06.
Date
IOB @ start
Moving time
Exercise Type
Distance (km)
Average HR (bpm)
Standard Deviation (mmol\l)
CGM BG Start
CGM BG End
CGM BG Average (mmol\)
TIR (3.9-10)
2022-11-06
-0.849
115.92
eBikeRide
27
143
1.095
5.9
5.8
7.16
100%
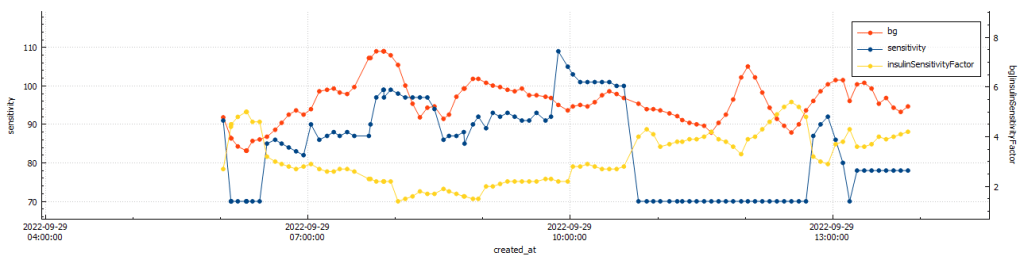
Running
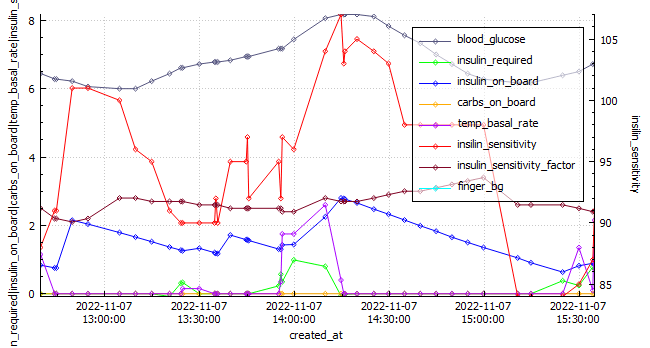
Android APS data exported during a run 2022-10-03.
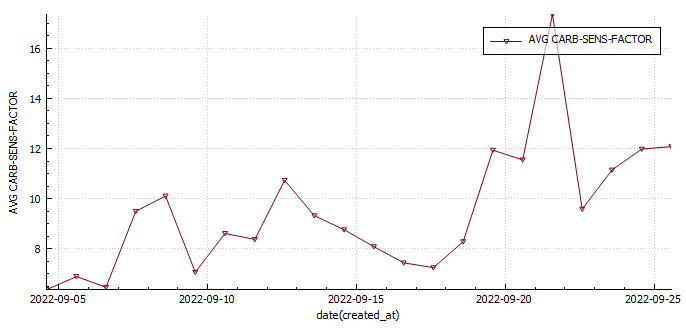
This week was the best so far. I did my longest run to date (12km) and had a really good gym week lifting (approx. 20% more volume). My diabetes control is improving (thank you AAPS and exercise) and I have learned a lot digging though my data and through responses from the previous weeks question regarding carb sensitivity factor (CSF) being used to measure insulin sensitivity post exercise. I made some strides in my glucose management tool which also felt great.
BG vs. ISF vs. insulin sensitivity post gym (@11:48:09 – 42min)BG vs. ISF vs. insulin sensitivity post run (@11:49:30 – 33min)
After gym sensitivity increased to 115% directly post training, while my sensitivity was stable at 78% post my run.
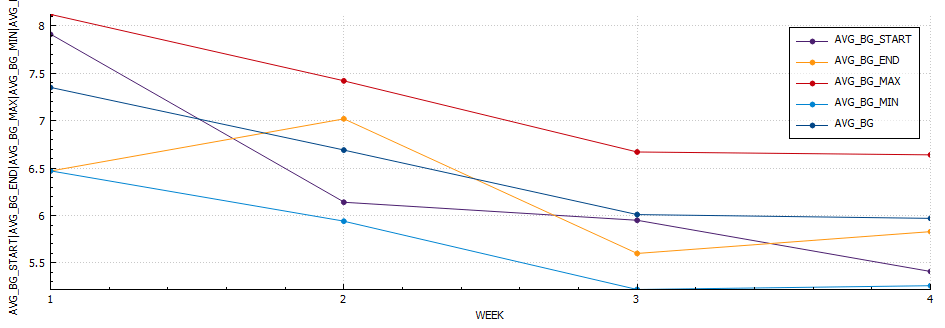
Body Metrics
Body mass vs. body fat
Start
Week 1
Week 2
Week 3
Week 4
Weight (kilograms)
75.8
74
75
74.1
73.1
Body fat percentage (according to Samsung)
17.3%
17.8
*
*
Body fat percentage (according to the navy seal calculator)
15%
15%
14.8%
14%
Total volume
Table stating the weekly body metrics I am tracking.
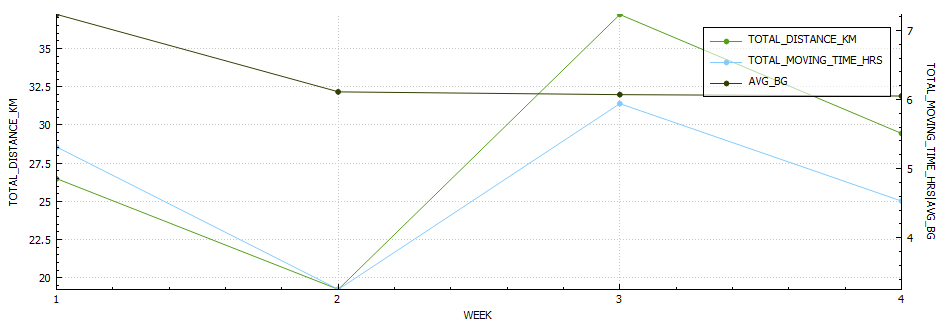
Exercise
Week 1
Week 2
Week 3
Week 4
Distance (kilometres)
25.17
20.54
37.22
29.4
Activity (hours)
4.34
3.65
5.64
5.4
Table stating the weekly exercise metrics I am tracking
Nutrition
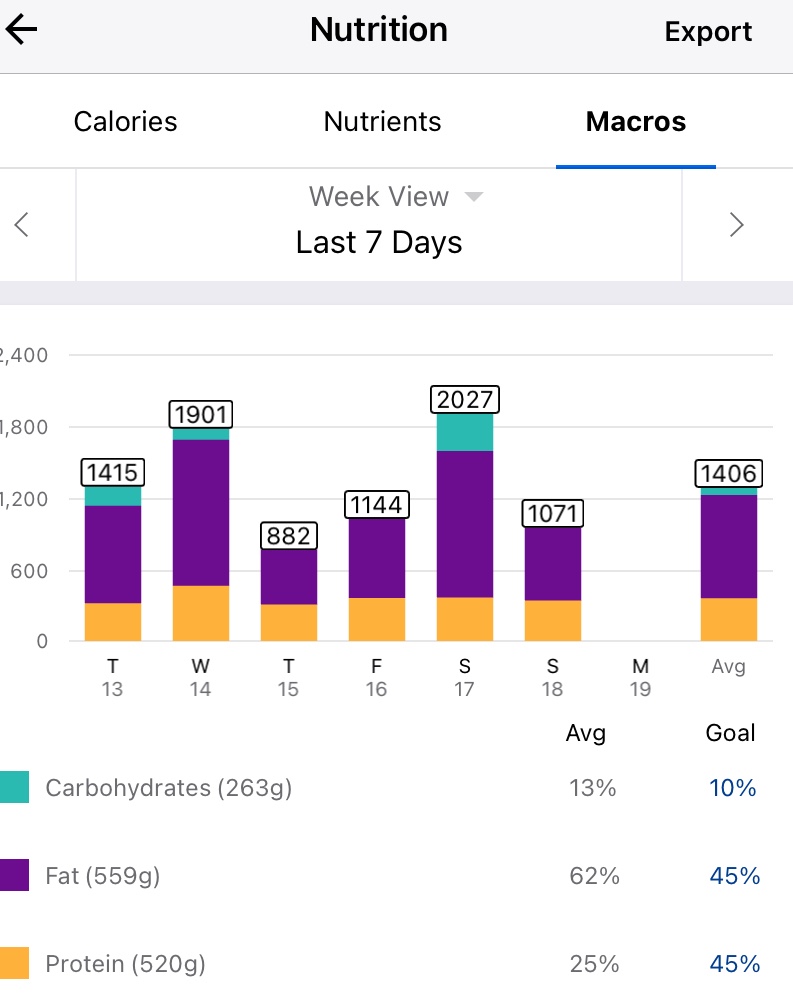
Screenshot of average macro-nutrients consumed during week 4
Screenshot of average macro-nutrients consumed during week 4
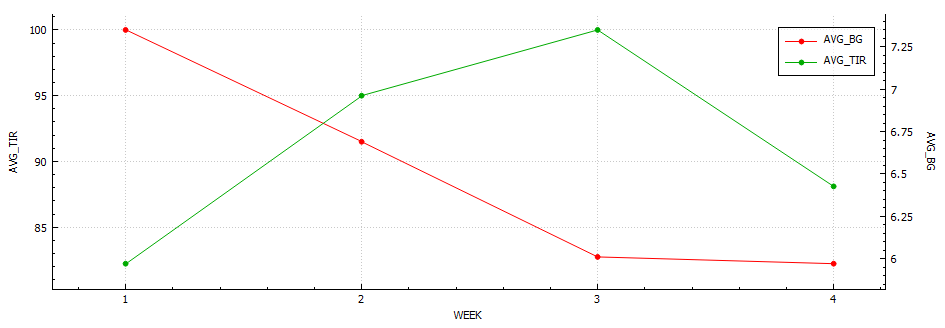
Diabetes
Week 1
Week 2
Week 3
Week 4
Low (<3.9) (%)
0.9
0.6
3.5
1.6
In Range (3.9-7.8) (%)
75.3
74.7
71.9
78.9
High (>= 7.8) (%)
23.8
24.7
24.6
19.5
Standard deviation (SD)
1.3
1.7
1.7
1.5
Average (mmol/l)
6.8
7.0
6.7
6.5
A1c estimation (%)
5.9
6.0
5.8
5.7
Table stating the weekly diabetic metrics I am tracking.
Ideally I want to see a time-in-range (TIR – 3.9-7.8 mmol/l) exceeding 90% with an average in the low sixes and a standard deviation (SD) around one (1).
I am starting to feel like a routine is forming, perhaps not around diet yet, but definitely in regards to training. In previous years of doing this I was eating clean most days, as it provided improved diabetic control in the absence of an APS/AID and pump.
This week was particularly heavy due to my birthday dinner, a new phone, a new version of AAPS (Boost test platform 3.6.5) and a 25 km cycle. *I have been unable to pair my galaxy watch with my new phone, which is sad as I really liked the watch and having the plethora of sensors.
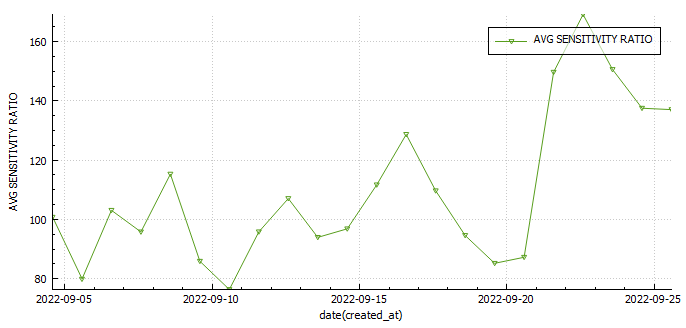
I was investigating the possibility of measuring insulin sensitivity changes in AAPS . One way would be to use the autosens feature in AAPS , but since I wasn’t including the carbs I ate to fix hypos, and I was snacking in-between to keep my readings steady that wasn’t going to work. The only metric that may prove useful may be my carb sensitivity factor (CSF). The average CSF over the 22 days so far is 8.7 while the average sensitivity ratio was 106%. This would mean that according to CSF I was 36% more sensitive to carbs yesterday or 29% less sensitive according to autosens.
Body Metrics
Start
Week 1
Week 2
Week 3
Week 4
Weight (kilograms)
75.8
74
75
74.1
Body fat percentage (according to Samsung)
17.3%
17.8
*
Body fat percentage (according to the navy seal calculator)
15%
15%
14.8%
Total volume
Table stating the weekly body metrics I am tracking.
Exercise
Week 1
Week 2
Week 3
Week 4
Distance (kilometres)
25.17
20.54
37.22
Activity (hours)
4.34
3.65
5.64
Table stating the weekly exercise metrics I am tracking
Nutrition
Screenshot of average macro-nutrients consumed during week 3
Screenshot of average macro-nutrients consumed during week 3
Diabetes
Week 1
Week 2
Week 3
Week 4
Low (<3.9) (%)
0.9
0.6
3.5
In Range (3.9-7.8) (%)
75.3
74.7
71.9
High (>= 7.8) (%)
23.8
24.7
24.6
Standard deviation (SD)
1.3
1.7
1.7
Average (mmol/l)
6.8
7.0
6.7
A1c estimation (%)
5.9
6.0
5.8
Table stating the weekly diabetic metrics I am tracking.
Ideally I want to see a time-in-range (TIR – 3.9-7.8 mmol/l) exceeding 90% with an average in the low sixes and a standard deviation (SD) around one (1).
The second week I have gained a little weight (surprise its not muscle) and had a reduction in exercise hours, which was mostly due to a very long ride I had the previous week.
My diabetic metrics have declined and I feel like all of this mostly due to my diet which needs tweaking.
Body Metrics
Start
Week 1
Week 2
Week 3
Week 4
Weight (kilograms)
75.8
74
75
Body fat percentage (according to Samsung)
17.3%
17.8
Body fat percentage (according to the navy seal calculator)
15%
15%
Total volume
Table stating the weekly body metrics I am tracking.
Exercise
Week 1
Week 2
Week 3
Week 4
Distance (kilometres)
25.17
20.54
Activity (hours)
4.34
3.65
Table stating the weekly exercise metrics I am tracking
Nutrition
Screenshot of average macronutrient consumed during week 2
Screenshot of average macronutrient consumed during week 2
Diabetes
Week 1
Week 2
Week 3
Week 4
Low (<3.9)
0.9%
0.6%
In Range (3.9-7.8)
75.3%
74.7%
High (>= 7.8)
23.8%
24.7%
Standard deviation (SD)
1.3
1.7
Average
6.8
7.0
A1c estimation
5.9%
6.0%
Table stating the weekly diabetic metrics I am tracking.
Ideally I want to see a time-in-range (TIR – 3.9-7.8 mmol/l) exceeding 90% with an average in the low sixes and a standard deviation (SD) around one (1).