Two years ago my daughter was born. At this time I was off work for a few weeks and I had been strongly considering writing a tool that could provide some insight into managing my blood sugars, as I knew controlling my blood sugar was the best chance I had of being the best parent I cold be. At the time I was on multiple daily injections (MDI), leveraging heavily on Dr Bernstein’s teachings and using daily (if possible) exercise as a tools for glucose control.
Two years later the tool has pivoted many times, and at one time I was using machine learning (ML) to predict blood glucose during exercise, until I started using the Dexcom G6 continues glucose monitor (CGM) which was accurate enough to circumvented the need for the aforementioned tool.
At present I am using an automated insulin delivery (AID) device to deliver most of my insulin based on my shifting needs. This significantly reduces the mental burden required for good glycaemic control, as well as reduce some of the anxiety I was experiencing at meals times and when going to the doctor for diabetic checks. This system still requires manual input prior to exercise and constant tuning if you want to have the best experience, and so my tool has pivoted towards analysing this data and providing insight there.
Diabetic Metrics
An analysis of the last 4 years of my diabetic journey highlights a better A1C with a lower standard deviation (SD) indicating more consistency in blood sugars. Its interesting to note the much improved time-in-range (TIR-IN) metrics once I moved over to a insulin pump using an automated insulin delivery (AID) device.
| Period | Hypo (below 3.9) | In (3.9-10) | High (above 10) | Average | A1C | SD | GVI | PGS | PGR | PGR-Risk | Exercise hours | Kilometres | Pump / MDI |
|---|---|---|---|---|---|---|---|---|---|---|---|---|---|
| 2019 | 19% | 77% | 3% | 7.7 | 6.50% | 2.6 | 1.26 | 40.19 | 2.2 | Low | 16 | 146 | MDI |
| 2020 | 8% | 88% | 3% | 6.9 | 6.00% | 2.1 | 1.19 | 17.34 | 1.6 | very-low | 67 | 658 | MDI |
| 2021 | 3% | 94% | 3% | 6.4 | 5.60% | 1.7 | 1.18 | 8.79 | 1.3 | very-low | 149 | 920 | Pump (Loop) 20/11/2021 |
| 2022 (YTD) | 3% | 96% | 1% | 6.5 | 5.70% | 1.5 | 1.2 | 5.43 | 1.2 | very-low | 75 | 496 | Pump (AAPS) |
For a description of some of these values mean please read this article.
Goals
My goal was to provide some insight into what was working and was not. To do this I needed to obtain blood sugar readings as well as nutritional and exercise data. I achieved this by creating a tool that obtains data from Nightscout, Strava and MyFitnessPal This data is then processed and enriched to provide insight. I then developed a tool to export some of this data and display it on my YouTube videos. I had it connected to Garmin to extract sleep and exercise data but the Garmin API failed and I have not had time to update the program.
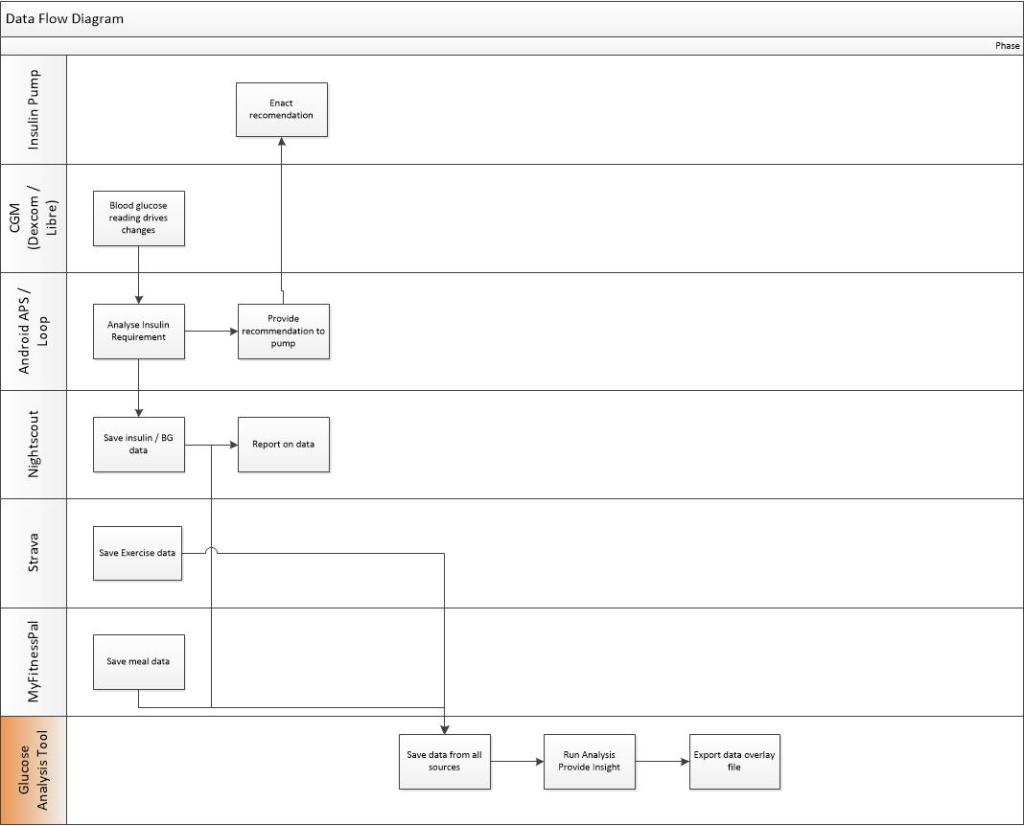
My tool will then do some analysis to provide some insight at a per meal or per activity level by looking at metrics like time-in-range, average glucose, standard deviation, max glucose, min glucose and many more metrics.
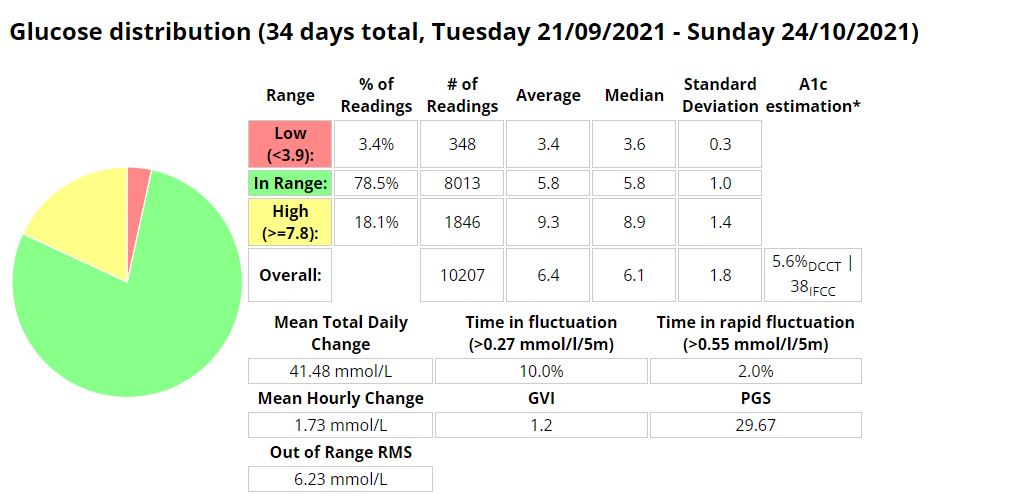
Below are some example’s of some of the data I am exporting and using to make decisions.
This tool is very much still under constant development, as I am always finding new stats to display and bugs with some of my current code (at present both the Garmin API and the MyFitnessPal API have issues)
Below are some graphs and tables that I created in my Tool (The graphs are generated in DB Browser, these will at some stage be created in a JS library or Python graphing library).

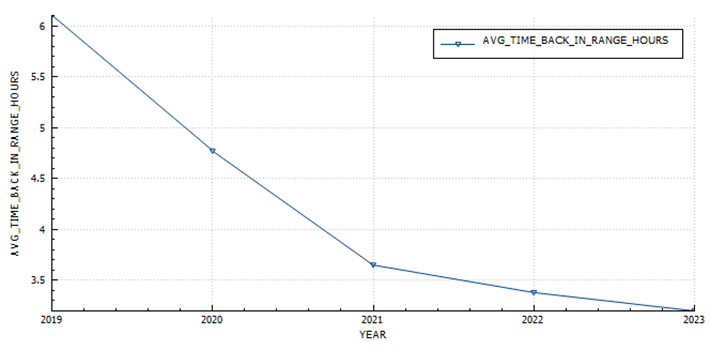
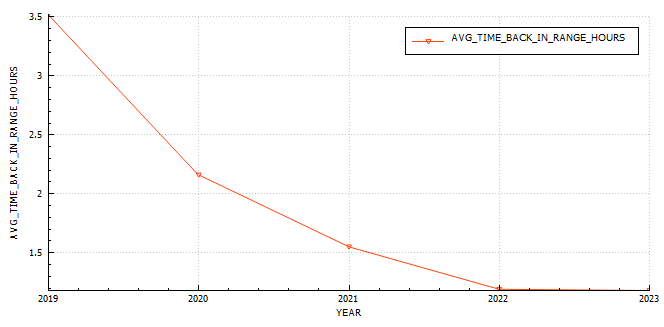
Return-to-Range
I use this table to understand how quickly the system is able to reduce sugars into a normal blood sugar range. At the moment I am using 8 and 6.
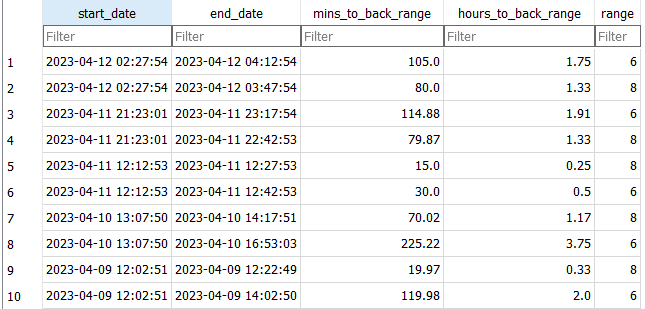
Return-to-range analysis (by year)
In 2019 It took just over 6 hours to return to euglycemia (blood glucose < 6) after a peak, in 2023 I managed to reduce that to 3.2 hours.
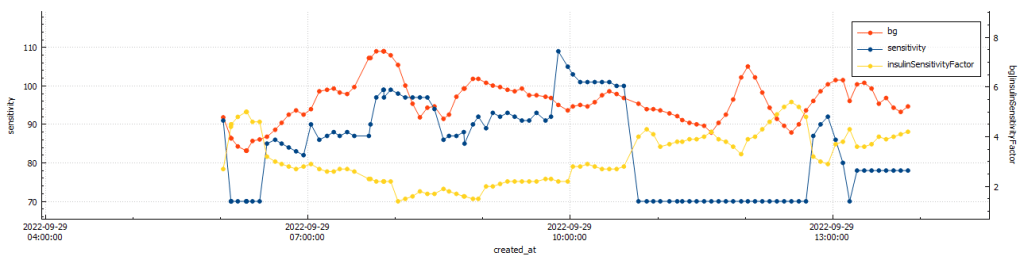
Daily Sensitivity Analysis
I find this useful to determine if I am more sensitive to insulin on certain days, usually due to exercise.

Exercise Sensitivity Analysis
The exercise sensitivity data has been updated to be hourly for 12 hours post exercise. Its now calculated via SQL (insert statement) and not a Python function into a staging table.

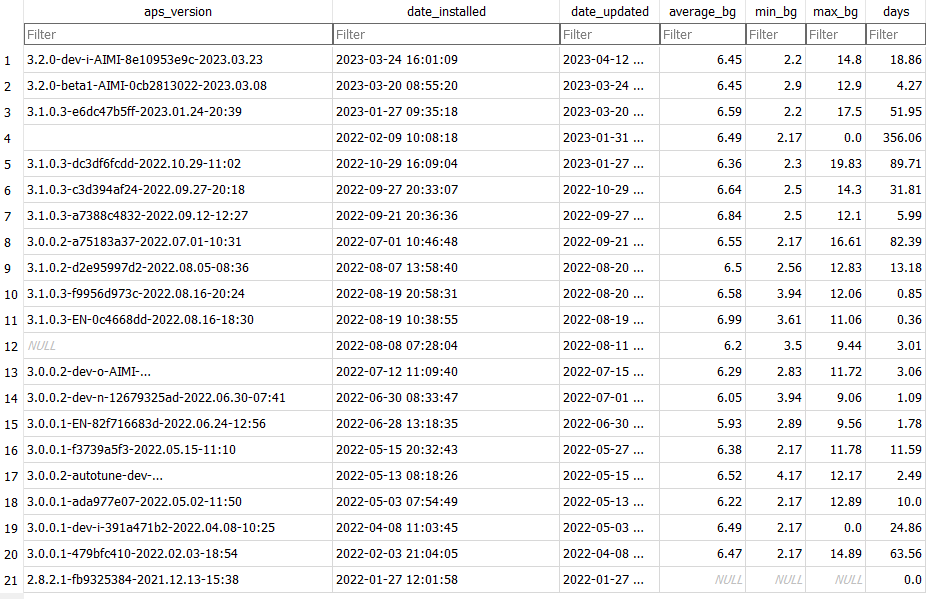
APS Version Analysis
APS Version Battery Analysis

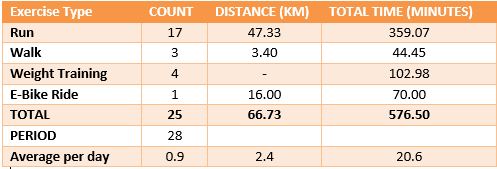
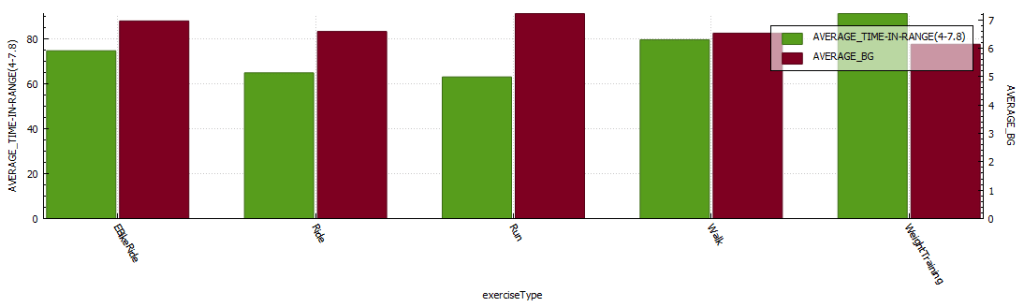
Exercise Stats Analysis (per exercise)

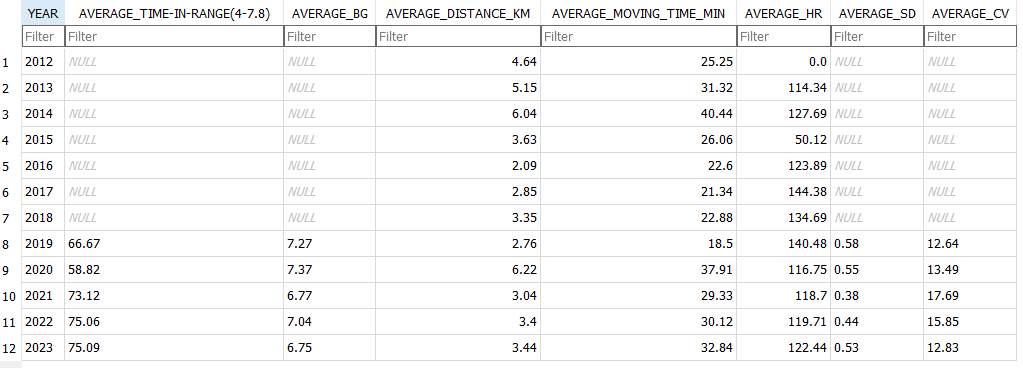
Exercise Stats Analysis (annual)
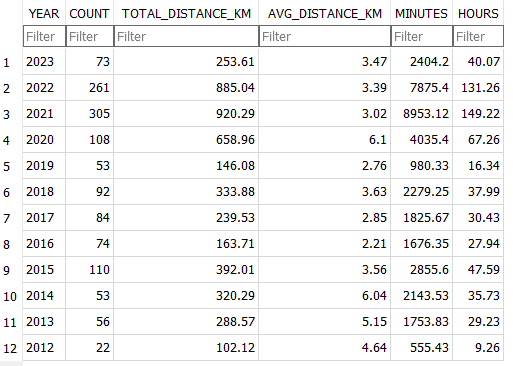

In the hopes of improving time-in-range while exercising I experimented with reducing insulin and used these values to provide insight into wether the changes were successful or not. In 2019 I was in-range only 66.6 of the time, in 2023 I am in-range 75%, with a slight improvement in glucose while exercising.
Treatments Analysis (per treatment)
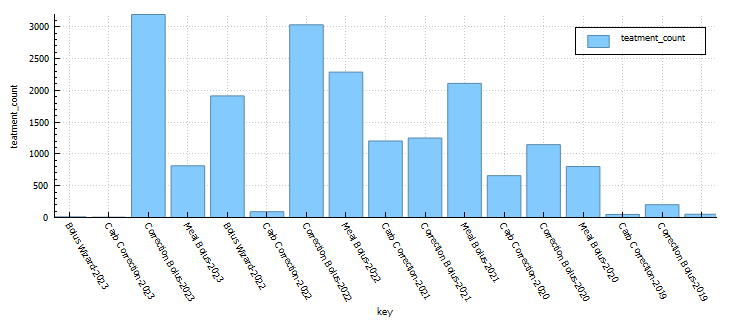
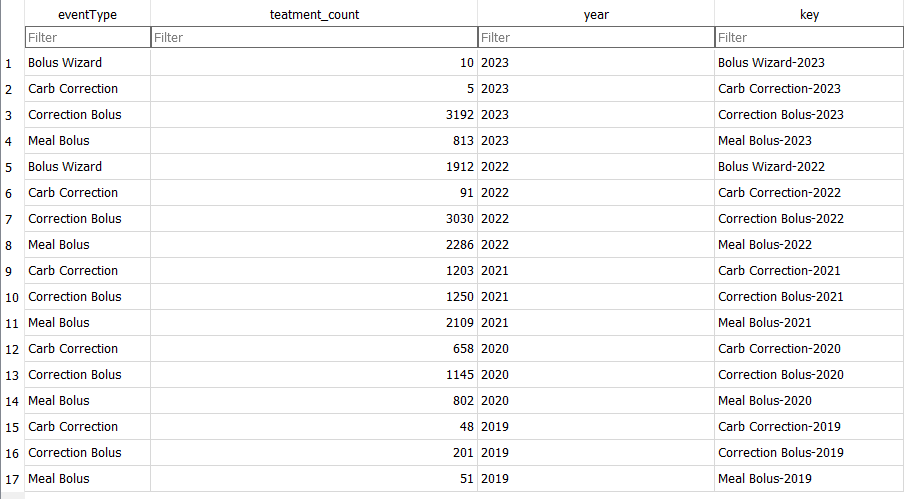
Treatment Type Analysis
I use this table to understand how frequently I am interacting with the loop. This has little impact on the version of the variant of Android APS I am using.
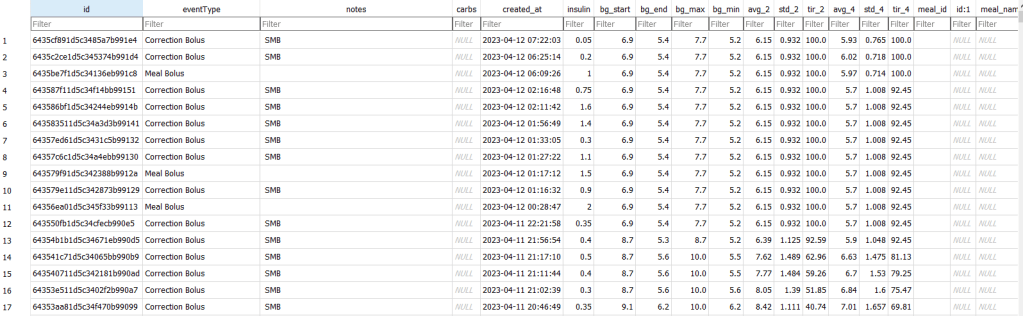
Strava diabetic stats
I wanted to see diabetic statistics for each event in Strava, so I wrote a script to update the description field with some data I calculating in the Python tool. The script will check to see if the description field is populated and only update records that have no data in the description field.

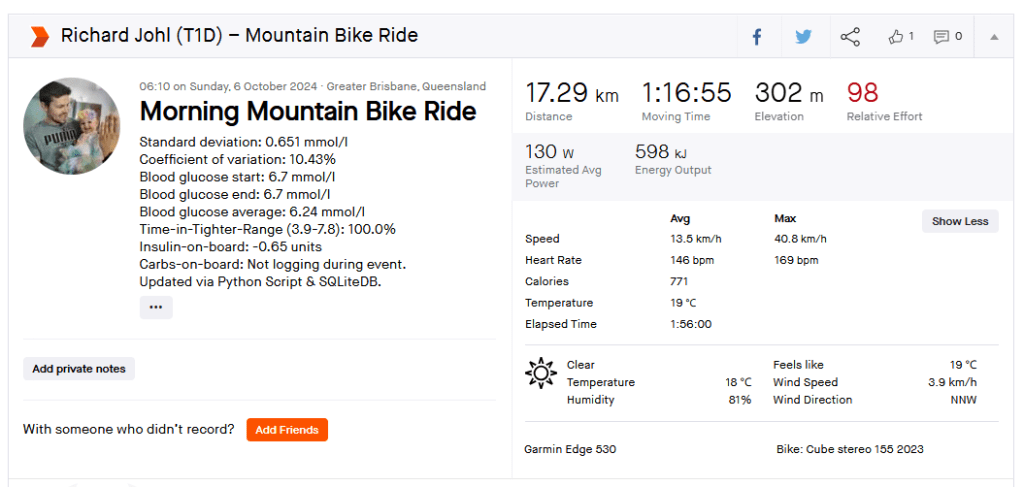
Data to follow:
https://1drv.ms/u/s!AmpIRdFk1_yMgosDqE73Osiyl30ZAg?e=w9sIzl
Improvements
There are a number of improvements I am working on.
- Web Interface