Disclaimer: The information contained within this blog post are my thoughts and do not constitute medical advice. Please consult your medical team before making any changes to your diet or blood sugar management program.
So far 2022 has been quite the year. With the return to my work offices Its been rather difficult to reach many of the goals I set myself, but I did make progress. It seems 2023 is set to be a particular difficult year, but perhaps this will be the inspiration I need to make some positive changes. The Python scripts I wrote to export data from Nightscout to create my mountain bike videos seem to be working well and I can’t wait to make a few more videos.
I was curious to see if there were any differences in insulin sensitivity between longer and shorter activity durations, as well as higher intensity (where average heart rate was more than 80% of max heart rate) training and it seemed there was, it just wasn’t what I was expecting.
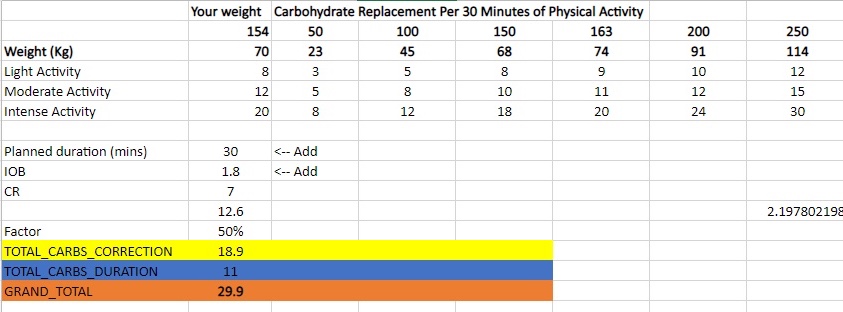
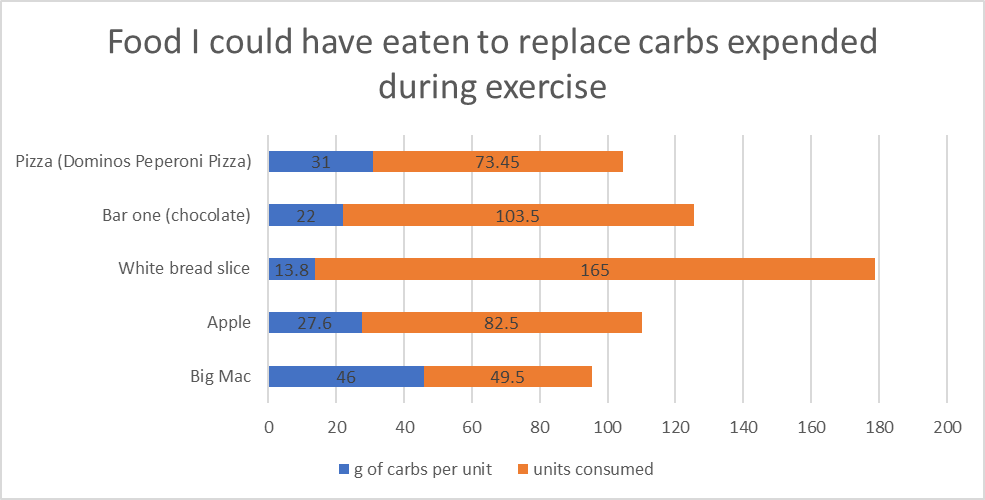
My average total daily dose (TDD) for 2022 was 32.9 units per day. If we analyse my aerobic activity (ride and runs) for the year and we use my sensitivity ratio from AAPS for 24 hours post exercise, I calculate that I saved 256 units of insulin in 2022 through exercise due to increased insulin sensitivity. During aerobic activity I consume 12g of carbs on average per 30 mins of activity unless I am exercising fasted. I can use this input to calculate that I ate 2277g of carbs during 2022. I would need 311 units of insulin to absorb 2277g of carbs. Since I don’t add carbs to AAPS while exercising I don’t have the exact numbers but I do believe this calculation to be pretty accurate. That equates to 49 Big Mac burgers / 82 Apples / 73 slices of Dominos peperoni pizza that I got to eat without insulin as a direct result of exercise.
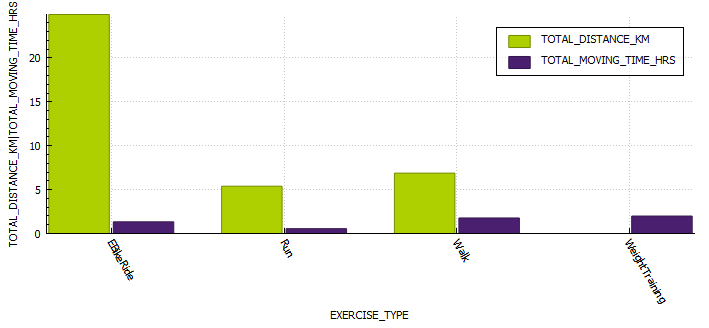
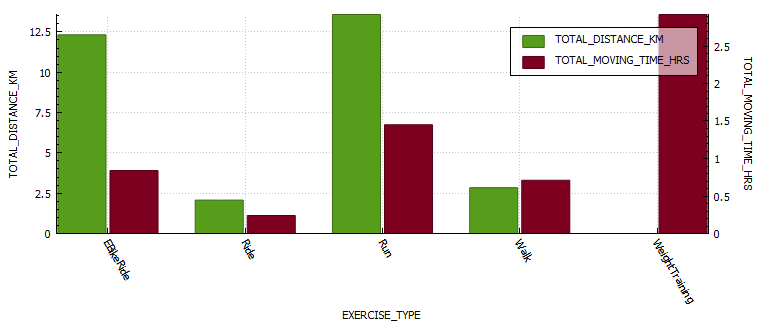
Exercise metrics
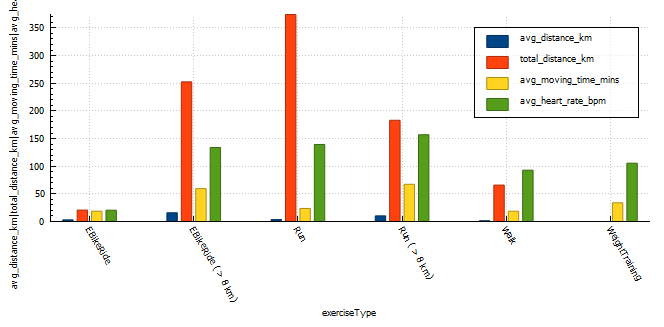
Analysing my exercise metrics I found that I was spending way too much time exercising at more than 75% of heart rate max, this would be hampering performance and building endurance. I did eighteen (18) runs at a distance greater than 8km, an improvement over the two (2) I did in 2021. I also managed my longest run ever at 16km.
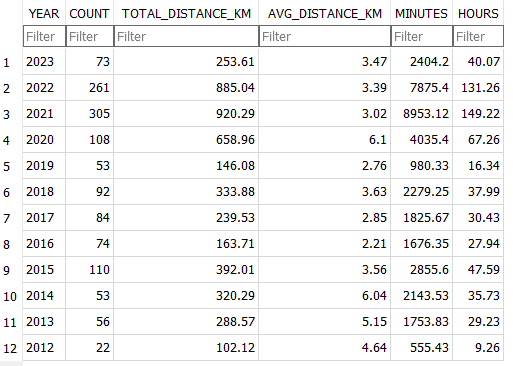
| exercise type | exercise count | total distance (km) | average distance (km) | average moving time (minutes) | average heart rate (bpm) |
|---|---|---|---|---|---|
| EBikeRide | 7 | 20.64 | 2.95 | 18.65 | N/A |
| EBikeRide ( > 8 km) | 17 | 252.4 | 15.7 | 59.4 | 133.8 (72% max HR) |
| Run | 108 | 374.25 | 3.47 | 23.5 | 139.26 (75% max HR) |
| Run ( > 8 km) | 18 | 183.1 | 10.1 | 67 | 156 (85% max HR) |
| Walk | 48 | 65.8 | 1.37 | 18.6 | 93 (50% max HR) |
| WeightTraining | 65 | 0.0 | 0 | 33.77 | 105 (57% max HR) |
| TOTAL | 262 | 896 | 5.6 | 36 | 125 (68% max HR) |
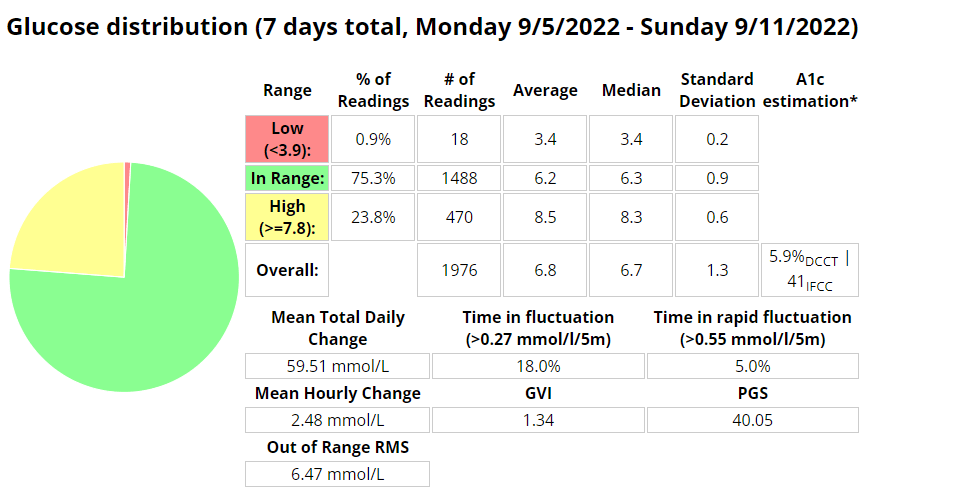
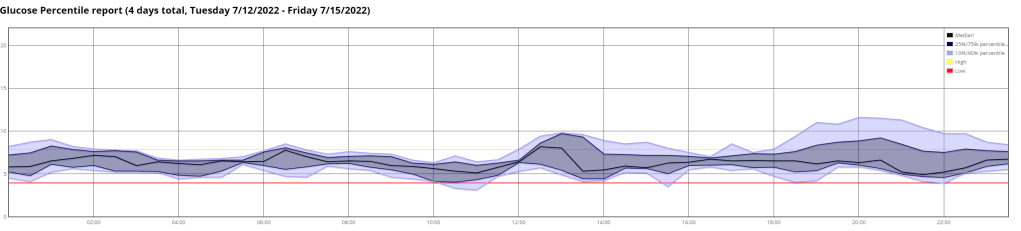
Time-in-range (TIR)
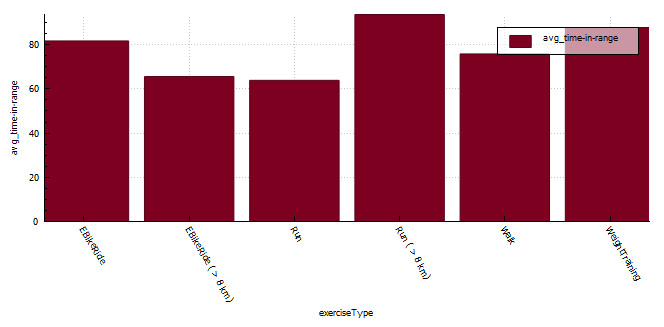
The longer distance running seem to result in the best time-in-range (TIR) (3.9-7.8 mmol/l) but I do feel that these runs also seem to happen at a similar time in the morning where I have more control over insulin-on-board (IOB) and carbs-on-board (COB) and I am the most resistant to insulin. My heart rate is also far more consistent (aerobic) during running than when mountain biking ( aerobic / anaerobic ).
If I start digging into the data for short runs more closely I find that;
- TIR (3.9-7.8 mmol/l) from 04:00am – 10:00am is 63%
- TIR (3.9-7.8 mmol/l) from 10:00am – 13:00pm is 83%
- TIR (3.9-7.8 mmol/l) after 13:00pm is only 23%
| exercise type | exercise count | time-in-range (%) |
|---|---|---|
| EBikeRide | 7 | 81.67 |
| EBikeRide ( > 8 km) | 16 | 65.56 |
| Run | 108 | 56.8 |
| Run (04:00 – 10:00 am) | 18 | 63.8 |
| Run (10:00 – 13:00 pm) | 61 | 83.6 |
| Run (13:00 – 10:00pm) | 29 | 23.02 |
| Run ( > 8 km) | 18 | 93.6 |
| Walk | 45 | 75.8 |
| WeightTraining | 65 | 87.7 |
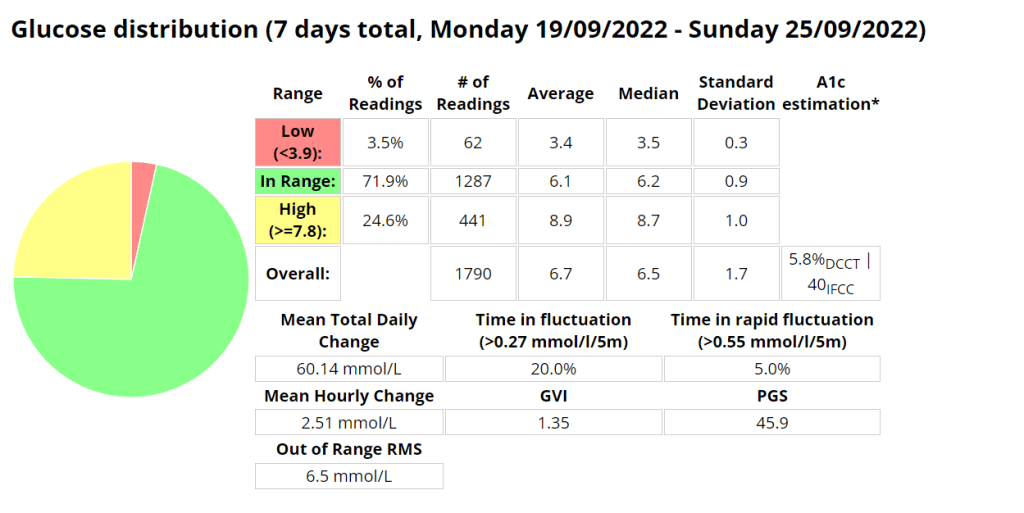
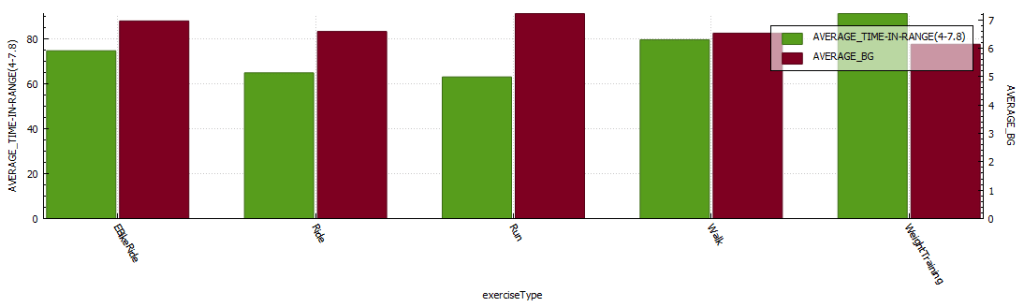
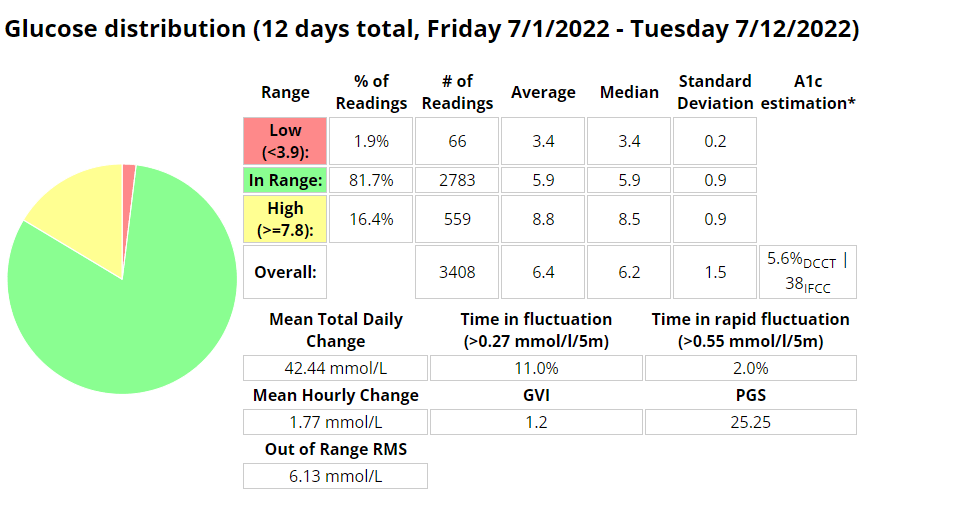
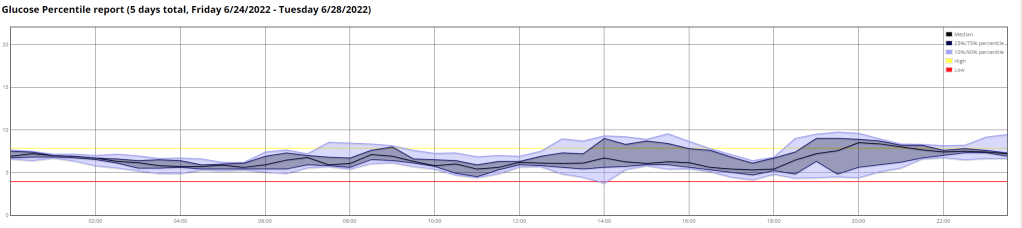
Blood glucose control metrics
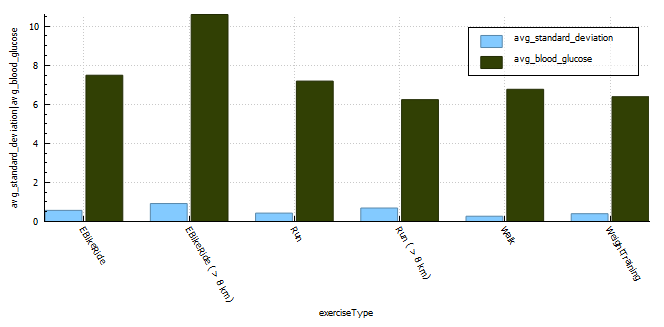
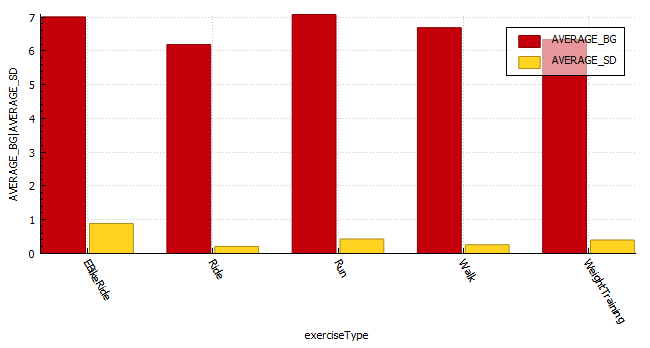
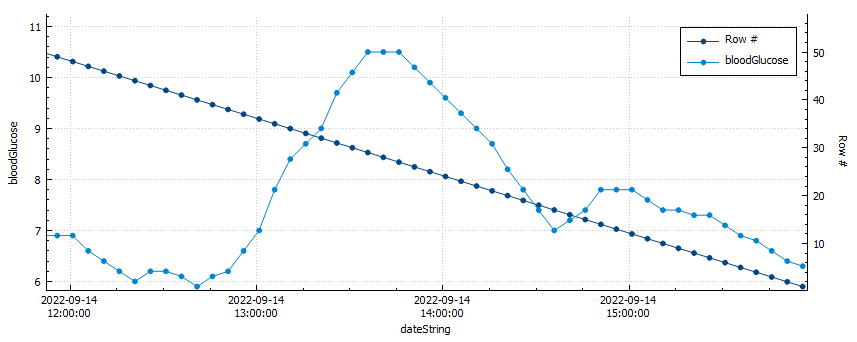
The exercise that resulted in the lowest blood glucose fluctuations is walking with a CV of 4%. The exercise with the second lowest CS was weight training. I generally try to train with a little insulin-on-board to counteract the hormones released during training and I don’t need to set a high temp target in the lead-up to the activity, thus my reading is much lower at exercise commencement. The third lowest is short runs (< 8km) with CV of 6%. The higher blood glucose average will be a direct result of me setting a higher temp target (8 mmol/l) prior to exercising, but the duration of activity isn’t long enough to reduce the blood glucose substantially resulting in the high average. Long runs seem to result in the least stable blood glucose values with a CV of 12% but the average for long runs is lower as the sustained activity reduces blood glucose. I suppose on these longer runs I do consume a minimum of 30g of ultra-fast acting carbs (glucose, dextrose) which is going to result in some fluctuations in blood glucose.
With coefficient of the variation (CV) a lower percentage is indicative of more stable blood glucose readings.
| exercise type | exercise count | average standard deviation | average blood glucose | average coefficient of the variation (CV) |
|---|---|---|---|---|
| EBikeRide | 7 | 0.57 | 7.49 | 8% |
| EBikeRide ( > 8 km) | 16 | 0.92 | 10.6 | 9% |
| Run | 108 | 0.43 | 7.19 | 6% |
| Run ( > 8 km) | 18 | 0.69 | 6.24 | 11% |
| Walk | 48 | 0.27 | 6.77 | 4% |
| WeightTraining | 65 | 0.4 | 6.39 | 6% |
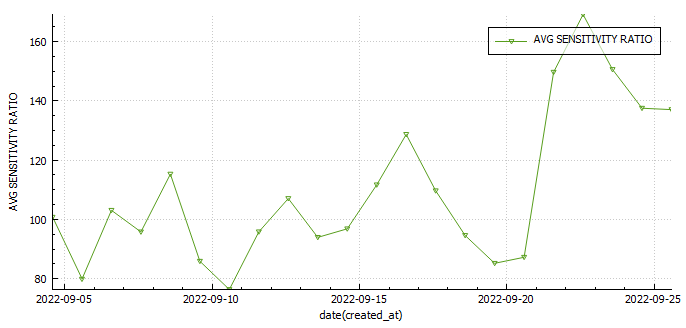
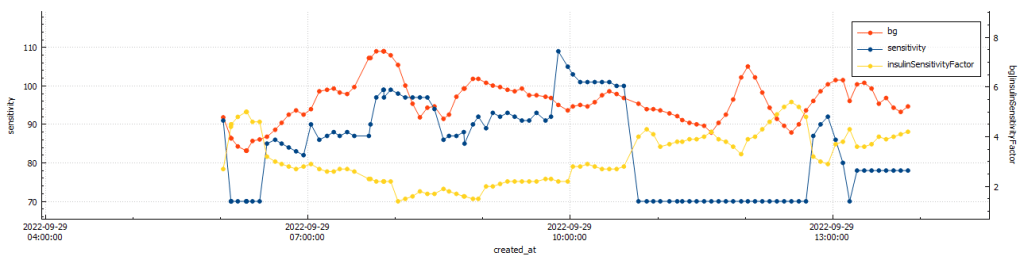
Insulin sensitivity
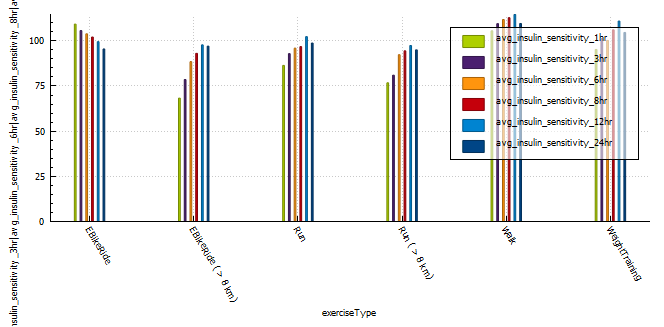
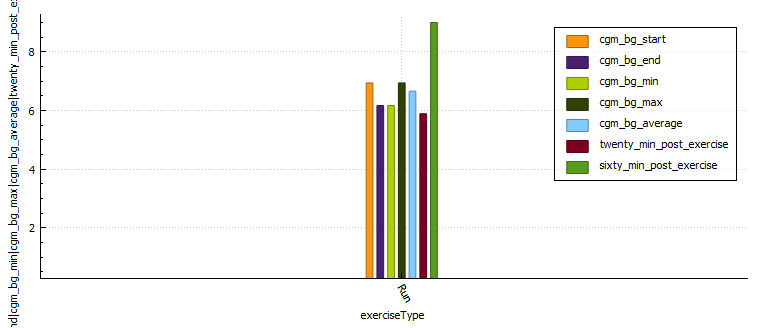
A very interesting observation was that longer, more intense activity resulted in sensitivity returning to normal quicker than less intense or shorter activity. Runs shorter than 8km resulted in a massive 12% insulin reduction for 24 hours post activity, that’s around 6.5 units less insulin in a 24 hour period. Long E-Bike rides resulted in the largest increase (35%) in sensitivity 1 hour post activity, with shorter E-Bike rides the second largest increase in sensitivity. Runs longer than 8 km increased sensitivity (25%) the third most, but the body seemed to return to normal more quickly than the shorter runs and was almost back to normal within 12 hours of activity.
(NOTE: I can’t comment on the validity of the results, only that patterns exist after exercise that are not usually observed in the absence of aforementioned exercise.)
| average insulin sensitivity | |||||||
| exercise type | exercise count | 1 hr post exercise | 3 hr post exercise | 6 hr post exercise | 8 hr post exercise | 12 hr post exercise | 24 hr post exercise |
| EBikeRide | 7 | 109 | 105 | 103 | 102 | 99 | 95 |
| EBikeRide ( > 8 km) | 16 | 68 | 78 | 88 | 93 | 97 | 79 |
| Run | 108 | 86 | 92 | 95 | 96 | 102 | 98 |
| Run ( > 8 km) | 18 | 76 | 80 | 92 | 94 | 97 | 94 |
| Walk | 48 | 105 | 109 | 111 | 112 | 114 | 109 |
| WeightTraining | 65 | 95 | 101 | 100 | 106 | 110 | 104 |
Profile Adjustments vs. Temporary Targets (TT)
In the past I used a combination of a 30% reduction in profile and a temporary target of 7 mmol/l while exercising.
This seemed to work quite well, with the caveat that profile adjustments can result in your autosens data being reset if you cancel the adjustment earlier than set.
One way to combat this is to set a higher temp target, this will not effect sensitivity data and can be cancelled at any time without needing to update the basal insulin profile in the pump of effecting autosense data. In order to do this I analysed the adjustments I was using to calculate a temp target that should reduce my insulin enough to keep me in range for the duration of activity.
| Target | Temp_Target | Insulin % reduced | Actual % of profile | 30% Reduction | 20% Reduction | Note |
| 5.3 | 8 | 51% | 49% | This resulted in quite a few low blood sugars | ||
| 5.3 | 8.5 | 60% | 40% | 2023 backup temp target strategy | ||
| 5.3 | 8.3 | 57% | 43% | 2023 temp target strategy. | ||
| 5.3 | 7.5 | 42% | 58% | 28.5% | 38.5% | |
| 5.5 | 7.0 | 27% | 73% | 42.7% | 52.7% | Strategy in early in 2022 |
Thank you for reading 🙂