Race Day
Introduction:
The Dawn Effect and Blood Glucose: When we wake up in the morning, our body experiences a surge of hormones, commonly referred to as the “dawn effect” or “dawn phenomenon.” This natural hormonal response can lead to an increase in blood glucose levels even before we consume any food or engage in physical activity. Cortisol, growth hormone, and other hormones play a role in this phenomenon. For individuals with diabetes, the dawn effect can pose challenges in maintaining stable blood glucose levels, especially during a race. The hormonal surge may contribute to higher blood sugar levels, making it crucial to adjust your diabetes management routine accordingly.

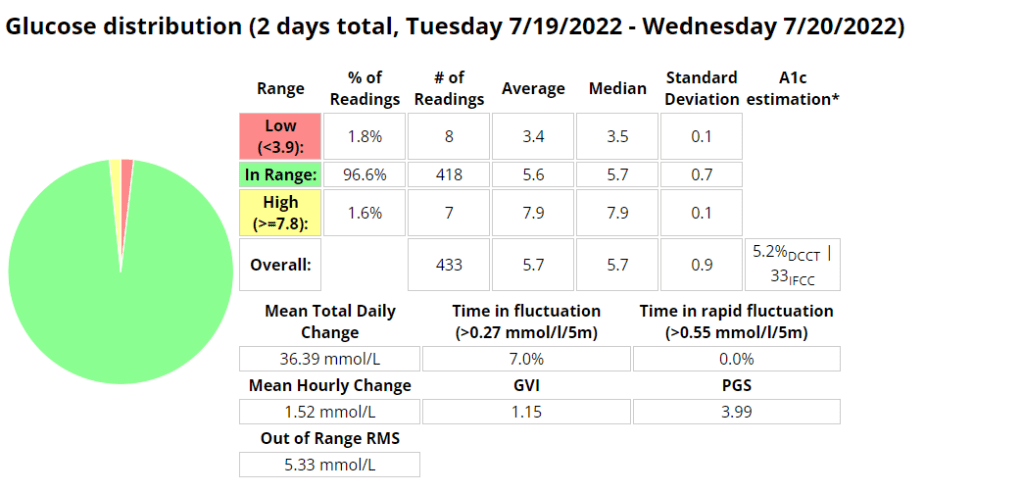
| Training vs. Race | Average distance (km) | Average time (min) | Average HR (bpm) | TIR (3.9 – 7.8) | Average Blood Glucose (mmol/l) | Coefficient of variation (%) | Pace |
|---|---|---|---|---|---|---|---|
| Training | 14 | 92 | 156 | 92% | 5.8 | 14 | 6:40 |
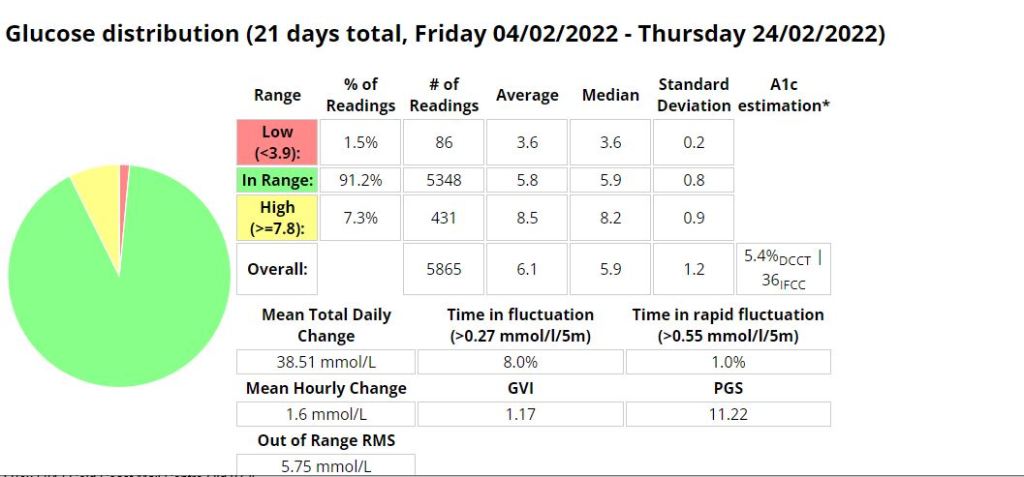
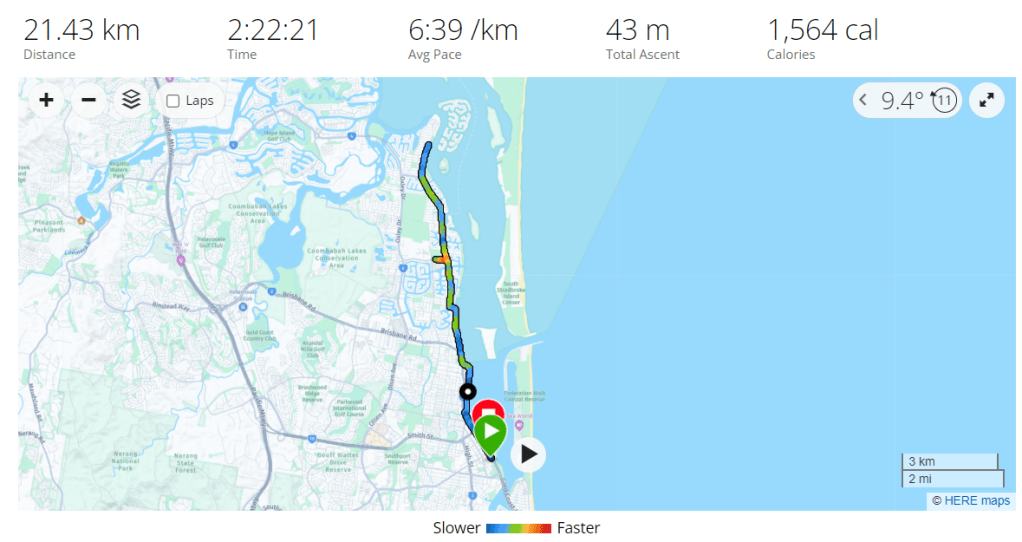
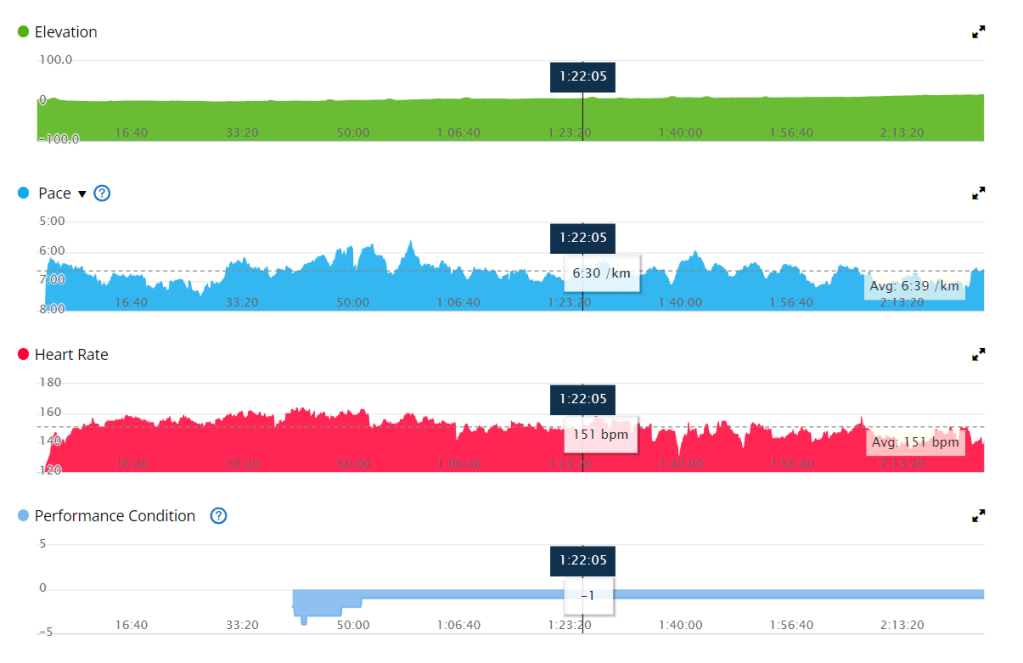
| Race | 21.4 | 140 | 151 | 21.4% | 9.9 | 22.54 | 6:39 |
Blood Glucose Management: Pre-Race Strategies: To optimize your blood glucose levels during a race, careful planning and preparation are key.
Here are some strategies to consider:
-
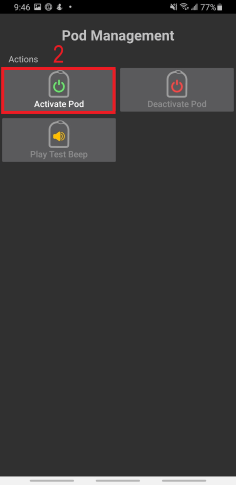
Race Day Automation: If you use an insulin pump or automated insulin delivery system, consider setting up a race day automation plan. Gradually reducing your insulin on board (IOB) and raising your blood sugar target before the race can help mitigate the impact of the dawn effect.

- Timing of Pre-Exercise Snacks: To align the digestion of carbohydrates with the energy demands of the race, it is important to time your pre-race snack appropriately. If your blood glucose is around 5 mmol/l before starting, consuming a carbohydrate-rich snack approximately 15 minutes before the race can help maintain stable blood glucose levels, in my experience cliff bars have the perfect amount of nutrients for a long run.
- Managing Blood Glucose During the Race: Once the race begins, various factors can influence your blood glucose levels.
- Here are some considerations to keep in mind:
Listen to Your Body: Pay attention to any signs or symptoms that may indicate fluctuations in your blood glucose levels during the race. Feeling lightheaded, fatigued, or experiencing unusual thirst may indicate the need for carbohydrates. Regular Blood Glucose Monitoring: Carry a portable blood glucose meter to monitor your levels throughout the race. This will enable you to make timely adjustments and take appropriate remedial actions when necessary. Carbohydrate Consumption: Plan to consume carbohydrates during the race to maintain your blood glucose within a desirable range. Experiment with different forms of carbohydrates, such as gels, sports drinks, or energy bars, to find what works best for you. Remember to consider the impact of any exercise-induced insulin sensitivity and adjust your carbohydrate intake accordingly.

Post-Race Recovery: Upon crossing the finish line, it’s essential to prioritize your recovery and address any pain or discomfort that may have emerged during the race. Be mindful of the following:
-
Musculoskeletal Discomfort: Races can place significant stress on your body. Pay attention to any pain or discomfort in your muscles, joints, or tendons. Consult with a healthcare professional if necessary to address any post-race injuries. Blood Glucose Check: After the race, continue monitoring your blood glucose levels as they may fluctuate due to post-exercise hormonal responses. Adjust your post-race nutrition and insulin dosages accordingly.
Conclusion: Participating in a race as a person with diabetes requires careful consideration of blood glucose management strategies. Understanding the impact of waking up on hormonal levels, adjusting your approach accordingly, and incorporating remedial actions during the race are crucial steps towards maintaining stable blood glucose levels. By staying vigilant, prepared, and responsive to your body’s needs, you can conquer the challenges of a race while managing your diabetes effectively.
References:
- American Diabetes Association. (2021). Diabetes and Exercise. Retrieved from https://www.diabetes.org/healthy-living/fitness/exercise-and-type-1-diabetesGupta, L., Khandelwal, D., Singla, R., Gupta, P., Kalra, S., & Dutta, D. (2017). Dawn Phenomenon and Its Impact on Blood Glucose Control. Indian Journal of Endocrinology and Metabolism, 21(6), 901–909. doi: 10.4103/ijem.IJEM_284_17
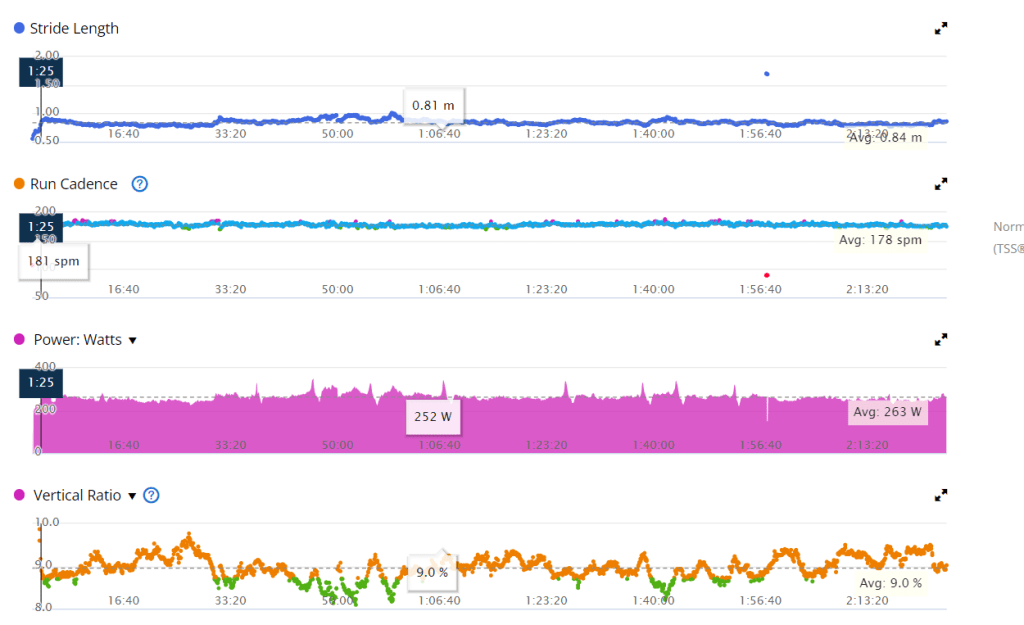
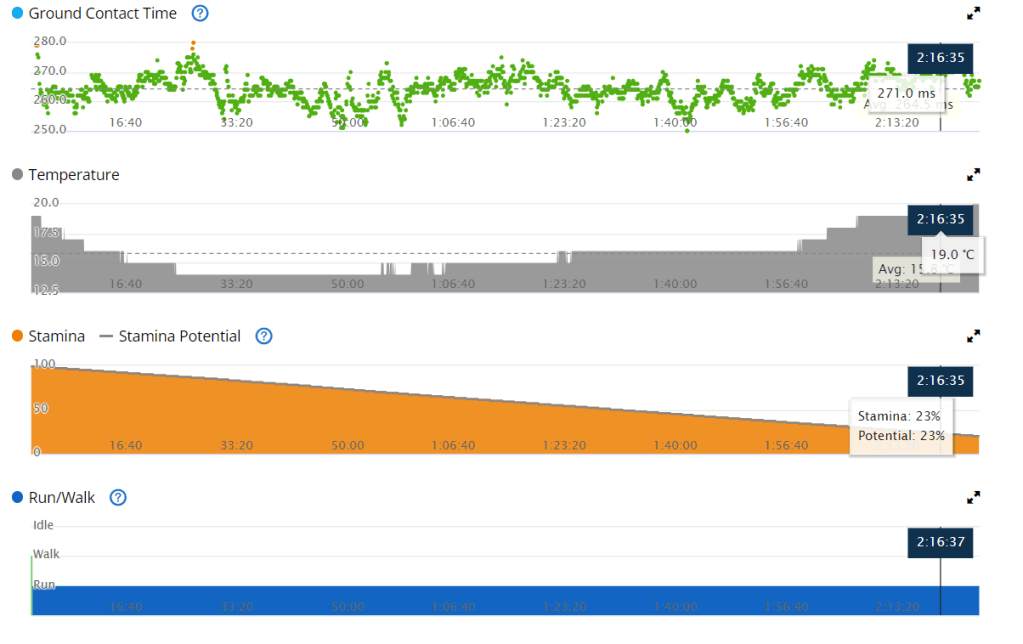
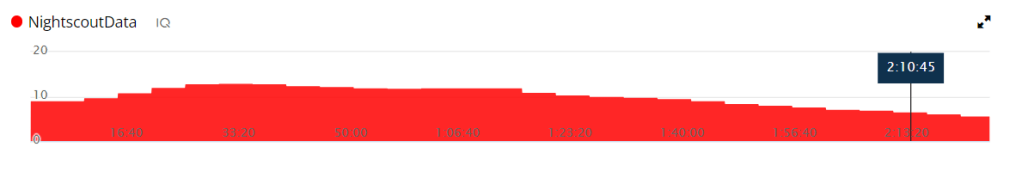
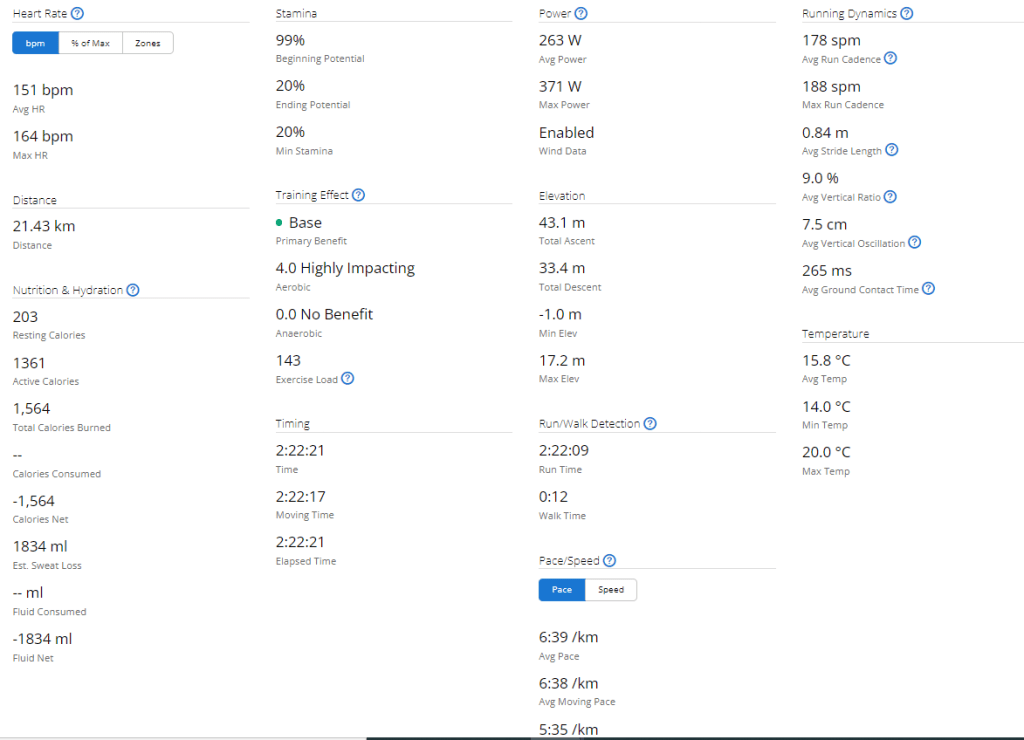
Exercise stats from Garmin

Equipment
| Equipment Name | Note |
| Osprey duro 6 – Hydration pack | This hydration pack is a great option for long runs or cycles. It holds 1.5 liters of water, which is more than enough for most people to drink on a 2+ hour activity. It also has multiple pockets at the front of the vest, which allow you to store food, your phone, and your blood glucose meter. This makes it easy to access your essential items while you’re running or cycling. |
| Glucose gels | My general rule of thumb is bring at least twice the amount you expect you will need. |
| Cliff bar | The cliff bar was a new addition to my nutrition. These bars seemed to work well to stabilise blood glucose and I required no additional carbs for most runs between 14-18km. |
| Blood glucose meter + extra strips | If my sensor were to fail or I was to become dehydrated enough that my CGM reading was inaccurate I wanted to be able to assess my blood glucose. |
| Dexcom | Continuous glucose monitor. I ensured this had at least 24 hours to settle before the race. This way readings would more accurate. |
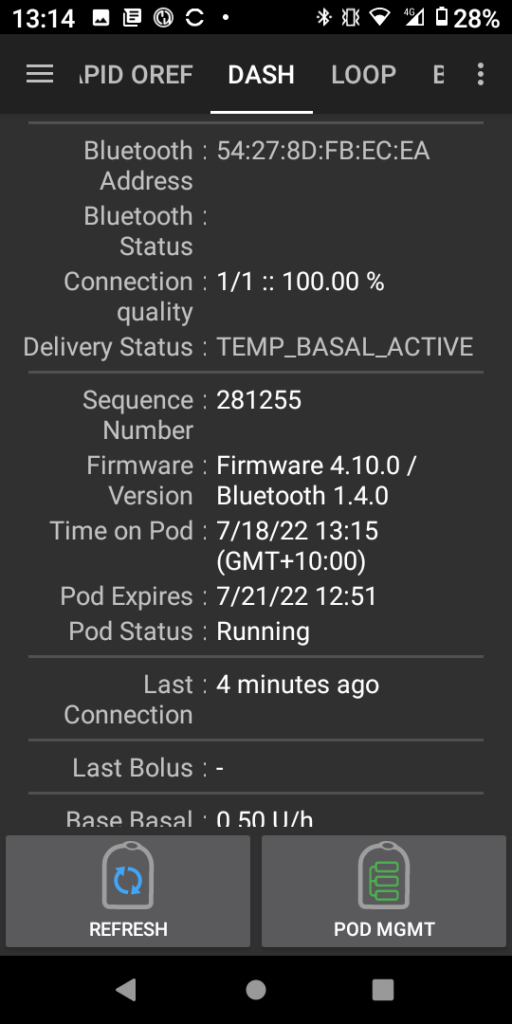
| Android APS phone | The phone that contain my artificial pancreas system. |
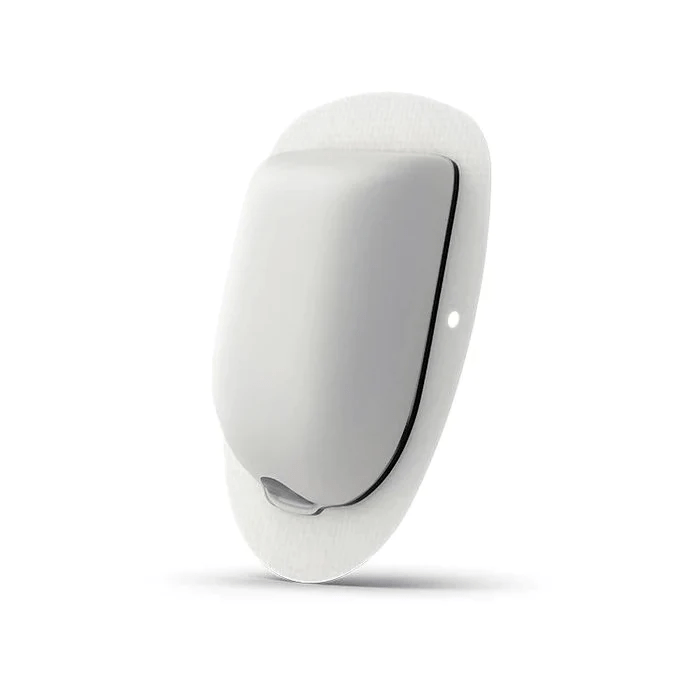
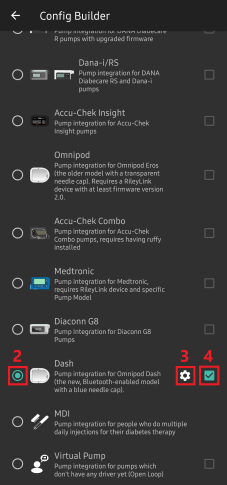
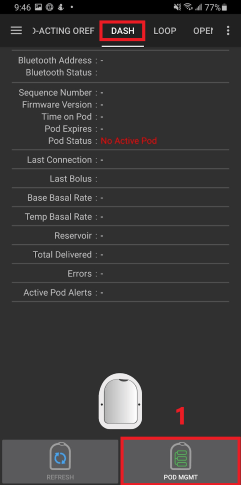
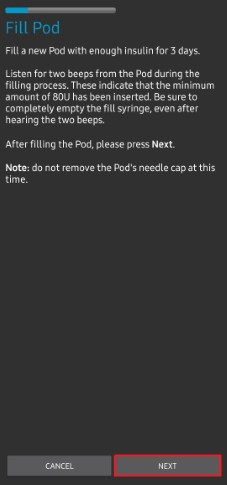
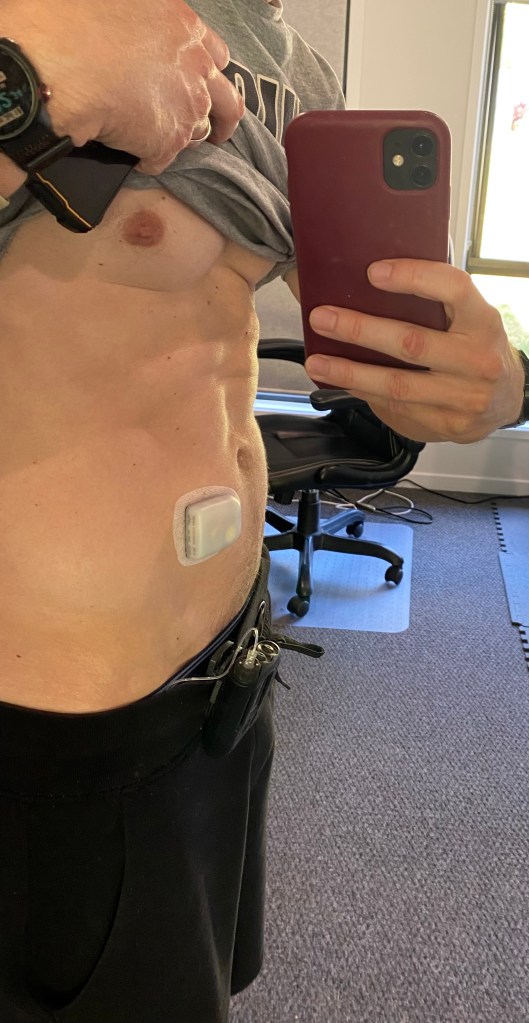
| Onmipod Dash | Bluetooth enabled insulin pump, allowing me to use Android APS. I ensured that I inserted the pod at least a day before the race so I had enough time to identify issues. |
| Brooks Ghost shoes | A comfortable pair of shoes you have tested and run in prior to the race. I still developed blisters so its imperative you get the correct size. |
| Asics running socks | A comfortable pair of socks. |
| Hat | A hat to ensure I don’t burn. |
| earbuds | To enjoy some music while I run. |
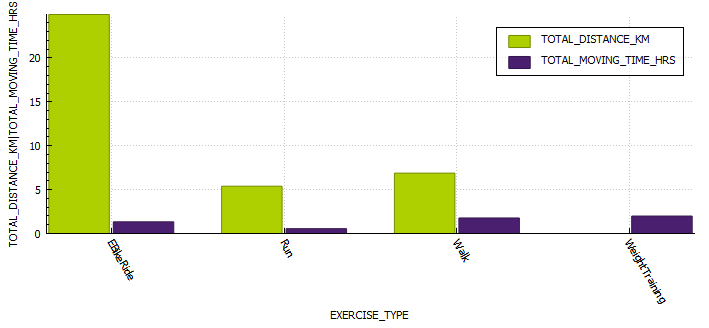
Training
To prepare for the Gold Coast Marathon I did the following exercise;
| Exerciser Type | Count | Distance | Hour | Average heart rate | coefficient of variation (%) | Average blood glucose | Average time in range |
|---|---|---|---|---|---|---|---|
| Run | 41 | 276 | 30 | 150 bpm | 2.6 z | 9.68 | 6.6 | 80% |
| WeightTraining | 10 | 5 | 109 bpm | 6.2 | 6 | 84% | |
| EBikeRide | 8 | 142 | 8 | 134 bpm | 15 | 6.8 | 73% |