08 July 2024
The half marathon has passed. The training this year went well, with no running related injuries to speak of at the point of writing, although I did get food poisoning a week before the race and I missed my last long run. I have learned a lot over the course of the year, which has helped get me to this point. The actual race was a totally different experience, it rained for the first few kilometres, I had stomach cramps and I suffered intense muscles spasms, none of which happened in over a thousand kilometres of my training over the course of the last two (2) years.
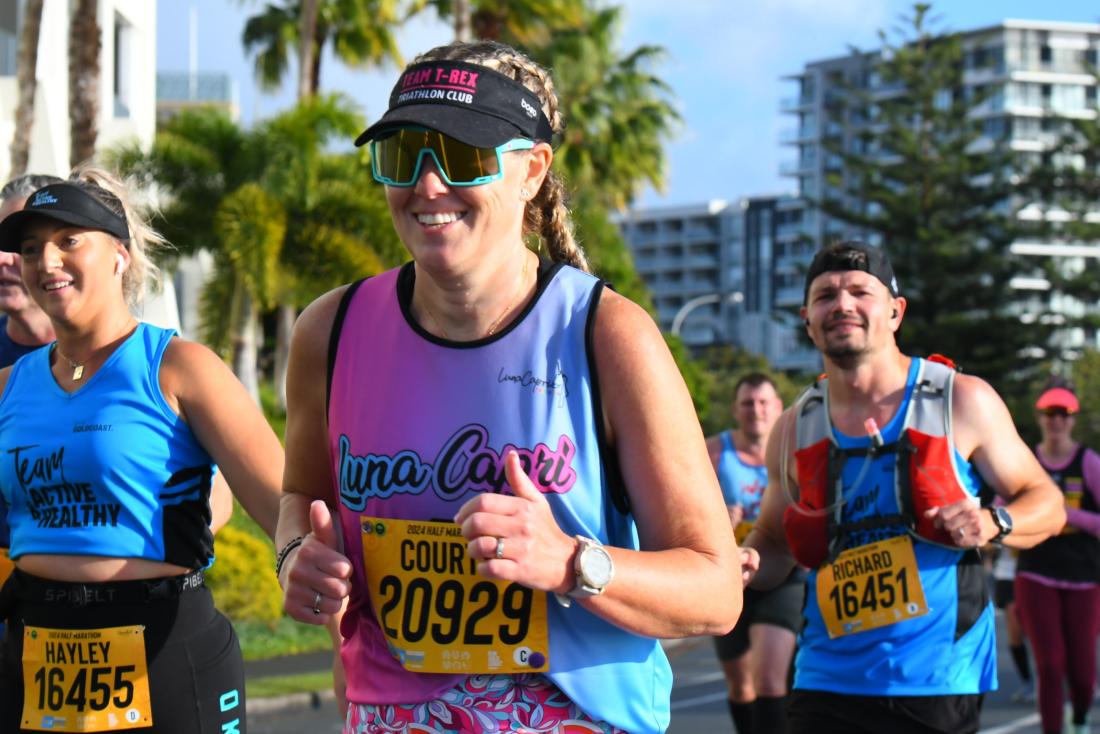
Race Day
Race day 2024 was very different than I expected. I felt confident due to all my training. The rain was an annoyance, but one easily overcome by a running jacket (if I race again I’ll get a opaque poncho).
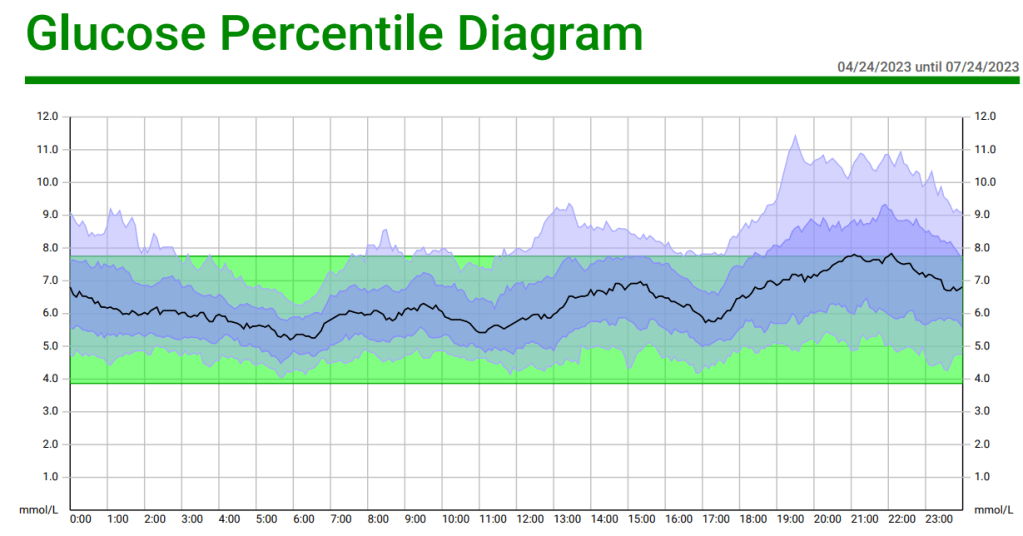
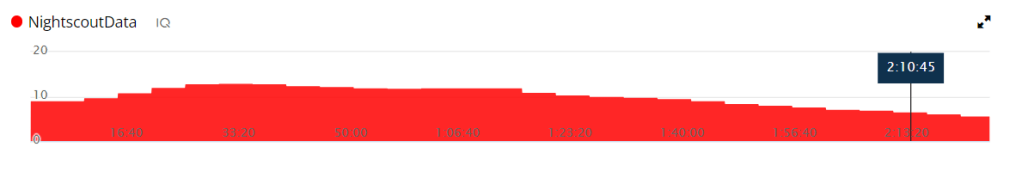
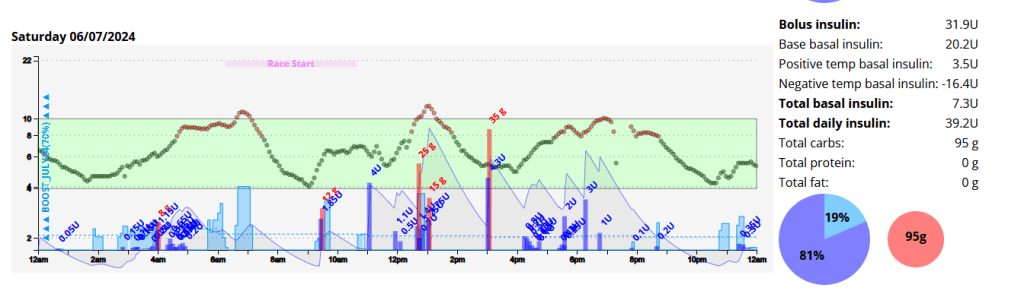
I woke up at 03:50am with little sleep and a blood glucose of 5.8 mmol/l. This crept up steadily, likely due to cortisol and adrenaline. By race start time I was 9.0 mmol/l with 0.9 units of insulin on board (IOB). Due to the IOB I ate about one third of a Cliff Bar (18g of carbohydrates) which in hind-sight was a mistake.
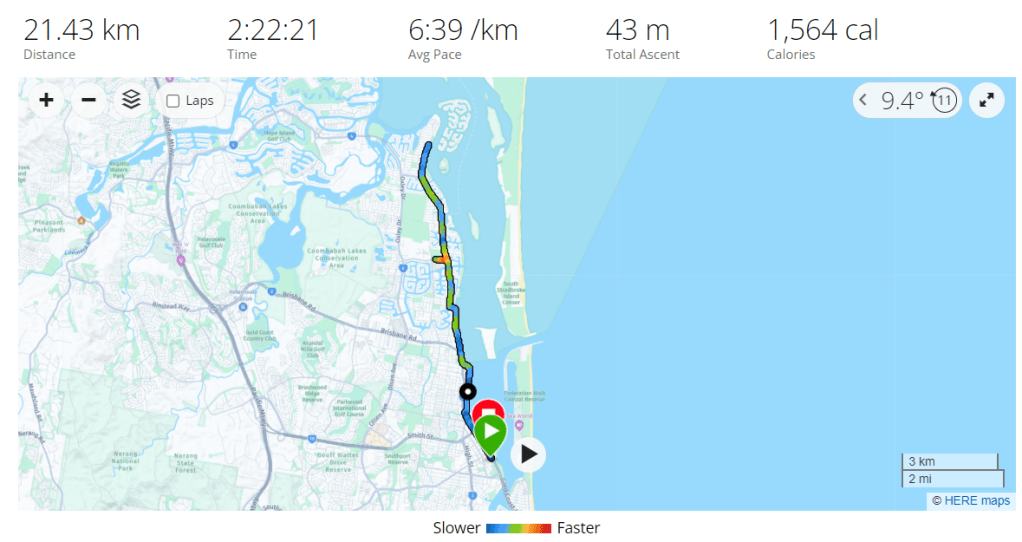
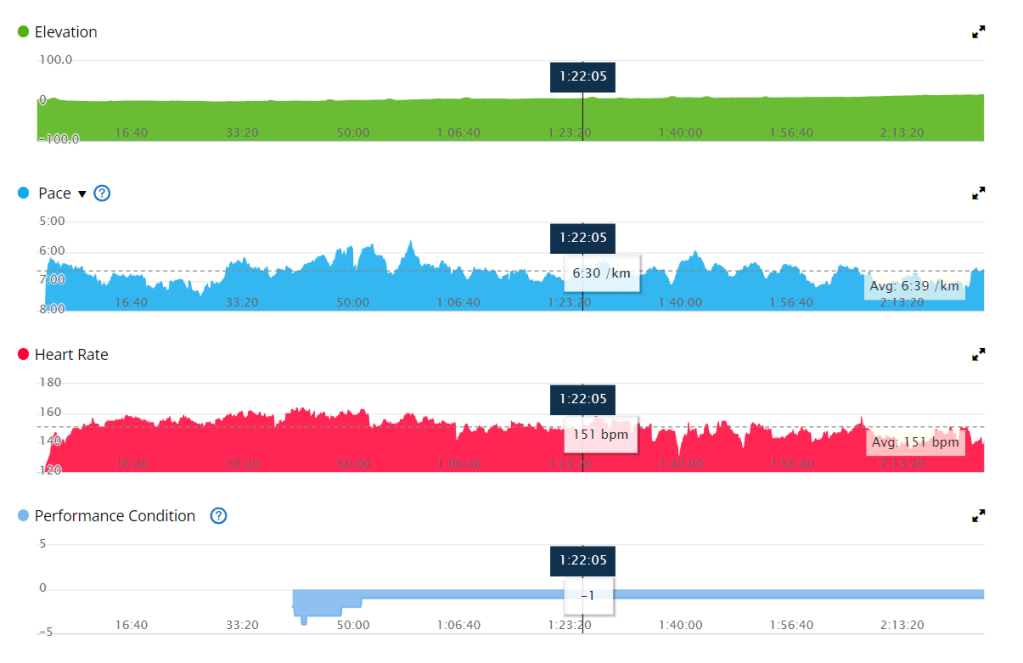
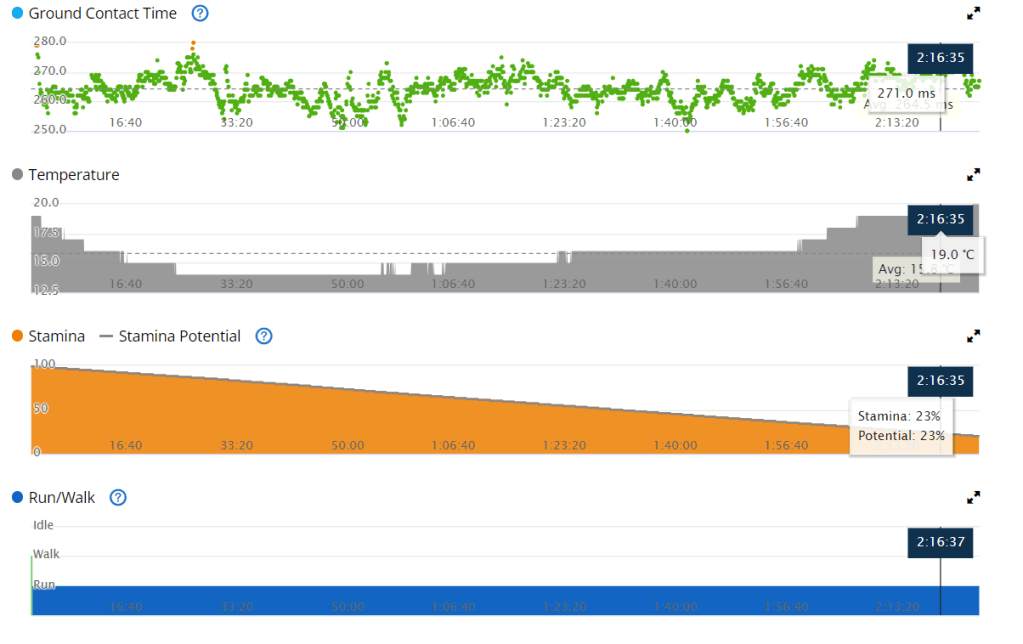
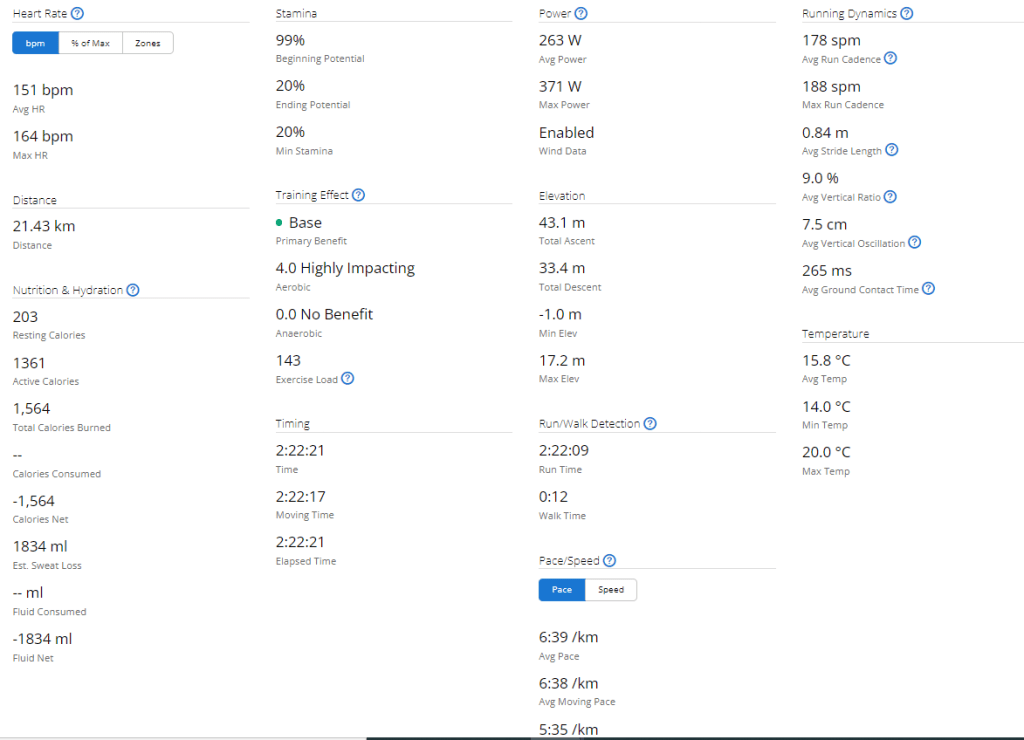
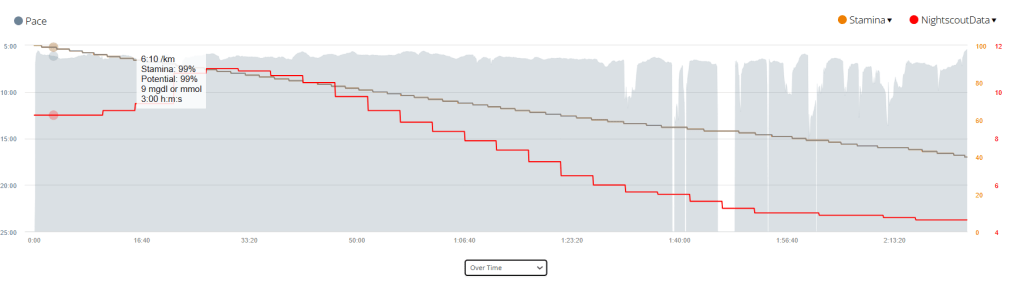
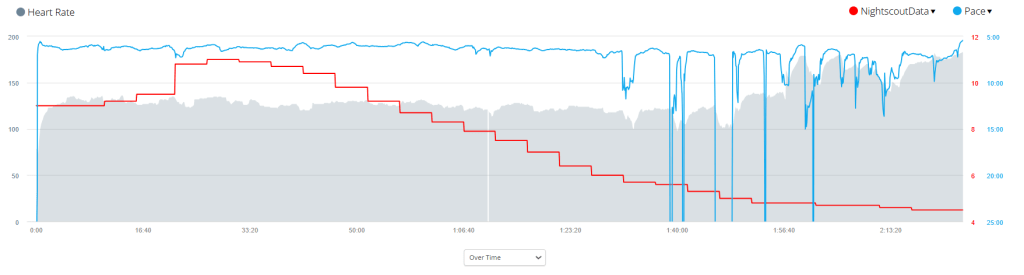
Due to the inclement weather my Garmin didn’t pick up my heart rate on my watch consistency, or perhaps even accurately. I found my Garmin advising I was running at approximately 130 BPM even though I felt I was pushing quite hard. I got a personal best (61 minutes) for the first 10 kilometres.

| Label | Race Day | Average during Training |
|---|---|---|
| Start Time | 06:23 am | |
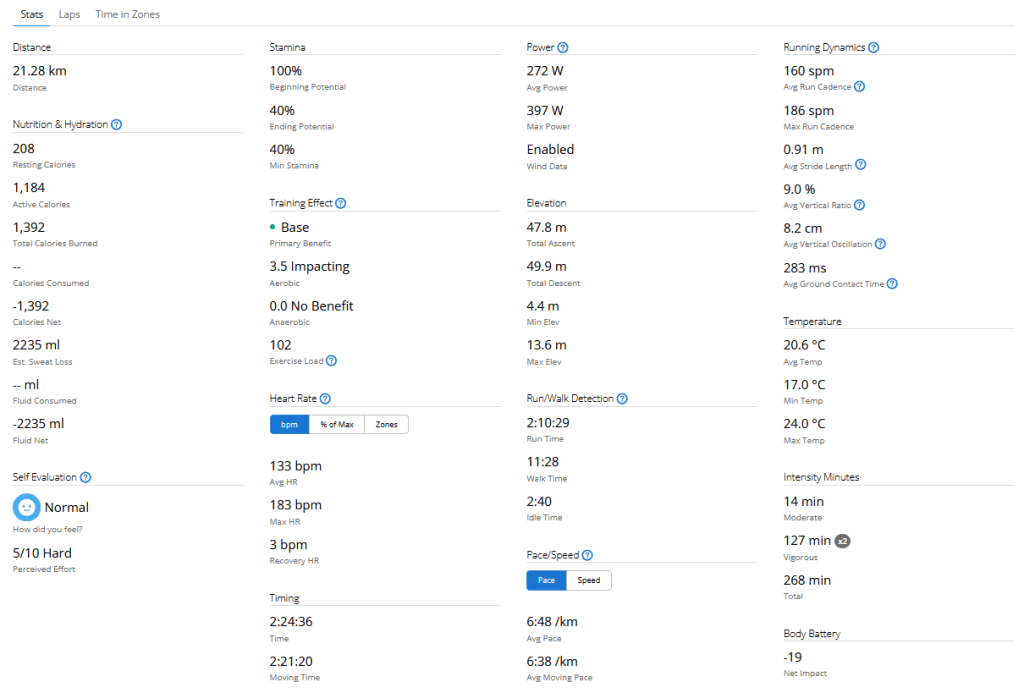
| Distance | 21.2km | |
| Average HR | 133 BPM | |
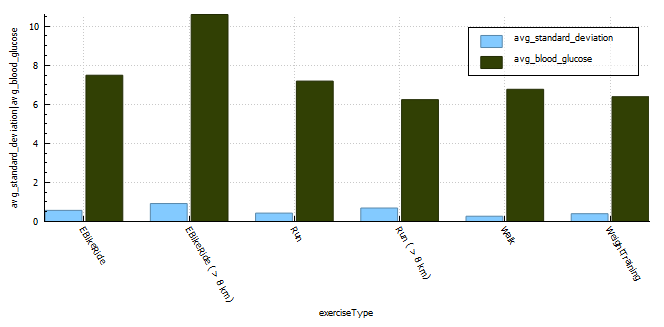
| Standard Deviation | 2.3 mmol/l | 0.8 |
| Coefficient of the variation | 31.9% | 11.3% |
| Blood Glucose – start | 9 mmol/l | 6.5 |
| Blood Glucose – min | 4.4 mmol/l | |
| Blood Glucose – max | 11.1 mmol | |
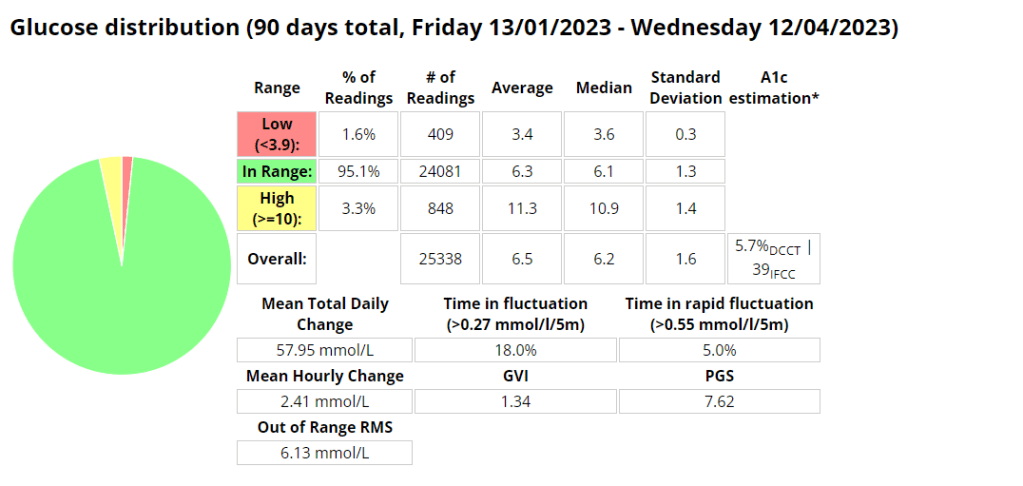
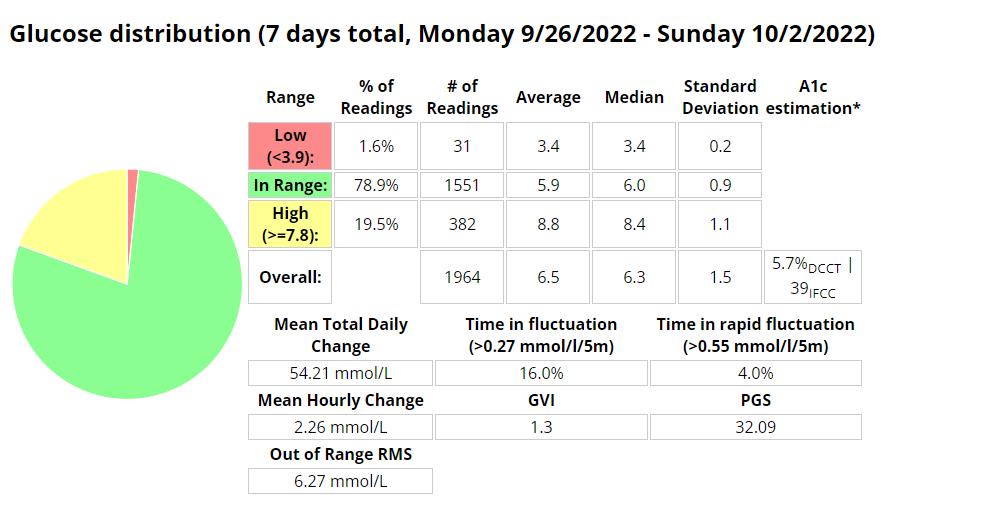
| Blood Glucose – average | 7.4 mmol/l | 6.7 |
| Time in Range (3.9-7.8) | 51% | 71.9% |
| Insulin on board | 0.99 | 0.1 |
Race day compared to training was wildly different, I will need to analyse the data and come up with a better race day strategy.
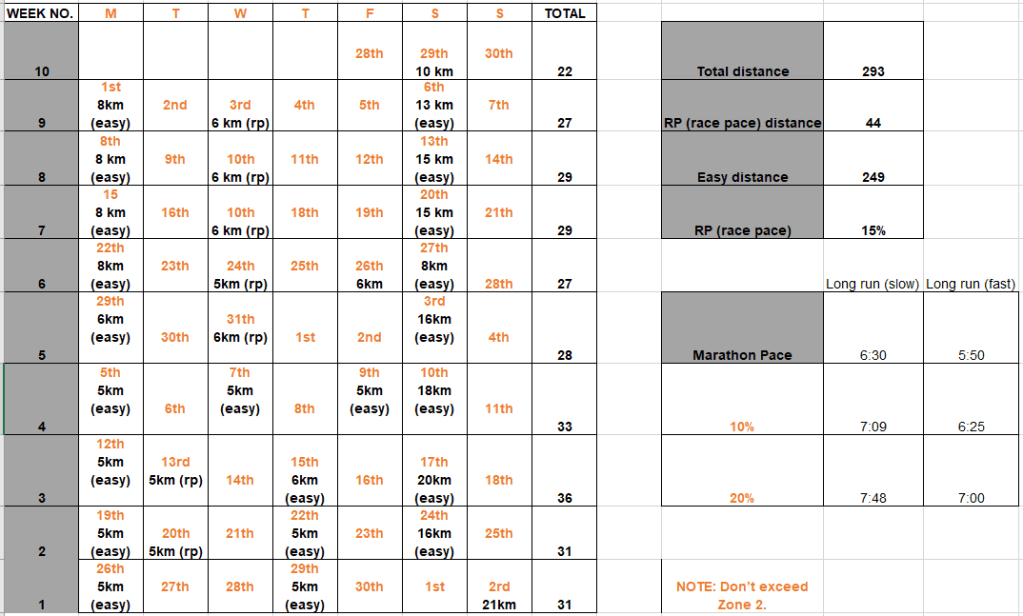
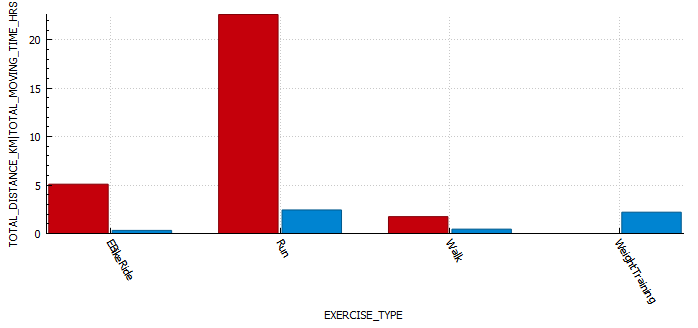
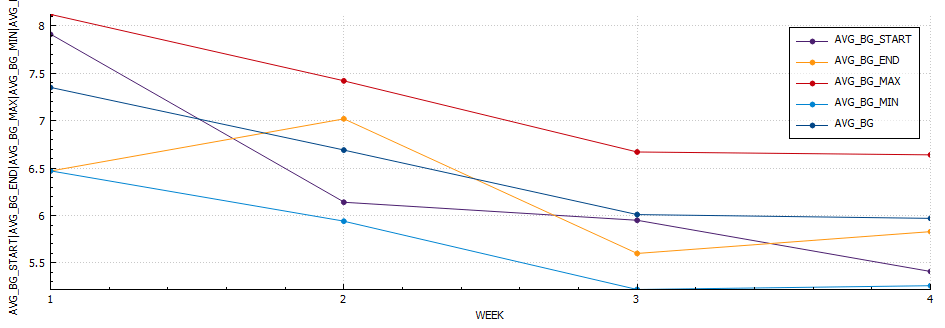
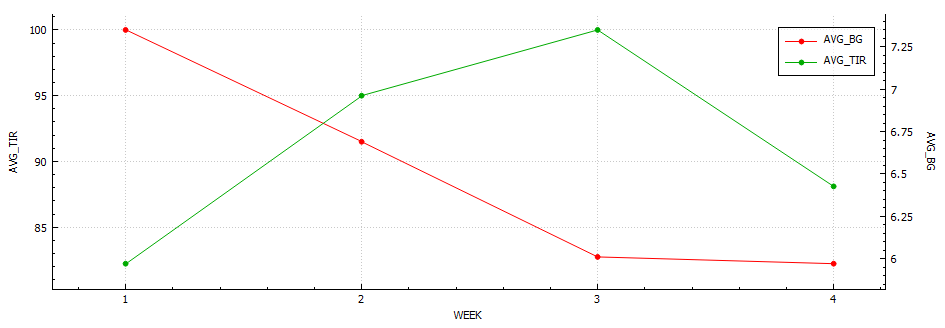
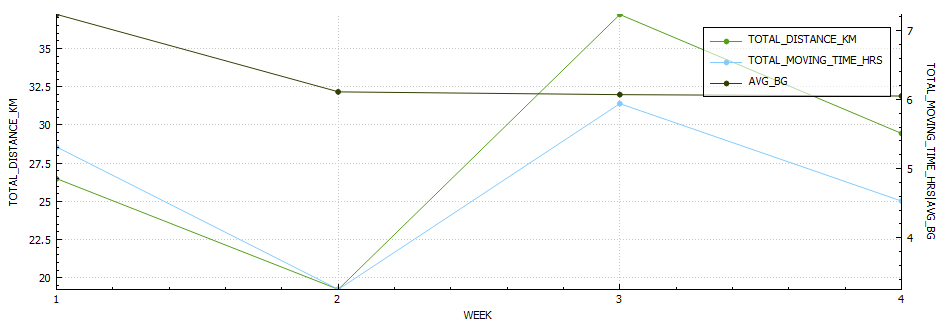
Training
I’ll add the link once all data is processed.
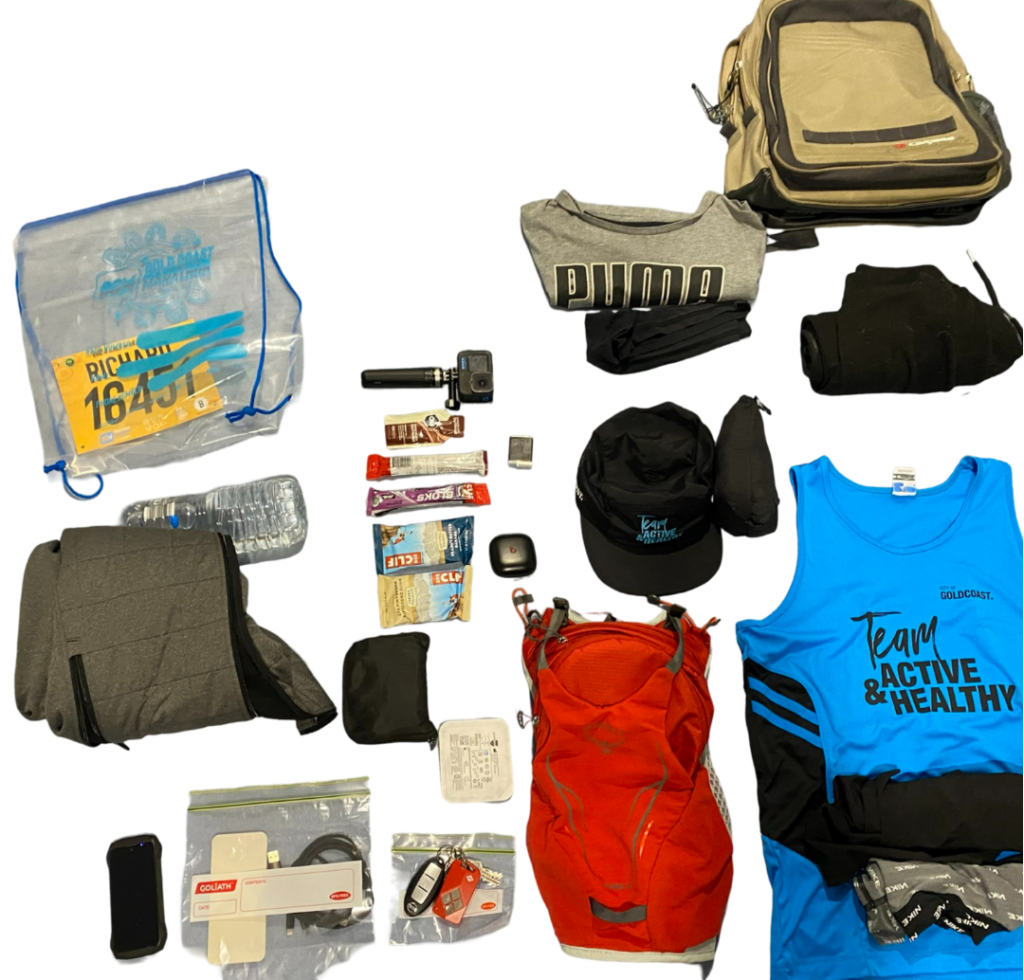
Equipment
I try to come prepared for all possibilities.
This year I spend a lot of time finding the perfect shoe for my unique requirements, namely that I supinate on my right foot due to an atrophied right calf muscle. In my testing, the Brooks Ghost performed the best, allowing me to run any distance with no pain or discomfort.
Final Thoughts
The food poisoning caused an electrolyte balance, which resulted in muscle cramps on race day. This was something I had not experienced during my training, an I was ill prepared for it.
My sugars were higher than during training again, and if I do this again I will refrain from coffee or any carbs prior to the event.