Summary
I am starting to feel like a routine is forming, perhaps not around diet yet, but definitely in regards to training. In previous years of doing this I was eating clean most days, as it provided improved diabetic control in the absence of an APS/AID and pump.
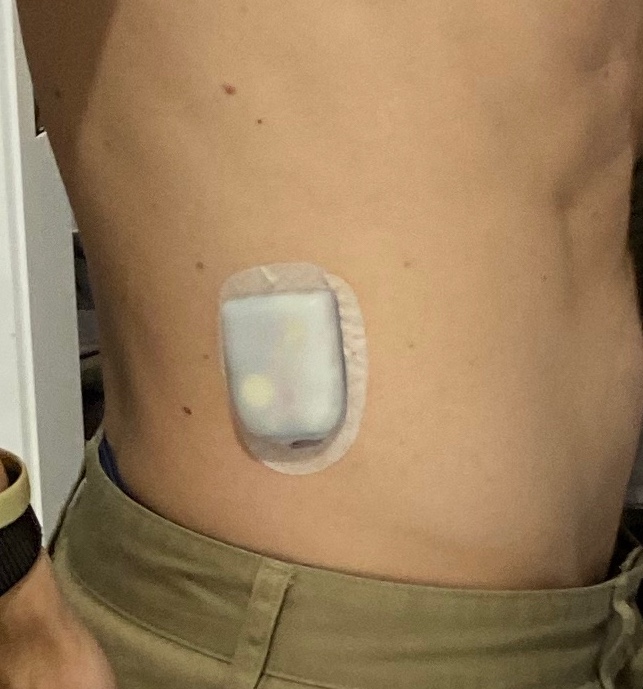
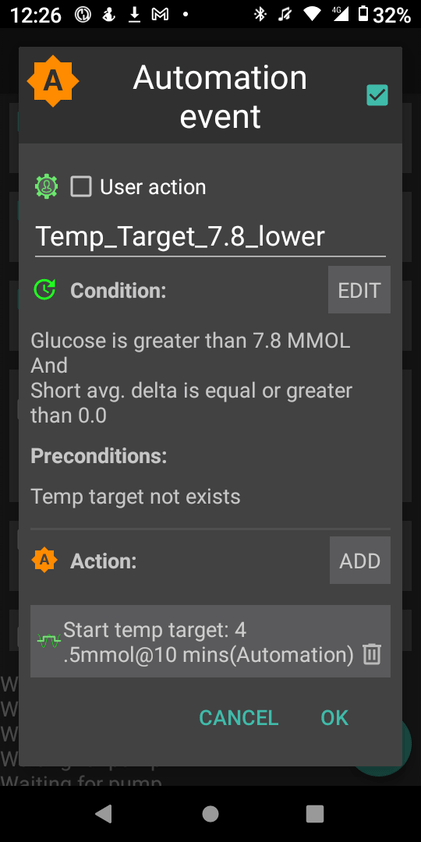
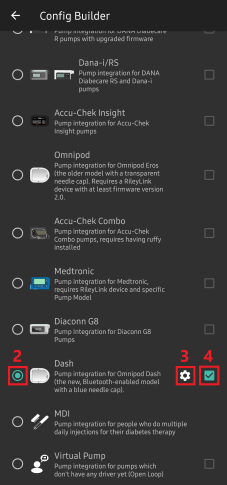
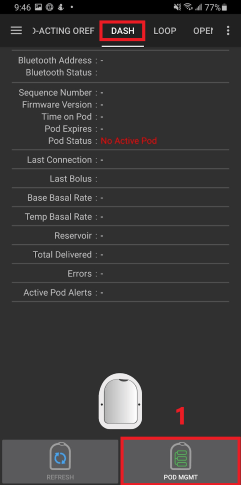
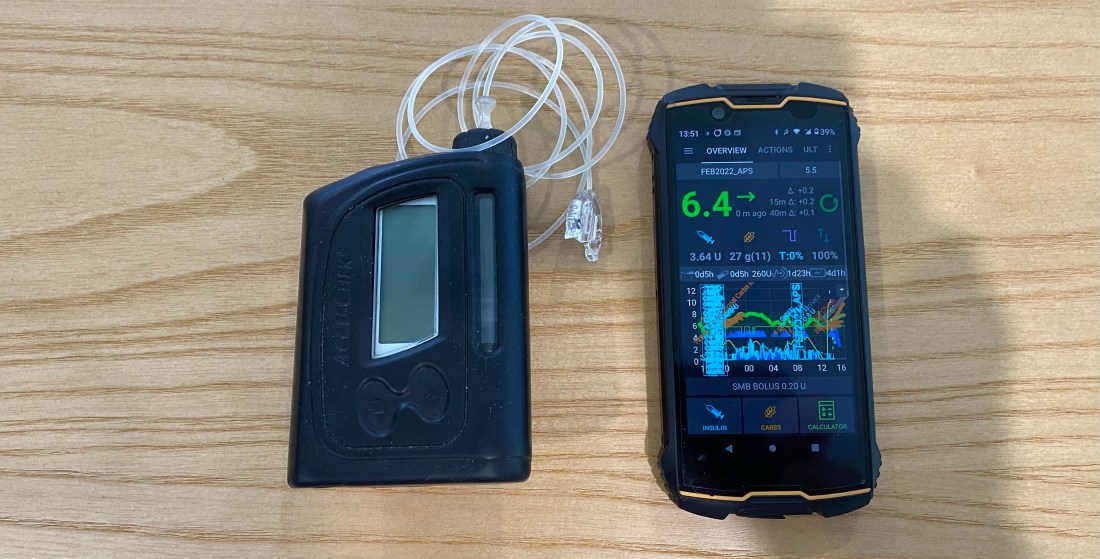
This week was particularly heavy due to my birthday dinner, a new phone, a new version of AAPS (Boost test platform 3.6.5) and a 25 km cycle. *I have been unable to pair my galaxy watch with my new phone, which is sad as I really liked the watch and having the plethora of sensors.
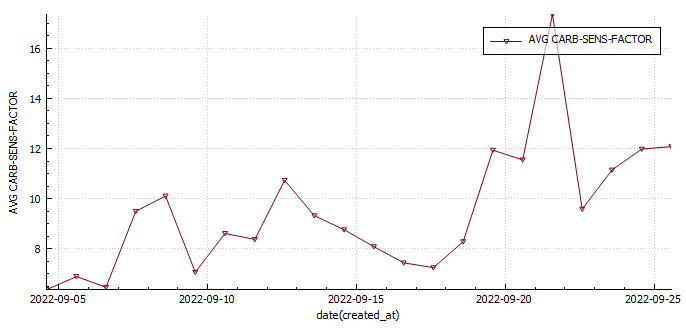
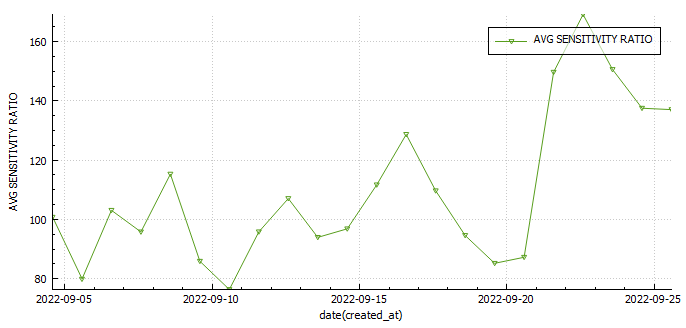
I was investigating the possibility of measuring insulin sensitivity changes in AAPS . One way would be to use the autosens feature in AAPS , but since I wasn’t including the carbs I ate to fix hypos, and I was snacking in-between to keep my readings steady that wasn’t going to work. The only metric that may prove useful may be my carb sensitivity factor (CSF). The average CSF over the 22 days so far is 8.7 while the average sensitivity ratio was 106%. This would mean that according to CSF I was 36% more sensitive to carbs yesterday or 29% less sensitive according to autosens.
Body Metrics
| Start | Week 1 | Week 2 | Week 3 | Week 4 | |
| Weight (kilograms) | 75.8 | 74 | 75 | 74.1 | |
| Body fat percentage (according to Samsung) | 17.3% | 17.8 | * | ||
| Body fat percentage (according to the navy seal calculator) | 15% | 15% | 14.8% | ||
| Total volume | |||||
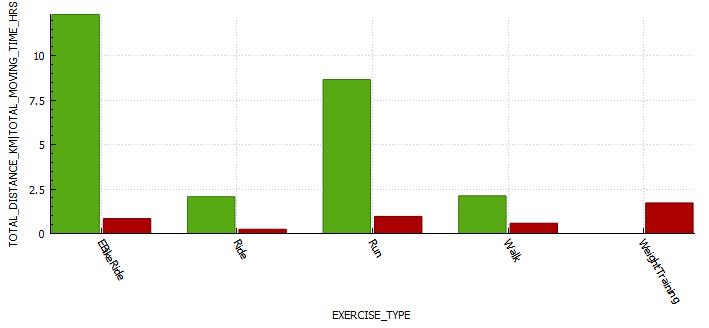
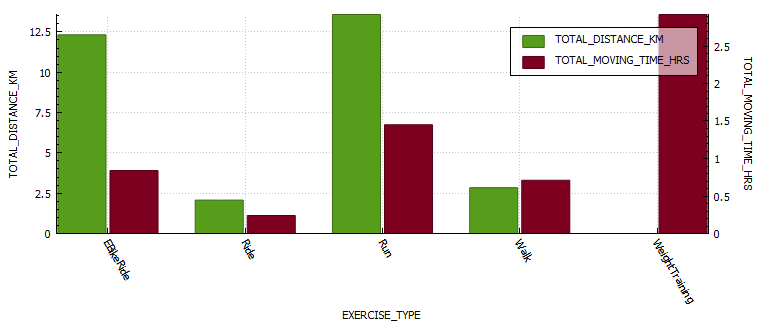
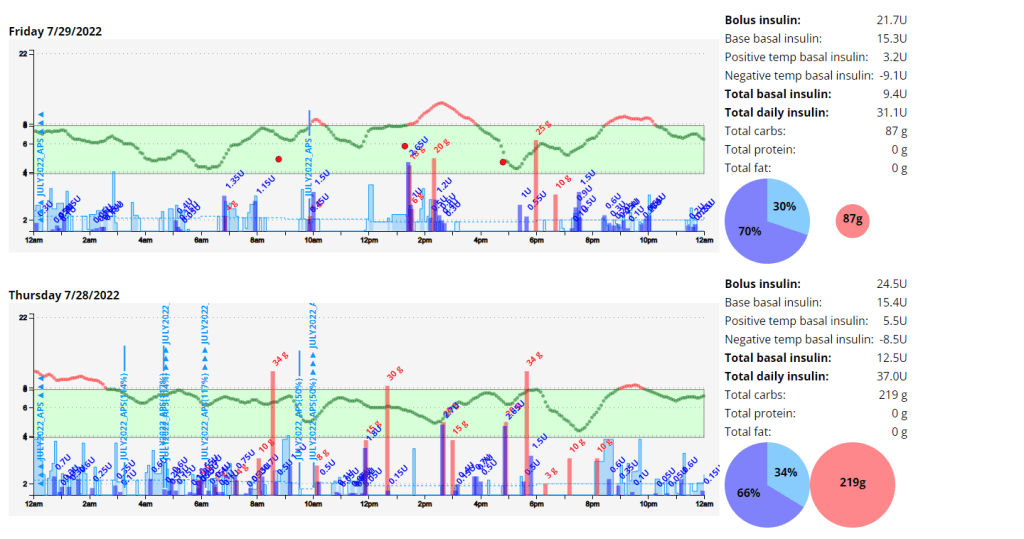
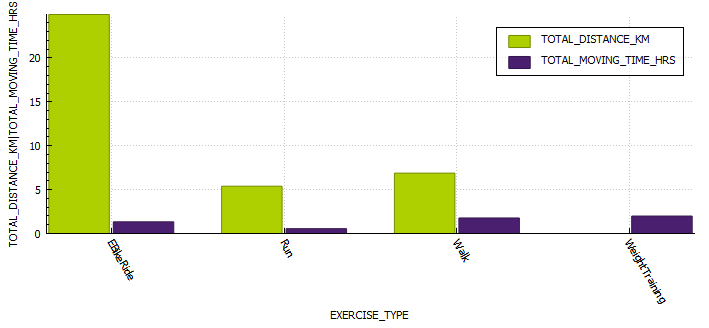
Exercise
| Week 1 | Week 2 | Week 3 | Week 4 | |
| Distance (kilometres) | 25.17 | 20.54 | 37.22 | |
| Activity (hours) | 4.34 | 3.65 | 5.64 |
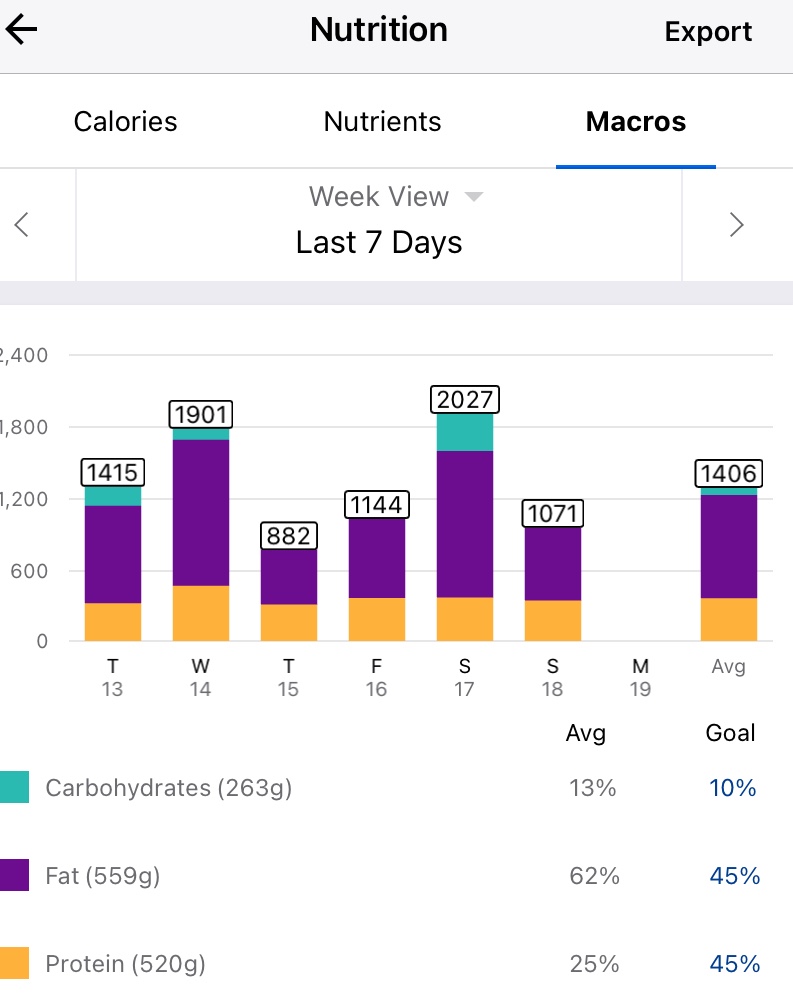
Nutrition


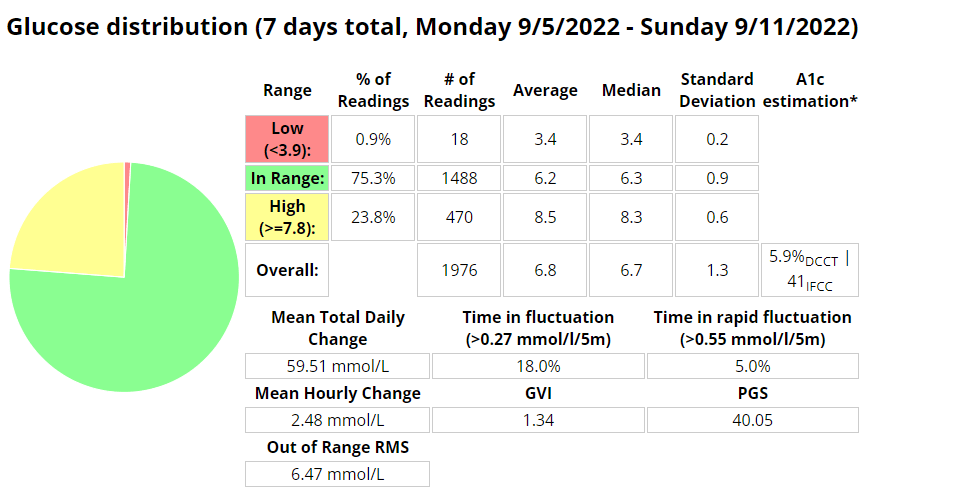
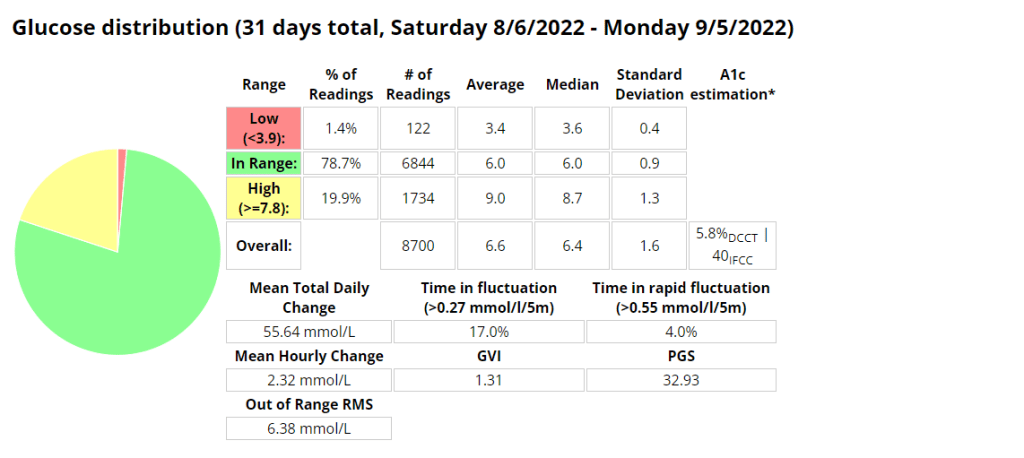
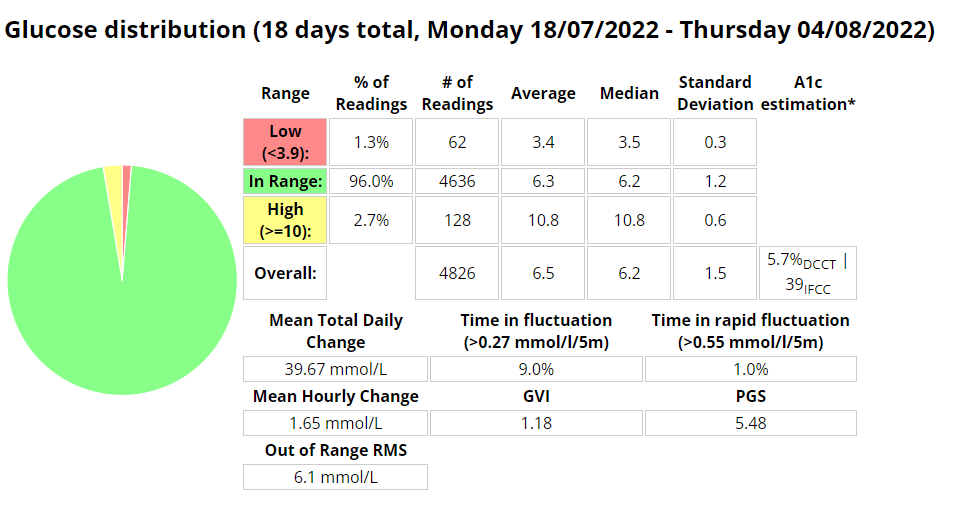
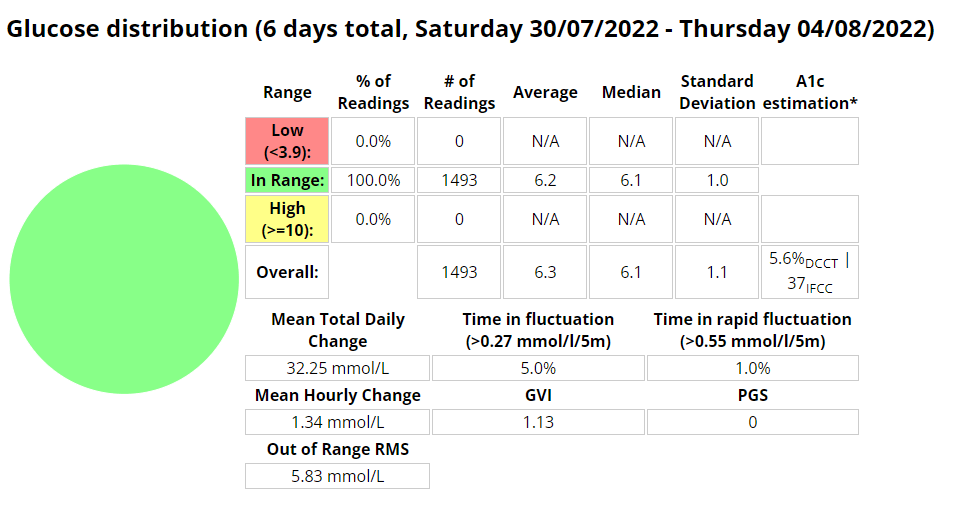
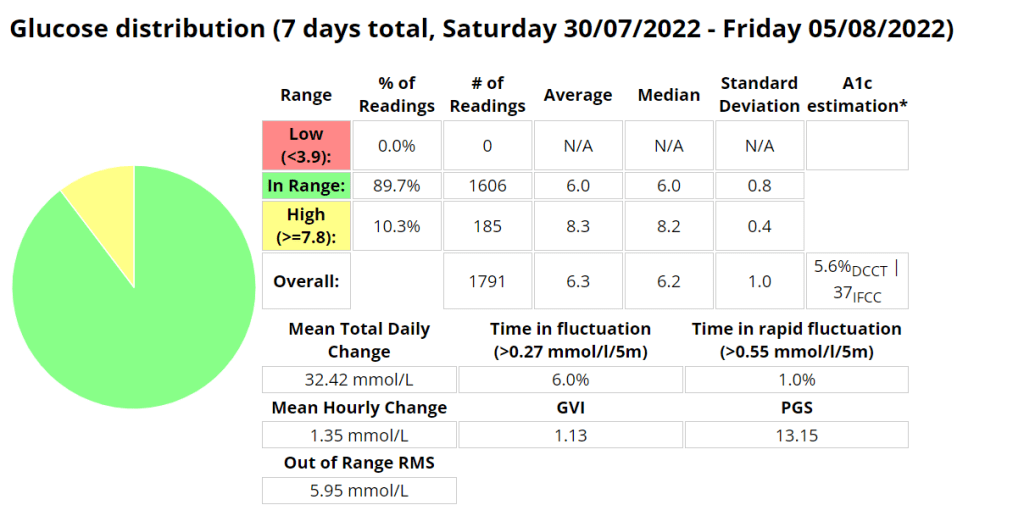
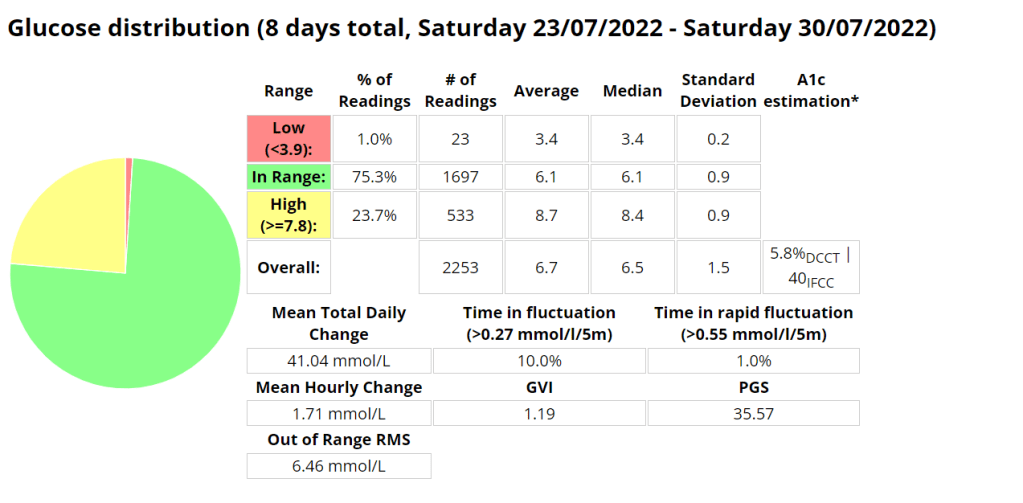
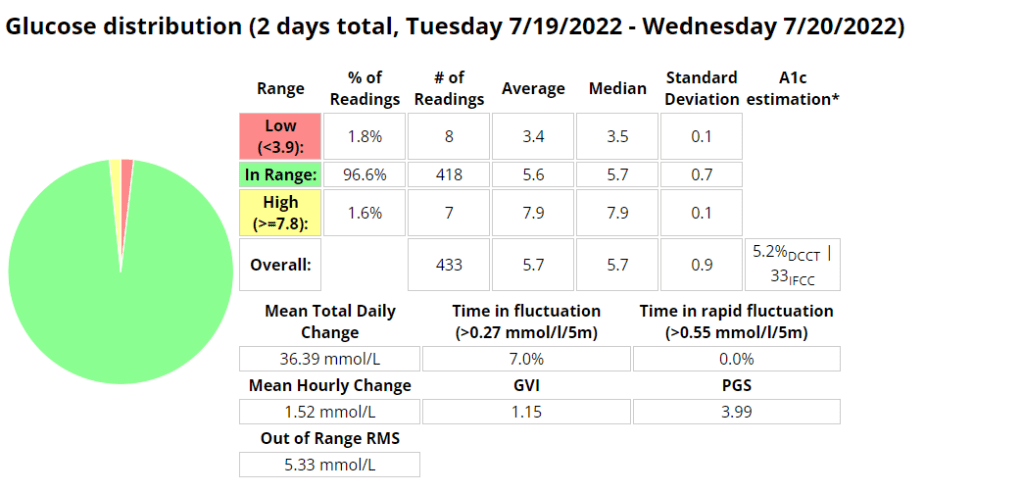
Diabetes
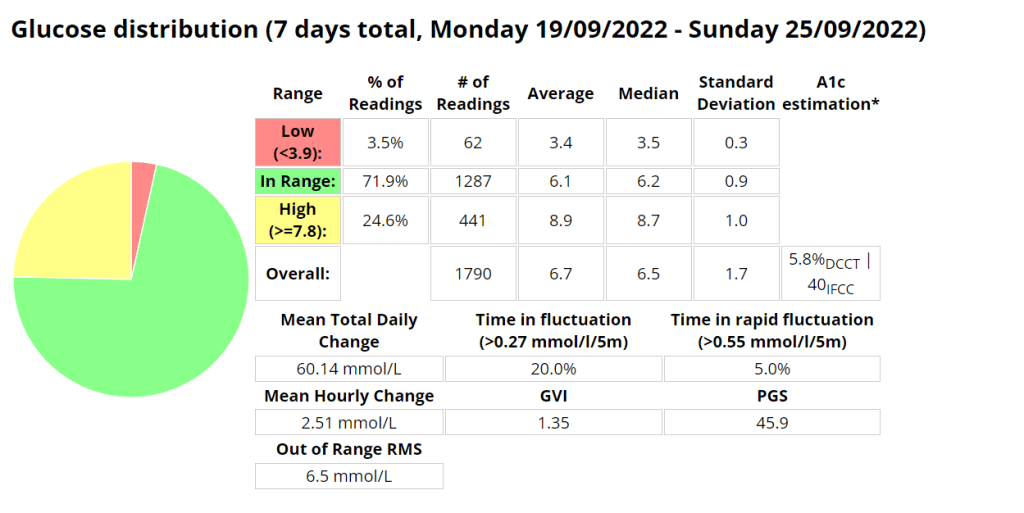
| Week 1 | Week 2 | Week 3 | Week 4 | |
| Low (<3.9) (%) | 0.9 | 0.6 | 3.5 | |
| In Range (3.9-7.8) (%) | 75.3 | 74.7 | 71.9 | |
| High (>= 7.8) (%) | 23.8 | 24.7 | 24.6 | |
| Standard deviation (SD) | 1.3 | 1.7 | 1.7 | |
| Average (mmol/l) | 6.8 | 7.0 | 6.7 | |
| A1c estimation (%) | 5.9 | 6.0 | 5.8 |
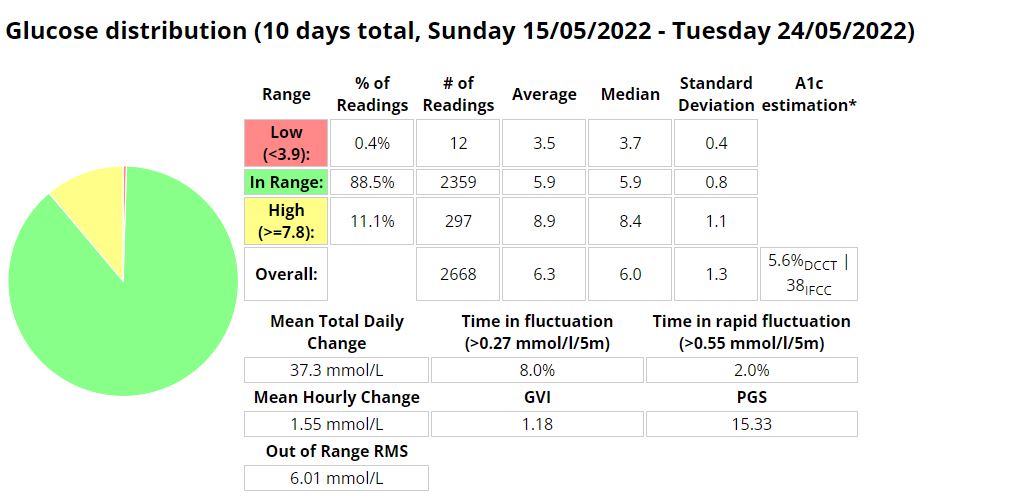
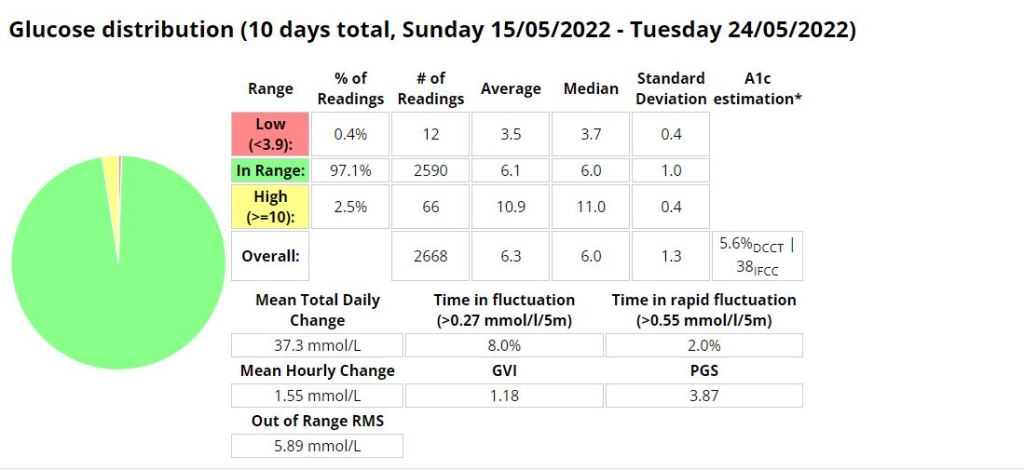
Ideally I want to see a time-in-range (TIR – 3.9-7.8 mmol/l) exceeding 90% with an average in the low sixes and a standard deviation (SD) around one (1).