Disclaimer: The information contained within this blog post are my thoughts and do not constitute medical advice. Please consult your medical team before making any changes to your diet or blood sugar management program.
I decided to get an analogue bicycle and I have loved the challenge of riding it. I had a terrible GC half marathon (GCHM), complete with muscle spasms, but I finished so that was nice. The training for the GCHM was amazing and I got to run in some pretty interesting places, like the NSW rail trail in Casino.
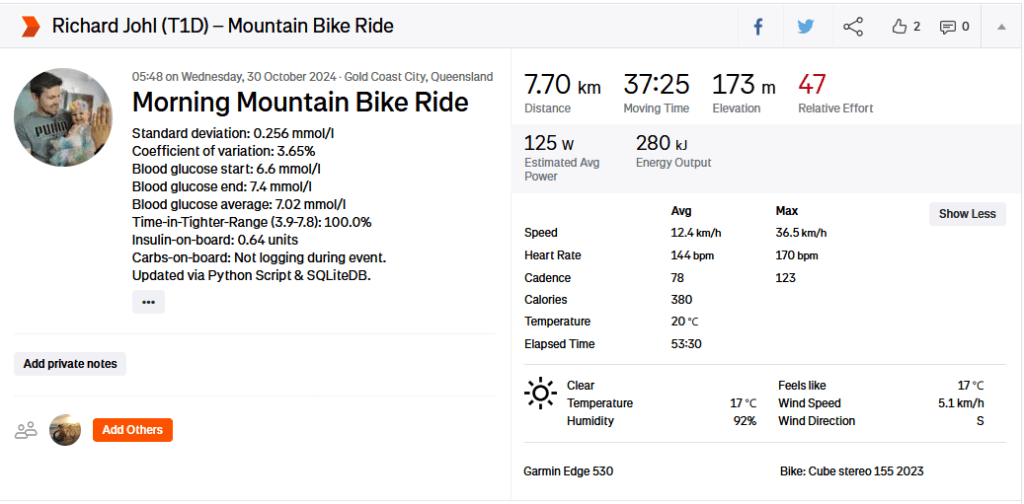
I have developed a host of new features for my Diabetes Analysis Tool, including an integration into Strava, where I update my exercise description with my exercise stats.
Physiological Metrics
I am currently on an average of 42.9 units per day and an average of 150g of carbs per day. These carbs include carbs from fat and protein (gluconeogenesis).
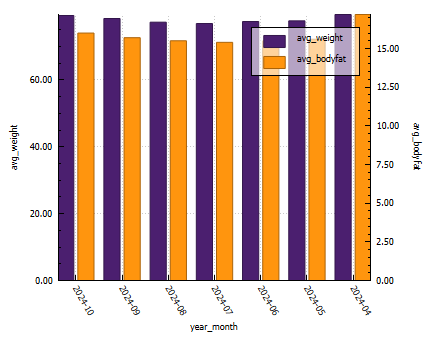
You can see from the graph below that my weight has fluctuated quite a bit this year, with poor eating habits (snacking at night) the biggest contributor to a lower time in range. My lowest bodyfat was 15% (confirmed by 3rd party testing). This dramatic weight shift was due to training for the GCHM.
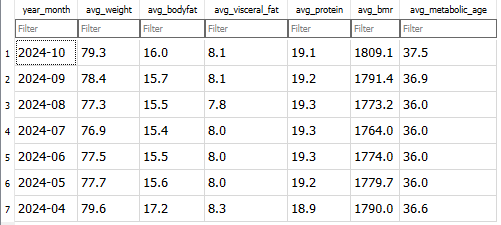
Extract from the Renpho smart scale imported for Analysis.
Weight and Bodyfat graph exported from Diabetic Analysis Tool.
Exercise metrics
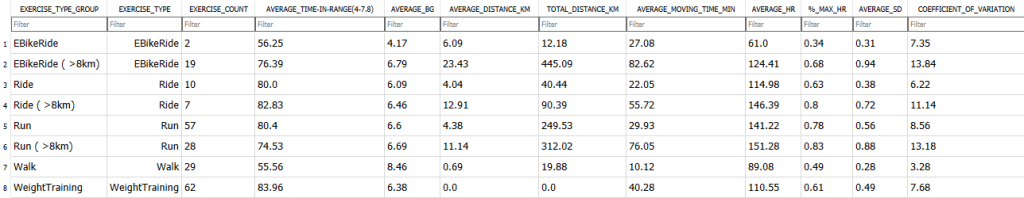
Every year I try to increase my distances and time in range (TIR). This year I increased my TIR by 2%, which is incredible. Although my CV and SD are lower, average glucose is down 0.06 mmol/l. I attribute this to lower insulin closer to exercise time, and refuelling at appropriate time intervals.
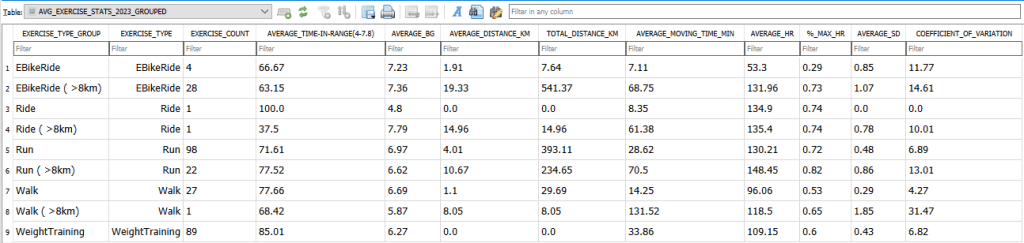
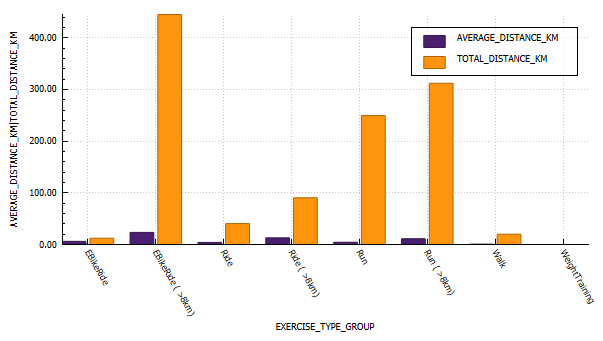
Annual view of exercise stats2024 exercise stats (grouped by distance)2023 exercise stats (grouped by distance)
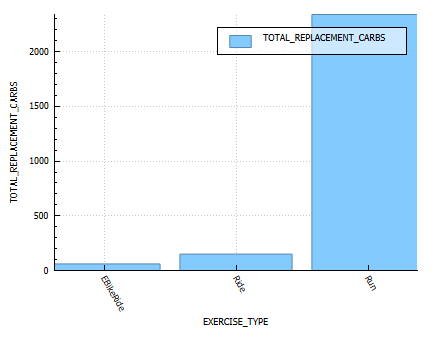
Energy Burn Rates
A table of the estimated energy replacement carbs consumed.
Time-in-range (TIR)
A graph of Time in Range (3.8-7.8) per exercise.
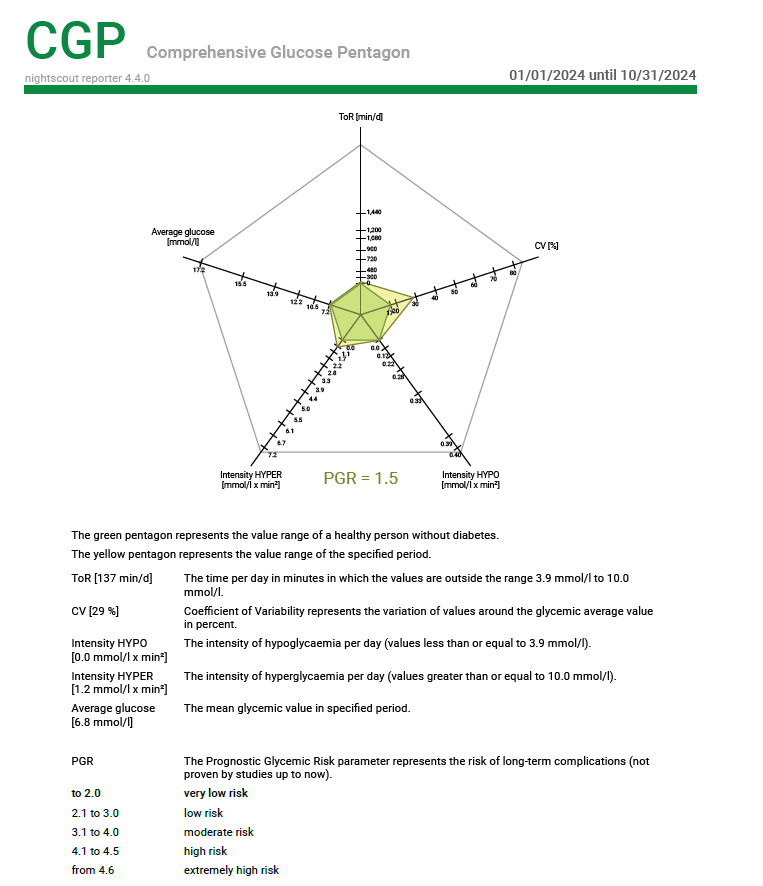
Blood glucose control metrics
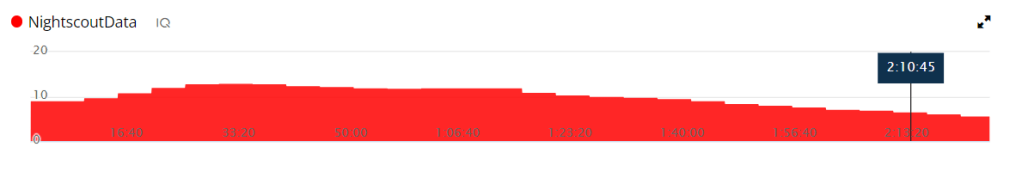
Extracted from Nightscout Reporter
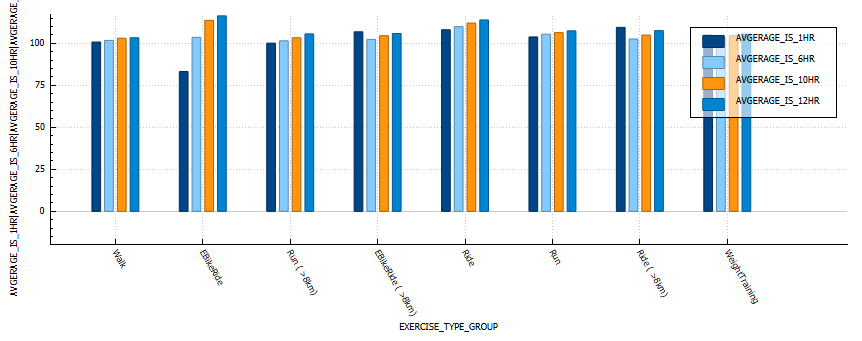
Insulin sensitivity
In the below graph we can see that walking and weight training result in the lowest changes in sensitivity.
Graph derived from AVG_EXERCISE_STATS_2024_GROUPED_INSULIN_SENSITIVITY table.
The Dawn Effect and Blood Glucose: When we wake up in the morning, our body experiences a surge of hormones, commonly referred to as the “dawn effect” or “dawn phenomenon.” This natural hormonal response can lead to an increase in blood glucose levels even before we consume any food or engage in physical activity. Cortisol, growth hormone, and other hormones play a role in this phenomenon. For individuals with diabetes, the dawn effect can pose challenges in maintaining stable blood glucose levels, especially during a race. The hormonal surge may contribute to higher blood sugar levels, making it crucial to adjust your diabetes management routine accordingly.
This graph shows the average blood sugar during training vs. my blood sugar from the Gold Coast Half Marathon.
Training vs. Race
Average distance (km)
Average time (min)
Average HR (bpm)
TIR (3.9 – 7.8)
Average Blood Glucose (mmol/l)
Coefficient of variation (%)
Pace
Training
14
92
156
92%
5.8
14
6:40
Race
21.4
140
151
21.4%
9.9
22.54
6:39
This table shows the average metrics during training vs. the same metrics during the Gold Coast Half Marathon.
Blood Glucose Management: Pre-Race Strategies: To optimize your blood glucose levels during a race, careful planning and preparation are key.
Here are some strategies to consider:
Race Day Automation: If you use an insulin pump or automated insulin delivery system, consider setting up a race day automation plan. Gradually reducing your insulin on board (IOB) and raising your blood sugar target before the race can help mitigate the impact of the dawn effect.
The automation I use if I plan on exercising at 06:30am. I use 05:00 – 06:00 so that if another automation is active at 05:00am there is opportunity for this automation to run after that one completes.
Timing of Pre-Exercise Snacks: To align the digestion of carbohydrates with the energy demands of the race, it is important to time your pre-race snack appropriately. If your blood glucose is around 5 mmol/l before starting, consuming a carbohydrate-rich snack approximately 15 minutes before the race can help maintain stable blood glucose levels, in my experience cliff bars have the perfect amount of nutrients for a long run.
Managing Blood Glucose During the Race: Once the race begins, various factors can influence your blood glucose levels.
Here are some considerations to keep in mind:
Listen to Your Body: Pay attention to any signs or symptoms that may indicate fluctuations in your blood glucose levels during the race. Feeling lightheaded, fatigued, or experiencing unusual thirst may indicate the need for carbohydrates. Regular Blood Glucose Monitoring: Carry a portable blood glucose meter to monitor your levels throughout the race. This will enable you to make timely adjustments and take appropriate remedial actions when necessary. Carbohydrate Consumption: Plan to consume carbohydrates during the race to maintain your blood glucose within a desirable range. Experiment with different forms of carbohydrates, such as gels, sports drinks, or energy bars, to find what works best for you. Remember to consider the impact of any exercise-induced insulin sensitivity and adjust your carbohydrate intake accordingly.
Data Extract from AAPS.
Post-Race Recovery: Upon crossing the finish line, it’s essential to prioritize your recovery and address any pain or discomfort that may have emerged during the race. Be mindful of the following:
Musculoskeletal Discomfort: Races can place significant stress on your body. Pay attention to any pain or discomfort in your muscles, joints, or tendons. Consult with a healthcare professional if necessary to address any post-race injuries. Blood Glucose Check: After the race, continue monitoring your blood glucose levels as they may fluctuate due to post-exercise hormonal responses. Adjust your post-race nutrition and insulin dosages accordingly.
Conclusion: Participating in a race as a person with diabetes requires careful consideration of blood glucose management strategies. Understanding the impact of waking up on hormonal levels, adjusting your approach accordingly, and incorporating remedial actions during the race are crucial steps towards maintaining stable blood glucose levels. By staying vigilant, prepared, and responsive to your body’s needs, you can conquer the challenges of a race while managing your diabetes effectively.
References:
American Diabetes Association. (2021). Diabetes and Exercise. Retrieved from https://www.diabetes.org/healthy-living/fitness/exercise-and-type-1-diabetesGupta, L., Khandelwal, D., Singla, R., Gupta, P., Kalra, S., & Dutta, D. (2017). Dawn Phenomenon and Its Impact on Blood Glucose Control. Indian Journal of Endocrinology and Metabolism, 21(6), 901–909. doi: 10.4103/ijem.IJEM_284_17
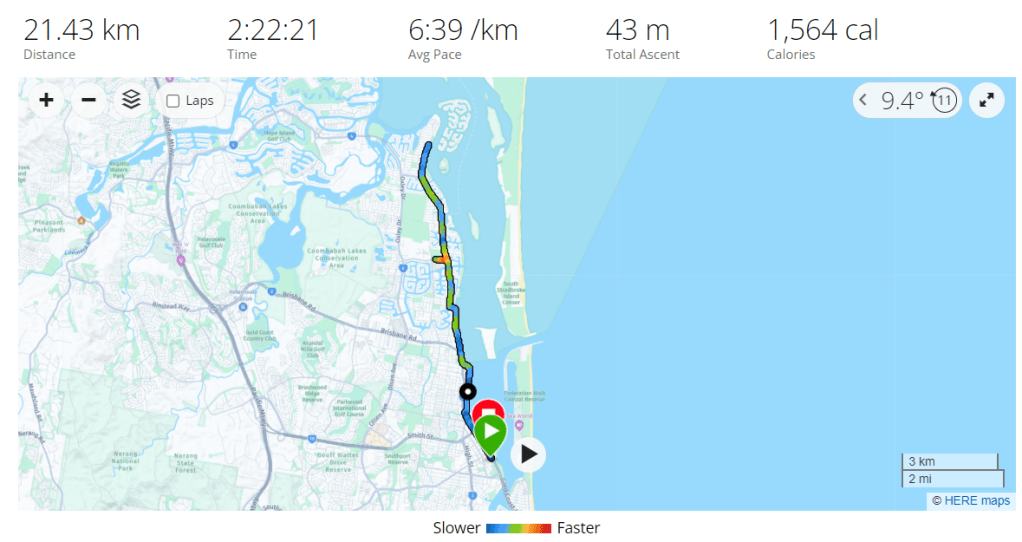
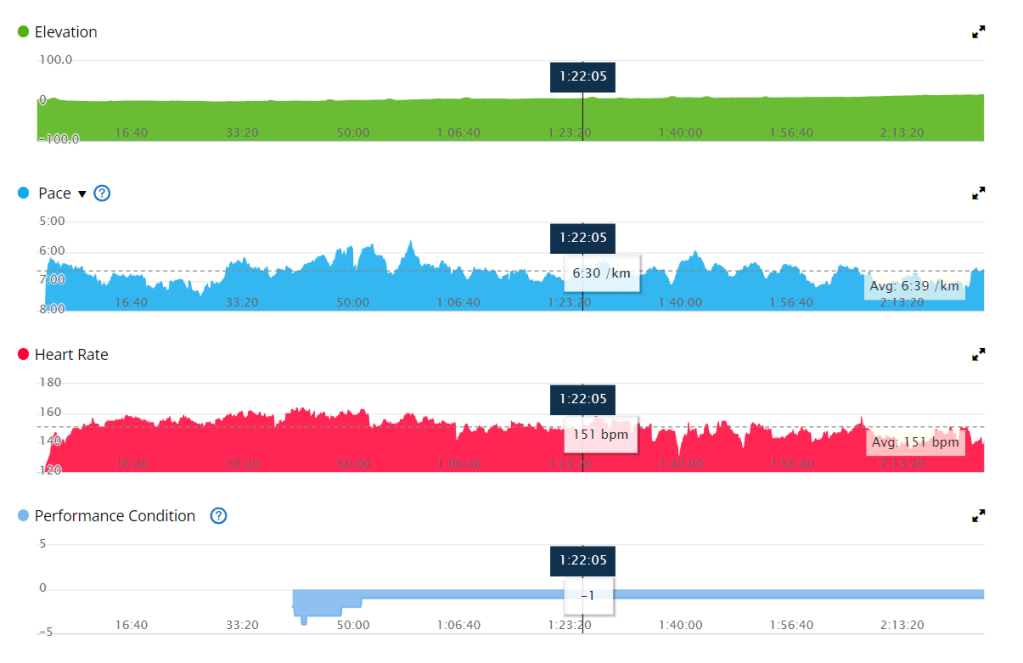
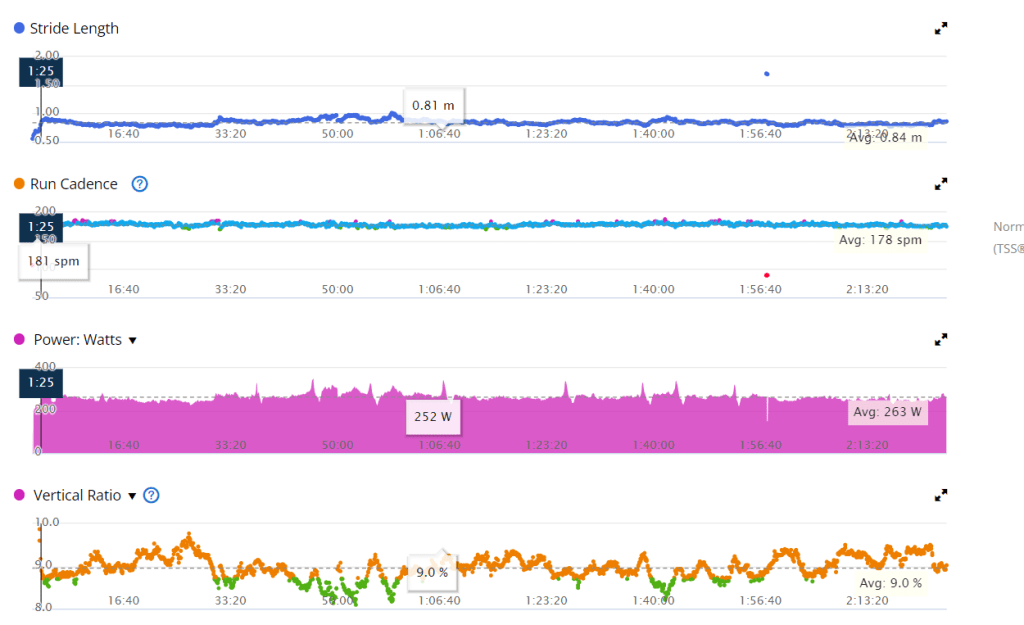
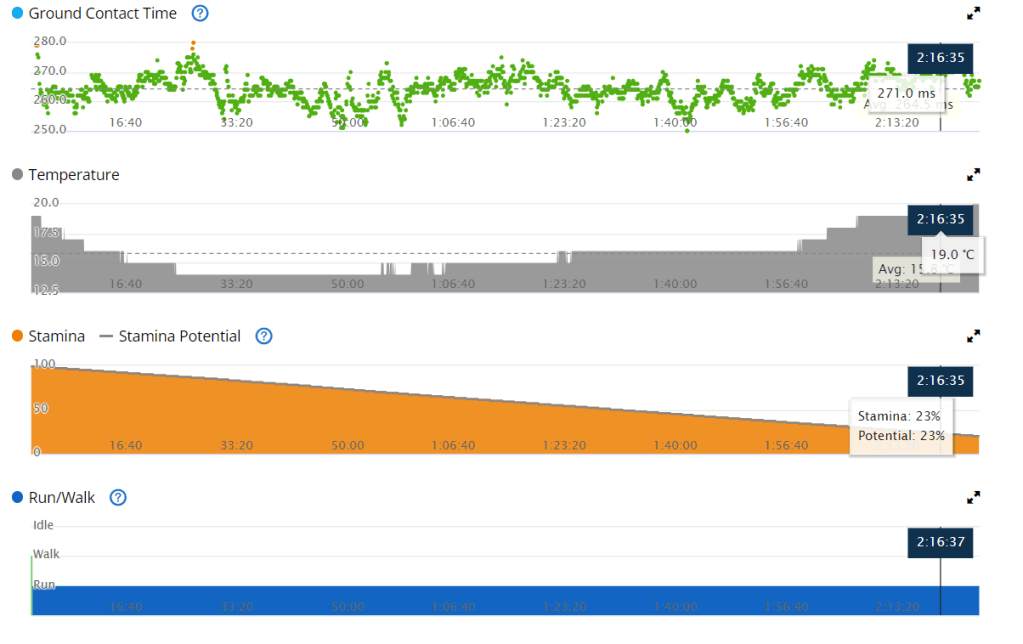
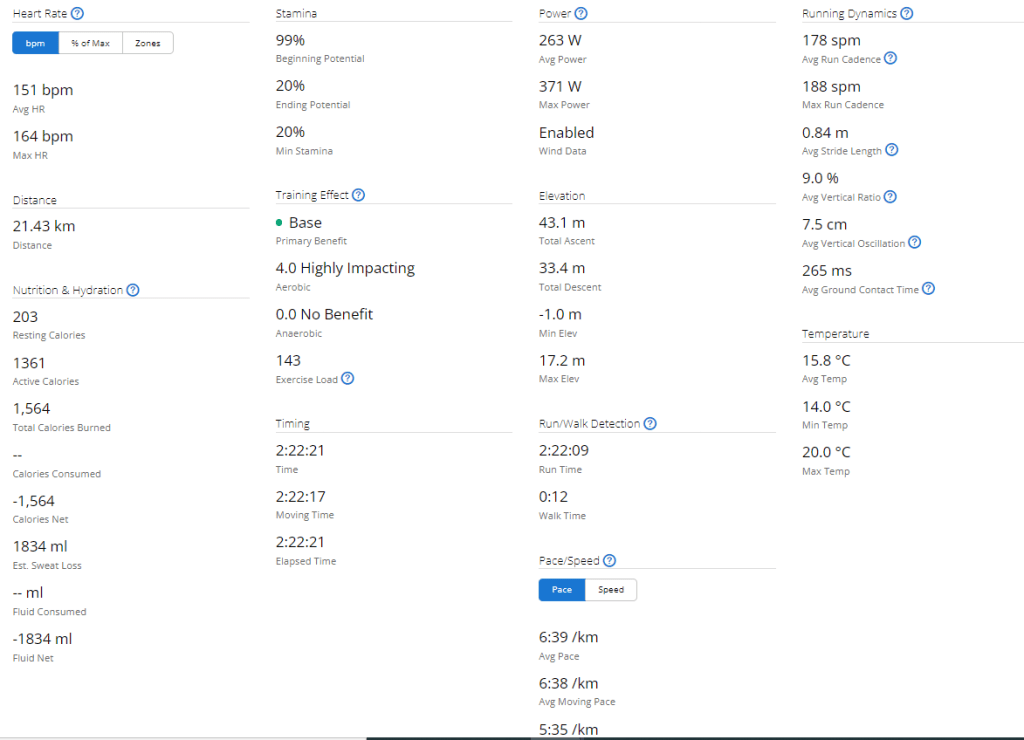
Exercise stats from Garmin
Equipment
Equipment Name
Note
Osprey duro 6 – Hydration pack
This hydration pack is a great option for long runs or cycles. It holds 1.5 liters of water, which is more than enough for most people to drink on a 2+ hour activity. It also has multiple pockets at the front of the vest, which allow you to store food, your phone, and your blood glucose meter. This makes it easy to access your essential items while you’re running or cycling.
Glucose gels
My general rule of thumb is bring at least twice the amount you expect you will need.
Cliff bar
The cliff bar was a new addition to my nutrition. These bars seemed to work well to stabilise blood glucose and I required no additional carbs for most runs between 14-18km.
Blood glucose meter + extra strips
If my sensor were to fail or I was to become dehydrated enough that my CGM reading was inaccurate I wanted to be able to assess my blood glucose.
Dexcom
Continuous glucose monitor. I ensured this had at least 24 hours to settle before the race. This way readings would more accurate.
Android APS phone
The phone that contain my artificial pancreas system.
Onmipod Dash
Bluetooth enabled insulin pump, allowing me to use Android APS. I ensured that I inserted the pod at least a day before the race so I had enough time to identify issues.
Brooks Ghost shoes
A comfortable pair of shoes you have tested and run in prior to the race. I still developed blisters so its imperative you get the correct size.
Asics running socks
A comfortable pair of socks.
Hat
A hat to ensure I don’t burn.
earbuds
To enjoy some music while I run.
Training
To prepare for the Gold Coast Marathon I did the following exercise;
Introduction: Fitness tracking has become an integral part of the modern fitness journey, helping individuals understand their progress, set goals, and optimize their training. Two popular platforms, Garmin and Strava, offer unique fitness metrics that provide insights into an individual’s performance and progress. In this blog post, we will delve into the science behind Garmin’s fitness metrics (VO2max, fitness age, training status, stamina) and compare them to Strava’s Fitness and Freshness metrics, shedding light on their differences and applications.
Garmin Fitness Metrics:
VO2max: Garmin’s VO2max is a well-known fitness metric that measures the maximum amount of oxygen an individual can consume during intense exercise. It is considered one of the most accurate indicators of aerobic fitness. The calculation takes into account factors such as heart rate, speed, elevation, and personal characteristics. The higher the VO2max, the better the cardiovascular fitness level.
Fitness Age: Garmin’s Fitness Age metric estimates an individual’s fitness level compared to the general population. It considers various parameters such as activity level, body composition, resting heart rate, and VO2max. By comparing these factors with an average person’s data, Garmin determines an individual’s fitness age. If your fitness age is lower than your actual age, it suggests a higher fitness level.
Training Status: Garmin’s Training Status provides real-time feedback on the effectiveness of your training program. It considers your recent exercise history, performance indicators, and physiological data to determine whether you are undertraining, maintaining, or overreaching. This helps individuals optimize their training by finding the right balance between intensity, volume, and recovery.
Stamina: Garmin’s Stamina metric helps gauge an individual’s energy levels during long-duration activities. It takes into account factors like heart rate, intensity, and duration to estimate the remaining time until exhaustion. Stamina provides valuable insights for endurance athletes, helping them understand their capabilities and manage their efforts during extended activities.
Strava Fitness Metrics:
Fitness: Strava’s Fitness metric focuses on an individual’s overall fitness level and is derived from analyzing their training load and intensity. By taking into account factors like distance, duration, and heart rate, Strava calculates a Fitness score. The higher the score, the better the overall fitness level. It provides a general indication of an individual’s current state of fitness.
Freshness: Strava’s Freshness metric complements the Fitness score by considering an individual’s recent training history. It evaluates the balance between training load and recovery, providing insights into the individual’s readiness for further intense training. A higher Freshness score suggests a well-recovered state, enabling athletes to plan their training schedule effectively.
Comparing Garmin and Strava Metrics:
While both Garmin and Strava offer valuable fitness metrics, there are some key differences between them. Garmin’s metrics, such as VO2max, fitness age, training status, and stamina, provide a more detailed analysis of an individual’s physiological parameters. They focus on factors like oxygen consumption, heart rate, and personalized data to provide a comprehensive view of fitness and performance.
On the other hand, Strava’s Fitness and Freshness metrics are more straightforward, providing a quick overview of an individual’s overall fitness level and recovery status. They are based on training load, intensity, and recent training history, offering insights into an individual’s readiness for further training.
The following table compares the key Garmin and Strava fitness metrics:
Metric
Garmin
Strava
VO2 max
Estimates the maximum amount of oxygen your body can use during exercise.
Not available.
Fitness age
Estimates your fitness level relative to your age.
Estimates your overall fitness level based on your activity history.
Training status
Indicates whether you are in a training, overtraining, or undertraining state.
Not available.
Stamina
Estimates your ability to sustain long-term exercise.
Not available.
Freshness
Estimates your recovery status based on your recent activity and sleep data.
Estimates your recovery status based on your recent activity and sleep data.
Conclusion:
Garmin and Strava, both renowned fitness platforms, offer distinct fitness metrics that cater to different aspects of training and performance. Garmin’s metrics, such as VO2max, fitness age, training status, and stamina, provide a deeper understanding of an individual’s physiological parameters. Strava’s Fitness and Freshness metrics, on the other hand, focus on overall fitness level and recovery status. By utilizing these metrics, individuals can optimize their training programs, set realistic goals, and monitor their progress effectively, ultimately enhancing their fitness journey.