Time in Tighter Range (TITR): A Powerful Metric for Measuring Diabetes Control

Introduction

For individuals living with diabetes, maintaining stable blood glucose levels is a critical aspect of managing their condition effectively. Traditionally, glycated hemoglobin (HbA1c) has been the primary metric for evaluating long-term glucose control. However, it provides only a snapshot of average glucose levels over several months. To gain deeper insights into daily glycemic patterns and fluctuations, healthcare professionals and patients are turning to a more comprehensive and dynamic metric called “Time in Tighter Range” (TITR).

What is Time in Tighter Range (TITR)?

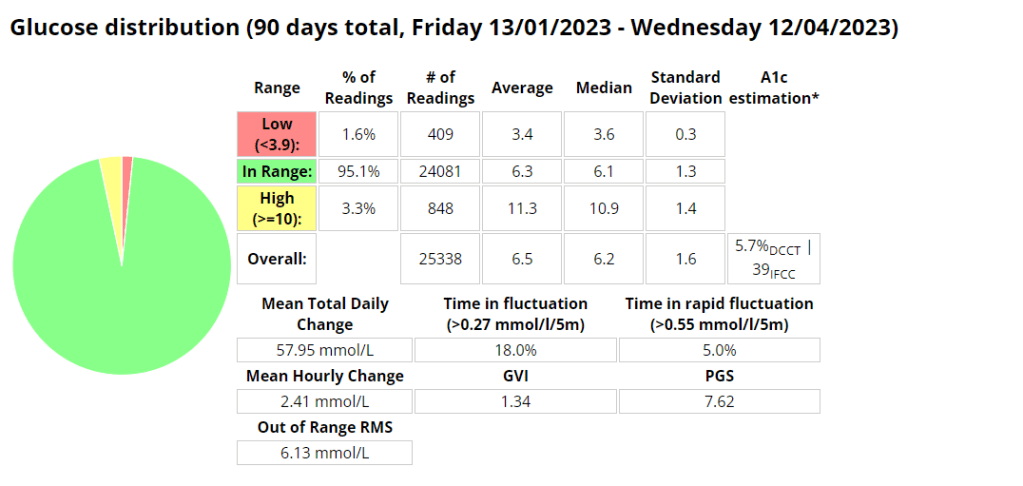
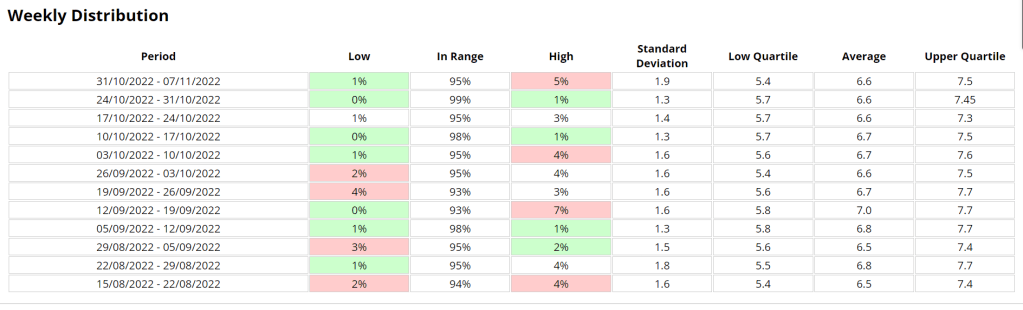
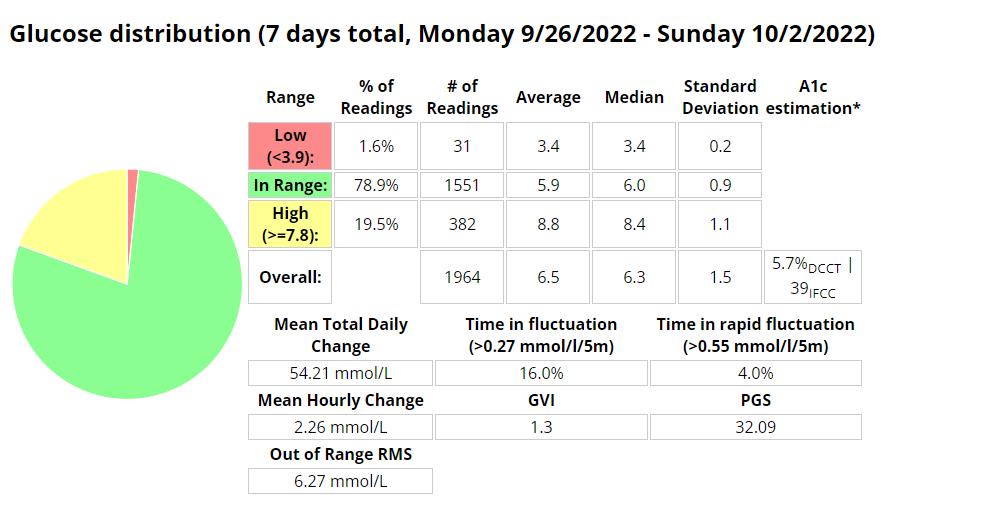
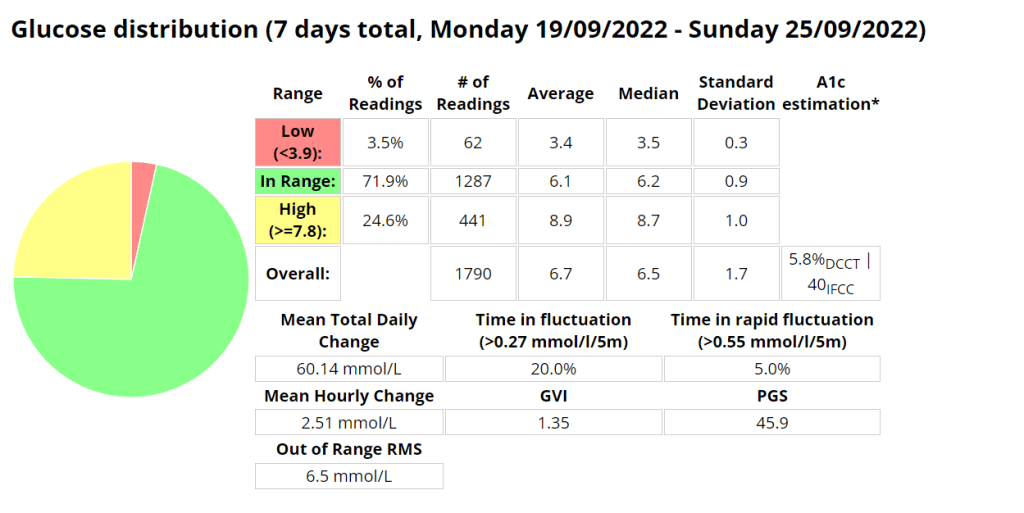
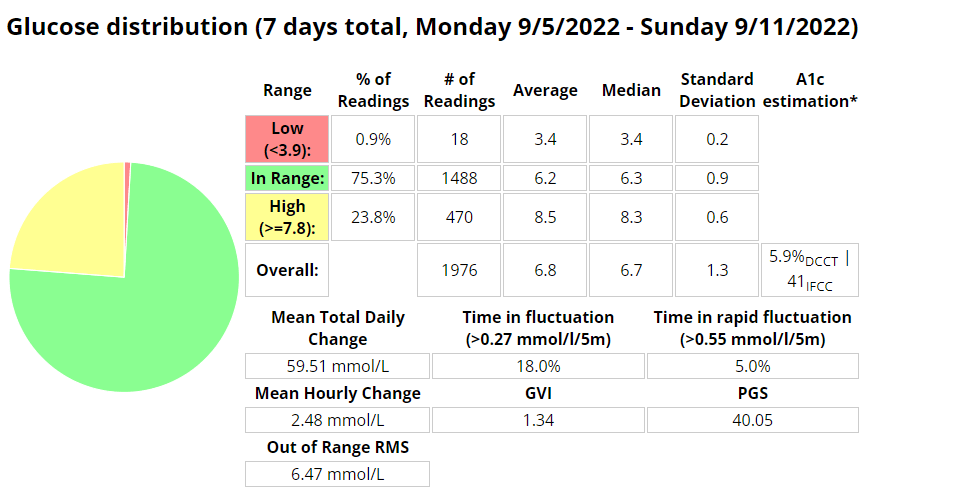
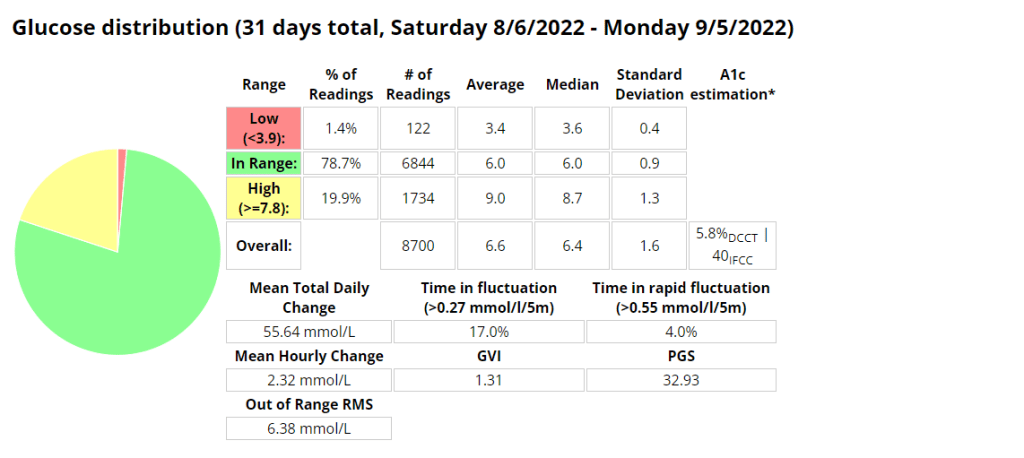
Time in Tighter Range (TITR) is a metric that quantifies the percentage of time blood glucose levels remain within a specific target range. The target range is often defined as the optimal window where glucose levels are considered both safe and effective in reducing the risk of diabetes-related complications. Commonly, the TITR target range is set between 70-140 mg/dL (3.9-7.8 mmol/L), but it can be tailored to an individual’s needs based on age, health status, and treatment goals.

Why TIR Matters in Diabetes Management

  1. Real-Time Assessment: Unlike HbA1c, which provides a retrospective average, TIR offers real-time data, empowering patients and healthcare professionals to make immediate adjustments to diabetes management strategies.
  2. Insights into Glucose Patterns: TITR helps reveal patterns and trends in glucose control, identifying potential trouble spots and offering opportunities for targeted interventions.
  3. Reduction of Hypoglycemia and Hyperglycemia: Maintaining TIR within the target range can reduce both hypoglycemic episodes (dangerously low blood glucose levels) and hyperglycemia (elevated blood glucose levels), enhancing overall quality of life and mitigating diabetes-related complications.

Tracking and Monitoring with TITR

Using TIR involves continuous glucose monitoring (CGM) or frequent blood glucose measurements. The data is then analyzed to determine the percentage of time spent within the target range. Several approaches can be used to track TIR:

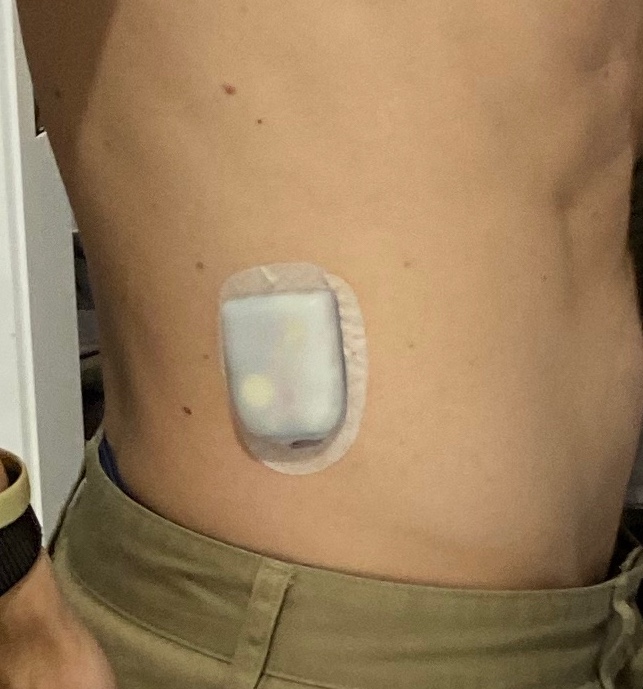
  1. CGM Devices: Advanced CGM devices automatically calculate and display TIR data, offering users real-time feedback on their glucose control.
  2. Data Logs: Patients and healthcare professionals can manually record blood glucose readings and calculate TIR using spreadsheets or dedicated apps.

TITR in Real-Life Scenarios

  1. Personalized Diabetes Management: TITR allows for a tailored approach to diabetes management. It helps healthcare professionals customize treatment plans and make timely adjustments to insulin dosing, diet, and exercise regimens.
  2. Pregnancy and Diabetes: During pregnancy, TITR is critical for expectant mothers with diabetes, as tight glucose control is vital for the health of both the mother and the baby.
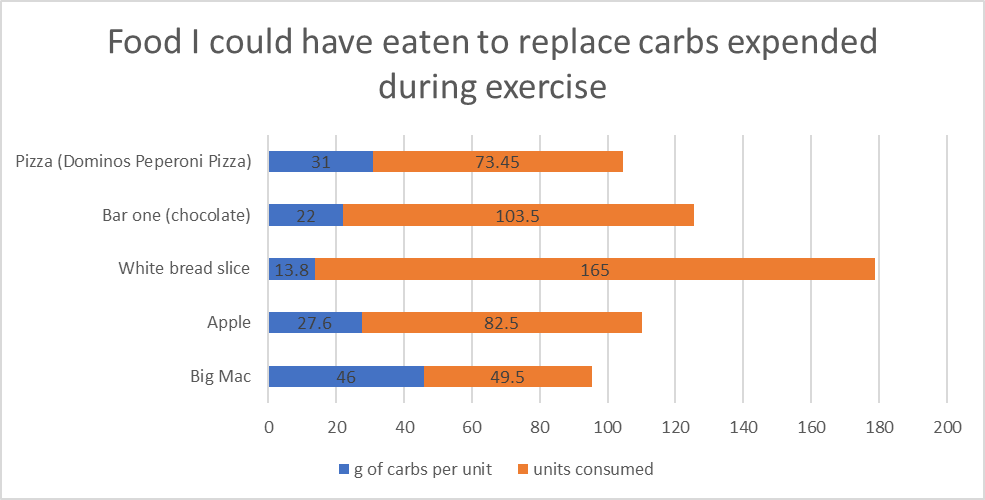
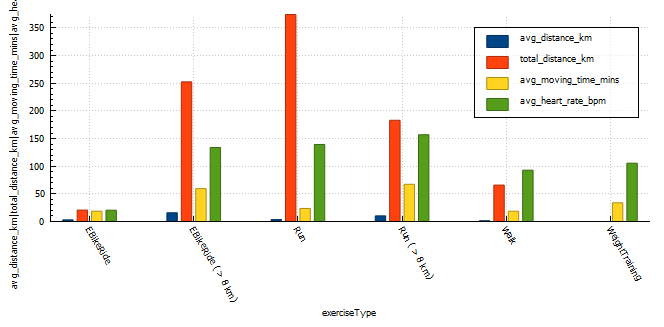
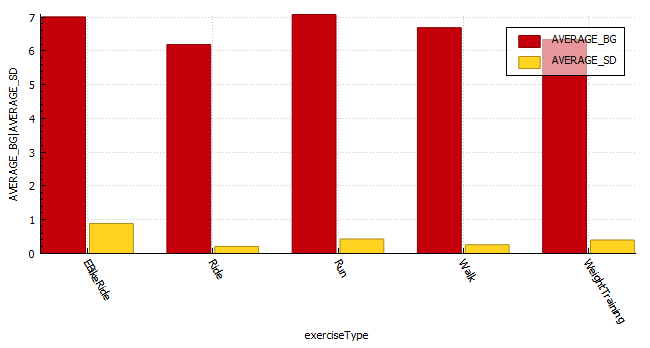
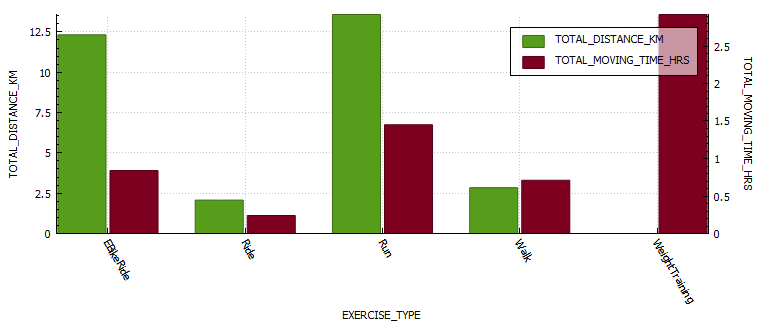
  3. Sports and Physical Activity: For athletes with diabetes, TITR provides insights into glucose fluctuations during physical activity, helping them optimize performance and avoid glucose-related issues during exercise.

Conclusion

Time in Tighter Range (TITR) is a valuable and dynamic metric that goes beyond traditional HbA1c measurements, providing real-time insights into daily glycemic patterns. With its ability to track fluctuations and trends within the target range, TITR empowers individuals and healthcare professionals to take proactive steps towards better diabetes management. By striving for optimal TITR, patients can enhance their quality of life, reduce the risk of complications, and achieve greater control over their diabetes. As TITR continues to gain prominence in diabetes care, it offers new possibilities for personalized and effective diabetes management strategies.

Impacts of Fitness on Diabetes Control

  1. Impact of Fitness on Type 1 Diabetes Management: a. Blood Sugar Control:
    • Regular exercise improves insulin sensitivity and enhances the body’s ability to utilize insulin effectively.
    • Physical activity helps to lower blood sugar levels during and after exercise by increasing glucose uptake by muscles.
    • It can reduce the amount of insulin needed for glucose management.

b. Glycemic Stability:

  • Engaging in regular physical activity helps promote more stable blood sugar levels throughout the day.
  • Consistent exercise routines can lead to better overall glycemic control and reduce the frequency of extreme highs and lows in blood sugar levels.

c. Cardiovascular Health:

  • Type 1 diabetes increases the risk of cardiovascular complications. Regular exercise can mitigate this risk by improving cardiovascular health.
  • Aerobic activities like walking, jogging, or cycling help strengthen the heart, lower blood pressure, and improve overall cardiovascular fitness.

d. Weight Management:

  • Maintaining a healthy weight is important for individuals with type 1 diabetes, as excess weight can make blood sugar management more challenging.
  • Regular physical activity helps manage weight by burning calories, building lean muscle mass, and improving metabolic function.

e. Mental Health and Well-being:

  • Regular exercise has a positive impact on mental health and overall well-being, which is crucial for individuals managing a chronic condition like type 1 diabetes.
  • Physical activity releases endorphins, reducing stress, anxiety, and depression often associated with diabetes management.
  1. Key Factors to Consider: a. Blood Sugar Monitoring:
    • Before, during, and after exercise, individuals with type 1 diabetes should regularly monitor their blood sugar levels to ensure they remain within a safe range.
    • Blood sugar levels may fluctuate during exercise, so it is essential to be prepared to adjust insulin dosages or carbohydrate intake accordingly.

b. Individualized Approach:

  • The impact of exercise on blood sugar levels can vary from person to person.
  • It is important for individuals with type 1 diabetes to work closely with their healthcare team to develop an exercise plan tailored to their specific needs, taking into account factors such as insulin regimens, meal timing, and personal fitness goals.

c. Hypoglycemia Prevention:

  • Exercise can sometimes cause hypoglycemia (low blood sugar) in individuals with type 1 diabetes.
  • Proper planning is crucial to prevent hypoglycemia during or after physical activity.
  • Adjustments in insulin dosages, meal/snack timing, and carbohydrate intake may be necessary to maintain blood sugar stability.

d. Hydration and Recovery:

  • Staying adequately hydrated before, during, and after exercise is important for individuals with type 1 diabetes to maintain overall health and prevent dehydration-related complications.
  • Proper recovery, including rest, nutrition, and adequate sleep, is crucial for optimizing the benefits of exercise and managing blood sugar levels effectively.

Conclusion: Fitness plays a significant role in the management of type 1 diabetes. Regular exercise can improve blood sugar control, promote glycemic stability, enhance cardiovascular health, support weight management, and positively impact mental well-being. It is essential for individuals with type 1 diabetes to work closely with their healthcare team, monitor blood sugar levels, and tailor their exercise routines to their specific needs to ensure safe and effective diabetes management.

Featured

2023 Half Marathon

It’s been a long-standing goal of mine to run a half marathon. It’s long enough to be a challenge, and short enough that I don’t need to be training all year round and can focus on my other sports.

Pre-requisites

Basal review – I will be doing an incremental basal review in the next few days (hopefully). Skipping meals where required.

Full profile review – Once the basal profile has been updated, I will check my CR (carb ratio) and CRR (carb rise ratio). No need to check ISF (insulin sensitivity factor) as its calculated in Android APS. I will need to be on the look out for blood sugar dips two or more hours after meals as I may need to reduce the Dynamic ISF Adjustment factor.

Injuries

At the moment I have an Achilles tendon issue I am in rehabilitating. It’s the first time I am experiencing this issue, so I am working with a Physio to remedy it.

Training Program

I plan on using the Garmin training program to do most of my training. My longest run prior to this was 16 km and I mountain bike so I think I may be ok with fitness if I can get back into training fairly quickly, but this is dependent on how well my current rehab program works.

This will be updated as and when I can, but the next 3 three (3) weeks are as follows:

Tendon Rehab Program:

WeekMondayTuesdayWednesdayThursdayFridaySaturdaySunday
1Calf raise holds 5 x 45 seconds, Gym3km run,
double leg calf raise x 3 12-15, body weight single leg calf raise 3 x 10-15
Calf raise holds 5 x 45 seconds, GymCalf raise holds 5 x 45 seconds, Gym3km run in AM,
double leg calf raise x 3 12-15, body weight single leg calf raise 3 x 10-15
Calf raise holds 5 x 45 seconds, GymBike in AM
2Calf raise holds 5 x 45 seconds, Gym4-5 kmCalf raise holds 5 x 45 seconds, GymCalf raise holds 5 x 45 seconds, Gym4-5 kmCalf raise holds 5 x 45 seconds, GymBike in AM
3Calf raise holds 5 x 45 seconds, Gym5-7kmCalf raise holds 5 x 45 seconds, GymCalf raise holds 5 x 45 seconds, Gym5-7kmCalf raise holds 5 x 45 seconds, GymBike in AM

NOTES: If pain/stiffness gets progressively worse, then reduce load and re-assess. If not monitor and keep working.

Strava Running Program:

I had really wanted to use the Garmin program, but I was too late to start it. The Strava program doesn’t seem to have the ability to select the days I plan on running or feedback on training progress at a granular level. My desired routine is 3 days per week.

Garmin Running:

Global Triathlon Network (GTN) half marathon training program

I really liked the plan from GTN, I have modified it a little to fit within my availability.

Training Progress

I will add a table to the weekly updates with progress on my training plans.

Diet / Food

I plan on sticking to my diet as much as possible. I will however cut back on alcohol and focus on drinking more water.

Supplements

Vitamin B – https://www.healthline.com/health/food-nutrition/vitamin-b-complex#benefits

Alpha lipoic acid – https://www.healthline.com/nutrition/alpha-lipoic-acid

Omega 3 – https://www.healthline.com/nutrition/17-health-benefits-of-omega-3

Vitamin D – https://www.healthline.com/health/food-nutrition/benefits-vitamin-d

Gear

Shoes: New Balance 1080, Fresh Foam More v3, Brooks Ghost

Watch: Garmin Fenix 7

Hydration vest: Osprey Duro 6 hydration vest

APS Hardware: Cubot King Kong Mini 2 Pro

Artificial Pancreas System: Android APS / Branch: Dev (Dynamic ISF)

Pump: Mixture of Omnipod and Accu-Check Combo

Insulin: Fiasp

Insulin Peak: 55 minutes

DIA: 9 hours

Glucose statistics

Measurements

Weight: 75km (afternoon)

Waist: 88cm

Body fat (estimate):

Updates (Weekly)

I will try and update the blog weekly with progress.

Featured

Analysing 2022 exercise data from AAPS

Disclaimer: The information contained within this blog post are my thoughts and do not constitute medical advice. Please consult your medical team before making any changes to your diet or blood sugar management program.

So far 2022 has been quite the year. With the return to my work offices Its been rather difficult to reach many of the goals I set myself, but I did make progress. It seems 2023 is set to be a particular difficult year, but perhaps this will be the inspiration I need to make some positive changes. The Python scripts I wrote to export data from Nightscout to create my mountain bike videos seem to be working well and I can’t wait to make a few more videos.

I was curious to see if there were any differences in insulin sensitivity between longer and shorter activity durations, as well as higher intensity (where average heart rate was more than 80% of max heart rate) training and it seemed there was, it just wasn’t what I was expecting.

My average total daily dose (TDD) for 2022 was 32.9 units per day. If we analyse my aerobic activity (ride and runs) for the year and we use my sensitivity ratio from AAPS for 24 hours post exercise, I calculate that I saved 256 units of insulin in 2022 through exercise due to increased insulin sensitivity. During aerobic activity I consume 12g of carbs on average per 30 mins of activity unless I am exercising fasted. I can use this input to calculate that I ate 2277g of carbs during 2022. I would need 311 units of insulin to absorb 2277g of carbs. Since I don’t add carbs to AAPS while exercising I don’t have the exact numbers but I do believe this calculation to be pretty accurate. That equates to 49 Big Mac burgers / 82 Apples / 73 slices of Dominos peperoni pizza that I got to eat without insulin as a direct result of exercise.

Exercise metrics

Analysing my exercise metrics I found that I was spending way too much time exercising at more than 75% of heart rate max, this would be hampering performance and building endurance. I did eighteen (18) runs at a distance greater than 8km, an improvement over the two (2) I did in 2021. I also managed my longest run ever at 16km.

exercise typeexercise counttotal distance (km)average distance (km)average moving time (minutes)average heart rate (bpm)
EBikeRide720.642.9518.65N/A
EBikeRide ( > 8 km)17252.415.759.4133.8 (72% max HR)
Run108374.253.4723.5139.26 (75% max HR)
Run ( > 8 km)18183.110.167156 (85% max HR)
Walk4865.81.3718.693 (50% max HR)
WeightTraining650.0033.77105 (57% max HR)
TOTAL2628965.636125 (68% max HR)
Exercise stats table for 2022

Time-in-range (TIR)

The longer distance running seem to result in the best time-in-range (TIR) (3.9-7.8 mmol/l) but I do feel that these runs also seem to happen at a similar time in the morning where I have more control over insulin-on-board (IOB) and carbs-on-board (COB) and I am the most resistant to insulin. My heart rate is also far more consistent (aerobic) during running than when mountain biking ( aerobic / anaerobic ).

If I start digging into the data for short runs more closely I find that;

  • TIR (3.9-7.8 mmol/l) from 04:00am – 10:00am is 63%
  • TIR (3.9-7.8 mmol/l) from 10:00am – 13:00pm is 83%
  • TIR (3.9-7.8 mmol/l) after 13:00pm is only 23%
exercise typeexercise counttime-in-range (%)
EBikeRide781.67
EBikeRide ( > 8 km)1665.56
Run10856.8
Run (04:00 – 10:00 am)1863.8
Run (10:00 – 13:00 pm)6183.6
Run (13:00 – 10:00pm)2923.02
Run ( > 8 km)1893.6
Walk4575.8
WeightTraining6587.7
Exercise time-in-range table for 2022

Blood glucose control metrics

The exercise that resulted in the lowest blood glucose fluctuations is walking with a CV of 4%. The exercise with the second lowest CS was weight training. I generally try to train with a little insulin-on-board to counteract the hormones released during training and I don’t need to set a high temp target in the lead-up to the activity, thus my reading is much lower at exercise commencement. The third lowest is short runs (< 8km) with CV of 6%. The higher blood glucose average will be a direct result of me setting a higher temp target (8 mmol/l) prior to exercising, but the duration of activity isn’t long enough to reduce the blood glucose substantially resulting in the high average. Long runs seem to result in the least stable blood glucose values with a CV of 12% but the average for long runs is lower as the sustained activity reduces blood glucose. I suppose on these longer runs I do consume a minimum of 30g of ultra-fast acting carbs (glucose, dextrose) which is going to result in some fluctuations in blood glucose.

With coefficient of the variation (CV) a lower percentage is indicative of more stable blood glucose readings.

exercise typeexercise countaverage standard deviationaverage blood glucoseaverage coefficient of the variation (CV)
EBikeRide70.577.498%
EBikeRide ( > 8 km)160.9210.69%
Run1080.437.196%
Run ( > 8 km)180.696.2411%
Walk480.276.774%
WeightTraining650.46.396%
Exercise breakdown for 2022

Insulin sensitivity

A very interesting observation was that longer, more intense activity resulted in sensitivity returning to normal quicker than less intense or shorter activity. Runs shorter than 8km resulted in a massive 12% insulin reduction for 24 hours post activity, that’s around 6.5 units less insulin in a 24 hour period. Long E-Bike rides resulted in the largest increase (35%) in sensitivity 1 hour post activity, with shorter E-Bike rides the second largest increase in sensitivity. Runs longer than 8 km increased sensitivity (25%) the third most, but the body seemed to return to normal more quickly than the shorter runs and was almost back to normal within 12 hours of activity.

(NOTE: I can’t comment on the validity of the results, only that patterns exist after exercise that are not usually observed in the absence of aforementioned exercise.)

average insulin sensitivity
exercise typeexercise count1 hr post exercise3 hr post exercise6 hr post exercise8 hr post exercise12 hr post exercise24 hr post exercise
EBikeRide71091051031029995
EBikeRide ( > 8 km)16687888939779
Run1088692959610298
Run ( > 8 km)18768092949794
Walk48105109111112114109
WeightTraining6595101100106110104
Average insulin sensitivity for multiple time blocks post exercise grouped by exercise type.

Profile Adjustments vs. Temporary Targets (TT)

In the past I used a combination of a 30% reduction in profile and a temporary target of 7 mmol/l while exercising.

This seemed to work quite well, with the caveat that profile adjustments can result in your autosens data being reset if you cancel the adjustment earlier than set.

One way to combat this is to set a higher temp target, this will not effect sensitivity data and can be cancelled at any time without needing to update the basal insulin profile in the pump of effecting autosense data. In order to do this I analysed the adjustments I was using to calculate a temp target that should reduce my insulin enough to keep me in range for the duration of activity.

TargetTemp_TargetInsulin % reducedActual % of profile30% Reduction20% ReductionNote
5.3851%49%This resulted in quite a few low blood sugars
5.38.560%40%2023 backup temp target strategy
5.38.357%43%2023 temp target strategy.
5.37.542%58%28.5%38.5%
5.57.027%73%42.7%52.7%Strategy in early in 2022

Thank you for reading 🙂

Featured

Diabetes awareness month and Android APS

14/11/2022

Introduction

It’s diabetes awareness month and so I wanted to talk to you about something I am very passionate about, Android artificial pancreas system (AAPS). It’s not the cure I wanted but as far as I am concerned, it’s the closest to normal I have felt in the 25 years I have been a diabetic.

Why I LOVE Android APS

I decided to try Android APS just prior to the birth of my daughter. At the time I was using multiple daily injections (MDI) on a low-carb diet (less than 45g per day excluding protein and fat) and trying to pick up some muscle. I found it rather challenging to eat the number of carbs the trainer suggested without compromising control. I was also anticipating the late nights having a baby entails and I wanted to be prepared. David Burren’s blog provided a blueprint of what could be expected if I committed to investing the time required to perform all necessary testing and fine-tuning.

Benefits of Android APS

  • Meal management
    • Meals can be managed through a number of mechanisms including;
      • Un-announced meals (UAM) – AAPS boluses insulin without intervention or carb entry.
      • Announcing carbs – Add the carbs into the system and the calculator estimates the amount of insulin required based on your COB, IOB, ISF, current blood glucose, blood glucose deltas, and insulin sensitivity.
      • Extended carbs – typically used to mimic the absorption of protein (gluconeogenesis) or delayed gastric emptying caused by high-fat meals.
  • Exercise management
    • Insulin scaling adjusts basal insulin based on current insulin sensitivity
    • Automations allow you to schedule profile changes and temporary blood sugar targets for the duration of activity or condition.
  • Hardware / pumps / wearables
    • Functional on many old and new low-cost Android phones
    • Directly or indirectly (via Nightscout) display various blood glucose-related data on compatible watches. If you are using an Android watch (WearOS) you can control AAPS via the watch. Garmin watches can display blood glucose data during an activity.
    • Control a wide variety of pumps
    • Utilise the blood glucose data from a wide variety of CGMs (continuous glucose monitors)
  • Software
    • Automations allow you to automate system actions based on conditions (eg. blood glucose increasing, blood glucose decreasing, leaving for work, pump disconnect) or schedules.
    • SMS Commands to control AAPS remotely
    • Super micro boluses / boli (SMBs) allow AAPS to provide insulin efficiently and effectively.
    • The system will suspend insulin delivery when blood sugar is predicted to go below a certain threshold.
    • Highly customizable to your unique needs, with certain advanced builds allowing you to control more system variables (Boost, AIMI, Eating Now).
    • Cutting-edge development
      • Dynamic insulin sensitivity factor (ISF that changes based on blood glucose)
      • Improved prediction models
      • Improved insulin modeling (9-hour DIA)
  • Quality of Life
    • Reduced diabetic burden and stress.
    • Glucose is constantly monitored, with the ability for someone to follow you remotely, including community members. This can assist with fine-tuning settings.
    • Ability to eat more foods without compromising control
    • Improved glucose control reduces the possibility of long-term complications.
  • Safety
    • Objectives provide a level of safety as users need to understand basic principles of how to use the APS prior to closing the loop.
  • Cost
    • AAPS is open-source and free to use.
  • Monitoring / Reporting

Dis-benefits of Android APS

  • DIY Software build
    • As with all DIY systems, you are required to build the application prior to using it.
  • Cost of hardware
    • Phone
    • CGM
    • Pump and supplies
  • Connectivity fatigue
    • The burden of being connected to technology 24/7
  • Reliance
    • It is easy to become reliant on AAPS managing blood sugars.
  • Usability
    • Due to its complexity, you are required to invest a large amount of time in order to gain the understanding and skills required to configure and utilise it correctly.

Statistics and examples:

Nightscout statistics – 3 Months

Nightscout blood glucose distribution report
Nightscout blood glucose weekly distribution report

Control stats for different systems

Date Started TestControl Mechanisme-A1CAverage Blood GlucoseTime In Range (TIR) 3.9 – 10Standard DeviationAverage carbs consumedGVIPGSCGP – PGR
20/11/2019MDI6.1%7 mmol/l87%2.2 mmol/l1.220.331.7
20/11/2020MDI5.6%6.3 mmol/l94%1.7 mmol/l< 601.178.671.3
20/11/2021Loop5.7%6.5 mmol/l94%1.7 mmol/l<100 (carb counting)1.258.291.3
04/02/2022Android APS5.7%6.5 mmol/l96%1.5 mmol/l>200, little to no carb counting1.245.701.2
Analysis stats provided by Nightscout reporter.
Comprehensive glucose pentagon from Nightscout reporter report.

Un-announced meal (UAM) example

Low-carb meal with UAM running (Low-carb bread with cheese, ham, and mayo.)

Extract from Android APS data for a low carb meal

As can be seen above the system manages low-carb meals quite well with no carb inputs from the user. The system constantly monitors for rapid changes in blood sugars and administers insulin when required to quickly brings sugars into range.

Nightscout screenshot of low carb meal being absorbed while AAPS manages sugars.

Exercise stats / examples

YearAverage Time in Range (3.9-7.8 mmol/l)Average blood glucose (mmol/l)Average Standard Deviation (mmol/l)Total HoursTotal KM
202280.1 %6.60.43 131885
202171.9 %6.7 0.4149920
202069.7 %6.9 0.767658
Annual improvements are made through tweaking system variables and my approach to exercise.
Weight Training
DateIOB @ startMoving timeExercise TypeAverage HR (bpm)Standard Deviation (mmol/l)CGM BG StartCGM BG EndCGM BG Average (mmol/l)TIR (3.9-10)
2022-10-070.1436.93WeightTraining101.10.3657.76.87.27100.0%
EBike Ride
Android APS data exported during an E-Bike Ride 2022-11-06.
DateIOB @ startMoving timeExercise TypeDistance (km)Average HR (bpm)Standard Deviation (mmol\l)CGM BG StartCGM BG EndCGM BG Average (mmol\)TIR (3.9-10)
2022-11-06-0.849115.92eBikeRide271431.0955.95.87.16100%
Running
Android APS data exported during a run 2022-10-03.
DateIOB @ startMoving timeExercise TypeDistance (km)Average HR (bpm)Standard Deviation (mmol\l)CGM BG StartCGM BG EndCGM BG Average (mmol\)TIR (3.9-10)
2022-10-03-0.53478Run12 1681.1055.55.16.75100%
Featured

Thirty day challenge – week 4

Summary

This week was the best so far. I did my longest run to date (12km) and had a really good gym week lifting (approx. 20% more volume). My diabetes control is improving (thank you AAPS and exercise) and I have learned a lot digging though my data and through responses from the previous weeks question regarding carb sensitivity factor (CSF) being used to measure insulin sensitivity post exercise. I made some strides in my glucose management tool which also felt great.

BG vs. ISF vs. insulin sensitivity post gym (@11:48:09 – 42min)
BG vs. ISF vs. insulin sensitivity post run (@11:49:30 – 33min)

After gym sensitivity increased to 115% directly post training, while my sensitivity was stable at 78% post my run.

Body Metrics

Body mass vs. body fat
StartWeek 1Week 2Week 3Week 4
Weight (kilograms)75.8747574.173.1
Body fat percentage (according to Samsung)17.3%17.8**
Body fat percentage (according to the navy seal calculator)15%15%14.8%14%
Total volume
Table stating the weekly body metrics I am tracking.

Exercise

Week 1Week 2Week 3Week 4
Distance (kilometres)25.1720.5437.2229.4
Activity (hours)4.343.655.645.4
Table stating the weekly exercise metrics I am tracking

Nutrition

Screenshot of average macro-nutrients consumed during week 4

Diabetes

Week 1Week 2Week 3Week 4
Low (<3.9) (%)0.90.63.51.6
In Range (3.9-7.8) (%)75.374.771.978.9
High (>= 7.8) (%)23.824.724.619.5
Standard deviation (SD) 1.31.71.71.5
Average (mmol/l)6.87.0 6.7 6.5
A1c estimation (%)5.96.05.85.7
Table stating the weekly diabetic metrics I am tracking.

Ideally I want to see a time-in-range (TIR – 3.9-7.8 mmol/l) exceeding 90% with an average in the low sixes and a standard deviation (SD) around one (1).

Featured

Thirty day challenge – week 3

Summary

I am starting to feel like a routine is forming, perhaps not around diet yet, but definitely in regards to training. In previous years of doing this I was eating clean most days, as it provided improved diabetic control in the absence of an APS/AID and pump.

This week was particularly heavy due to my birthday dinner, a new phone, a new version of AAPS (Boost test platform 3.6.5) and a 25 km cycle. *I have been unable to pair my galaxy watch with my new phone, which is sad as I really liked the watch and having the plethora of sensors.

I was investigating the possibility of measuring insulin sensitivity changes in AAPS . One way would be to use the autosens feature in AAPS , but since I wasn’t including the carbs I ate to fix hypos, and I was snacking in-between to keep my readings steady that wasn’t going to work. The only metric that may prove useful may be my carb sensitivity factor (CSF). The average CSF over the 22 days so far is 8.7 while the average sensitivity ratio was 106%. This would mean that according to CSF I was 36% more sensitive to carbs yesterday or 29% less sensitive according to autosens.

Body Metrics

StartWeek 1Week 2Week 3Week 4
Weight (kilograms)75.8747574.1
Body fat percentage (according to Samsung)17.3%17.8*
Body fat percentage (according to the navy seal calculator)15%15%14.8%
Total volume
Table stating the weekly body metrics I am tracking.

Exercise

Week 1Week 2Week 3Week 4
Distance (kilometres)25.1720.5437.22
Activity (hours)4.343.655.64
Table stating the weekly exercise metrics I am tracking

Nutrition

Screenshot of average macro-nutrients consumed during week 3

Diabetes

Week 1Week 2Week 3Week 4
Low (<3.9) (%)0.90.63.5
In Range (3.9-7.8) (%)75.374.771.9
High (>= 7.8) (%)23.824.724.6
Standard deviation (SD) 1.31.71.7
Average (mmol/l)6.87.0 6.7
A1c estimation (%)5.96.05.8
Table stating the weekly diabetic metrics I am tracking.

Ideally I want to see a time-in-range (TIR – 3.9-7.8 mmol/l) exceeding 90% with an average in the low sixes and a standard deviation (SD) around one (1).

Featured

Thirty day challenge – Week 1

Summary

The first week was challenging to say the least. As I have increased my physical activity my insulin needs seem to have fundamentally changed, and this resulted in quite a few lows. I also had some tech issues, my Android phone had an operating system error and my Dexcom sensor wasn’t enjoying the resistance training I was doing as it was inserted in my arm. I reached my activity goals but exceeded my diabetic and nutritional goals.

Body Metrics

StartWeek 1Week 2Week 3Week 4
Weight (kilograms)75.874
Body fat percentage (according to Samsung)17.3%
Body fat percentage (according to the navy seal calculator)15%
Total volume
Table stating the weekly body metrics I am tracking.

Exercise

Week 1Week 2Week 3Week 4
Distance (kilometres)25.17
Activity (hours)6.24
Table stating the weekly exercise metrics I am tracking
Week 1 breakdown

Nutrition

Screenshot of the average and total macronutrients consumed during week 1.
Screenshot of average macronutrient consumed during week 1

Diabetes

Ideally I want to see a time-in-range (TIR – 3.9-7.8 mmol/l) exceeding 90% with an average in the low sixes and a standard deviation (SD) around one (1).

Featured

Thirty day challenge

It’s spring, and after a brief ‘almost two months’ of going off the reservation snacking at all times of day and barely exercising, I decided to check my weight. I discovered I had picked up a few kilograms since my last weigh in. After learning this, I decided that it was time for me to get my life back together and start another 30 day challenge. I find these great to provide the reason to get back into a routine.

I know that setting unrealistic goals (like losing 5kgs) isn’t going to work, so I’m going to break down my plan in to nutrition, exercise and diabetes goals.

Exercise

My plan for the month is to gym three days a week, run a minimum of 2 times per week and to mountain bike at least once a week. (So I guess I lied about setting unrealistic goals 🙂 )

Nutrition

For my meals I plan to stick to my usual low-ish carbohydrate meals during the week and try to only go coo-coo bananas on the late night snacking over the weekend. I’ll start carb-counting again as this will almost always yield the best results. This will be supplemented with 2-3 liters of water, depending on length of cardio that day.

Diabetes

Above is a chart of my starting metrics. Lets see how quickly I can improve those values. Its going to be a little bit of an unfair test as I was not carb-counting during the above period.

We want to see the In range (Time-in-range) increase and the standard deviation decrease. By doing that the average and the A1c should follow. This will mostly be achieved by the diet component of the plan. The exercise component will allow me to eat more cabs and require less insulin, as well as improve circulation, sleep, blood pressure, mood, cholesterol, memory and overall mental and physical health.

I will check in with weekly updates to ensure I keep motivated and accountable.

Omnipod Dash – Summary – Week 1&2

Its only been a week and already I feel so comforted by the barely audible click of the pump depressing the plunger in the mini pump at meal times or sporadically throughout the day. Its the sound of blood sugar control. What a week its been learning all I can about Pod changes and being woken up on day 3 by the Pod alarm alerting me its 8 hours before the Pod expires. Once expired it was interesting to note that the Pod functioned as per normal, apparently for another 8 hours.

I had a Pod on days 3 and 4 that was inserted into my leg that may have had a cannula issue, as I struggled to maintain my standard level of control.

Its been a lot easier to exercise focusing on enjoying the task rather than if I would break the pump or rip out a cannula. Having no wires makes it a lot easier to run or gym as I don’t have to worry about pump placement as much. Previously I needed to ensure I had pants with pockets or a belt clip available.

I have also found sleeping a little easier, as I can barely notice the pump If I roll over onto it.

Flank insertion.
Boost Omnipod – Time in Range (3.9 -7.8 mmol/l)
Boost Omnipod – Time in Range (3.9 – 10 mmol/l)

Unannounced meals

I decided to test the system with unannounced meals consisting of 40g of carbs or less. I am a bit of a control freak when it comes to diabetes so I have been postponing testing this for a long time. The results were outstanding. I will be writing more about this in the future, including any automations I use or test.

Boost Omnipod – UAM – Time in Range (3.9 -7.8 mmol/l)

Boost Omnipod – UAM – Time in Range (3.9 – 10 mmol/l)