It’s been a long-standing goal of mine to run a half marathon. It’s long enough to be a challenge, and short enough that I don’t need to be training all year round and can focus on my other sports.
Pre-requisites
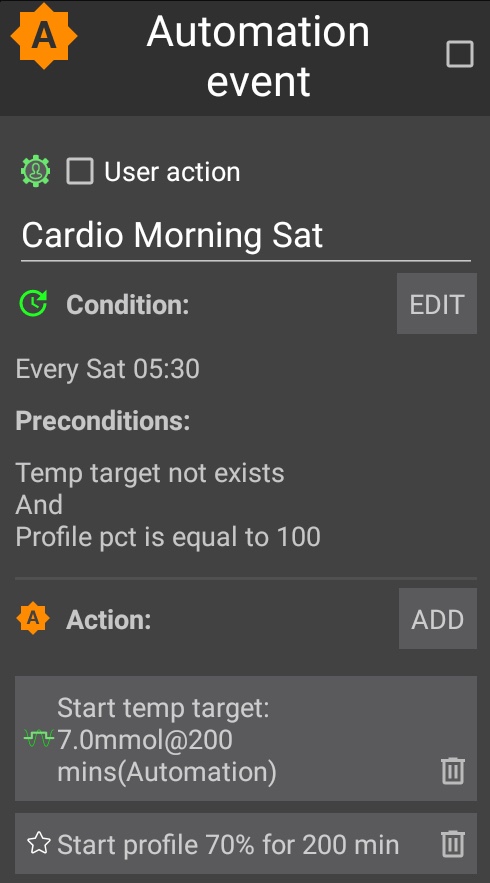
Basal review – I will be doing an incremental basal review in the next few days (hopefully). Skipping meals where required.
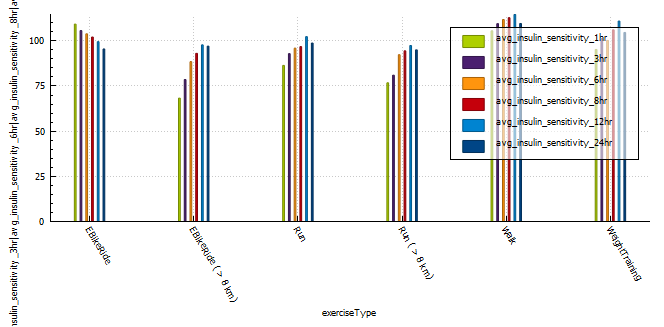
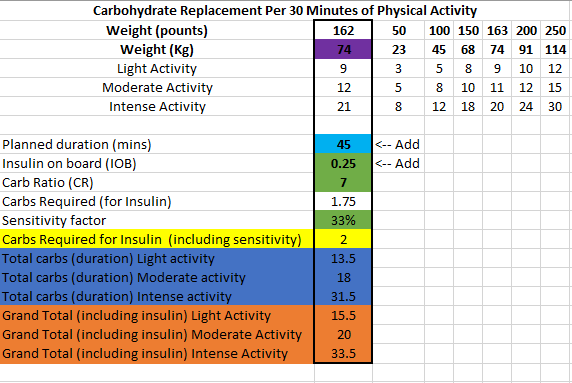
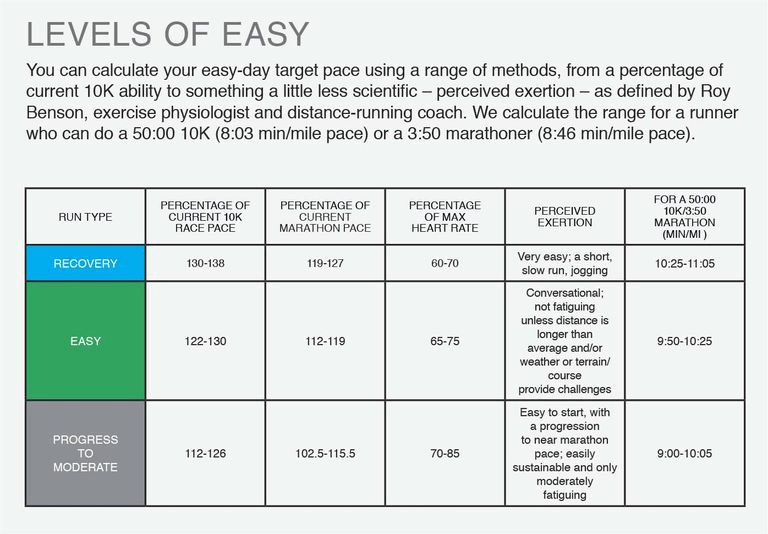
Full profile review – Once the basal profile has been updated, I will check my CR (carb ratio) and CRR (carb rise ratio). No need to check ISF (insulin sensitivity factor) as its calculated in Android APS. I will need to be on the look out for blood sugar dips two or more hours after meals as I may need to reduce the Dynamic ISF Adjustment factor.
Injuries
At the moment I have an Achilles tendon issue I am in rehabilitating. It’s the first time I am experiencing this issue, so I am working with a Physio to remedy it.
Training Program
I plan on using the Garmin training program to do most of my training. My longest run prior to this was 16 km and I mountain bike so I think I may be ok with fitness if I can get back into training fairly quickly, but this is dependent on how well my current rehab program works.
This will be updated as and when I can, but the next 3 three (3) weeks are as follows:
Tendon Rehab Program:
| Week | Monday | Tuesday | Wednesday | Thursday | Friday | Saturday | Sunday |
| 1 | Calf raise holds 5 x 45 seconds, Gym | 3km run, double leg calf raise x 3 12-15, body weight single leg calf raise 3 x 10-15 | Calf raise holds 5 x 45 seconds, Gym | Calf raise holds 5 x 45 seconds, Gym | 3km run in AM, double leg calf raise x 3 12-15, body weight single leg calf raise 3 x 10-15 | Calf raise holds 5 x 45 seconds, Gym | Bike in AM |
| 2 | Calf raise holds 5 x 45 seconds, Gym | 4-5 km | Calf raise holds 5 x 45 seconds, Gym | Calf raise holds 5 x 45 seconds, Gym | 4-5 km | Calf raise holds 5 x 45 seconds, Gym | Bike in AM |
| 3 | Calf raise holds 5 x 45 seconds, Gym | 5-7km | Calf raise holds 5 x 45 seconds, Gym | Calf raise holds 5 x 45 seconds, Gym | 5-7km | Calf raise holds 5 x 45 seconds, Gym | Bike in AM |
NOTES: If pain/stiffness gets progressively worse, then reduce load and re-assess. If not monitor and keep working.
Strava Running Program:
I had really wanted to use the Garmin program, but I was too late to start it. The Strava program doesn’t seem to have the ability to select the days I plan on running or feedback on training progress at a granular level. My desired routine is 3 days per week.


Garmin Running:
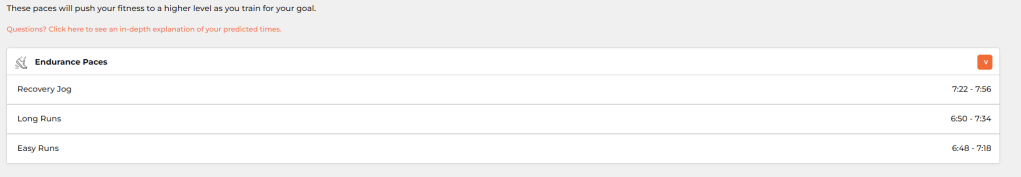
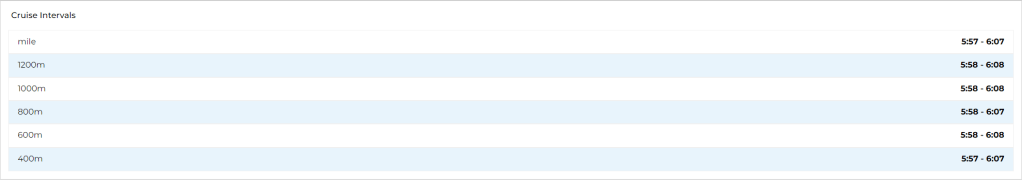
Global Triathlon Network (GTN) half marathon training program
I really liked the plan from GTN, I have modified it a little to fit within my availability.
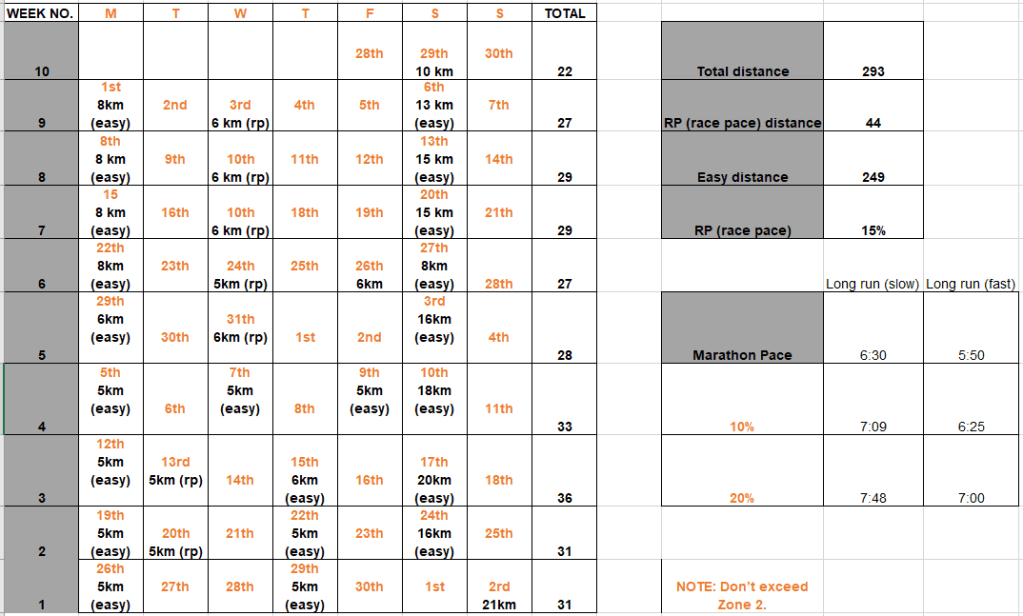
Training Progress
I will add a table to the weekly updates with progress on my training plans.
Diet / Food
I plan on sticking to my diet as much as possible. I will however cut back on alcohol and focus on drinking more water.
Supplements
Vitamin B – https://www.healthline.com/health/food-nutrition/vitamin-b-complex#benefits
Alpha lipoic acid – https://www.healthline.com/nutrition/alpha-lipoic-acid
Omega 3 – https://www.healthline.com/nutrition/17-health-benefits-of-omega-3
Vitamin D – https://www.healthline.com/health/food-nutrition/benefits-vitamin-d
Gear
Shoes: New Balance 1080, Fresh Foam More v3, Brooks Ghost
Watch: Garmin Fenix 7
Hydration vest: Osprey Duro 6 hydration vest
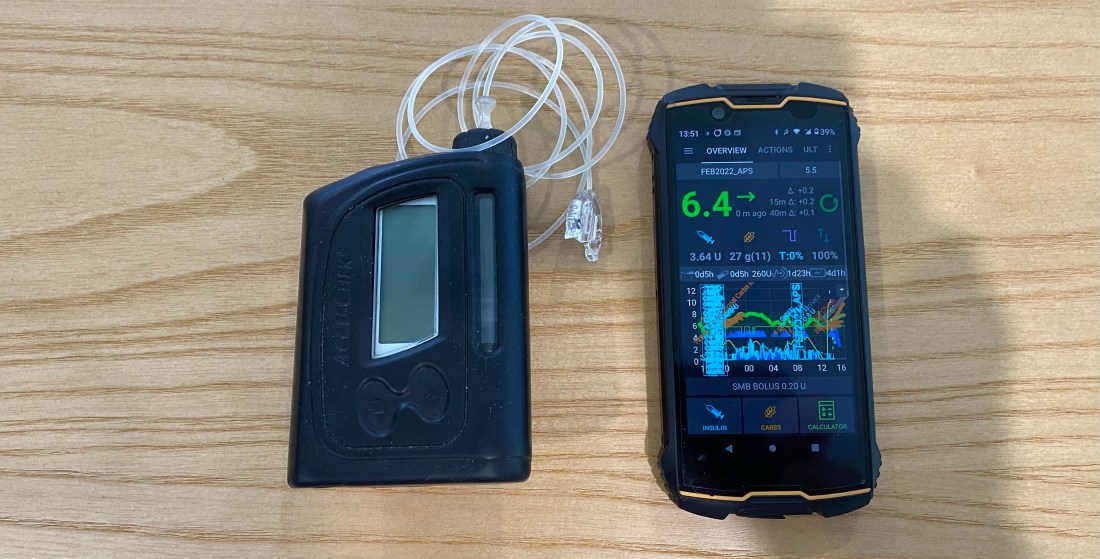
APS Hardware: Cubot King Kong Mini 2 Pro
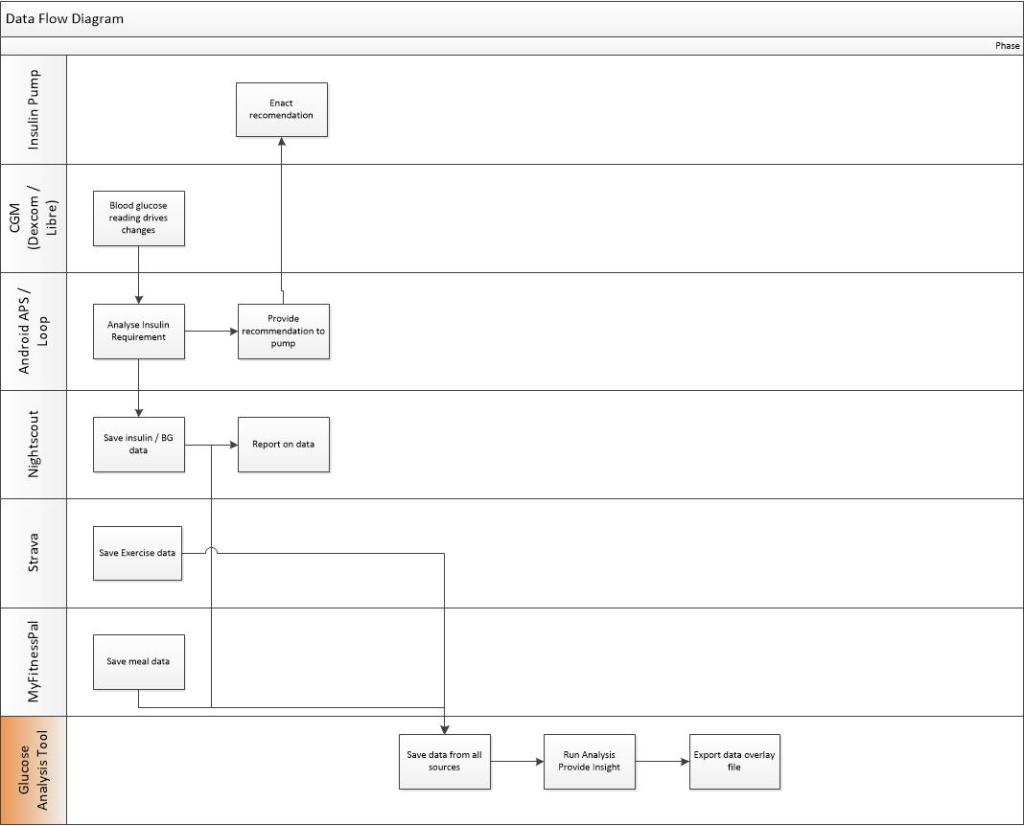
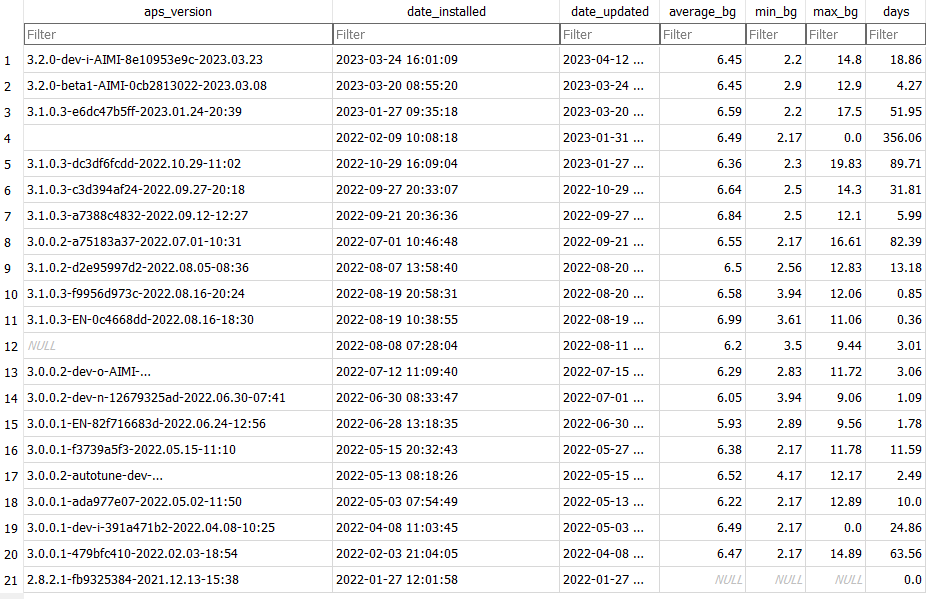
Artificial Pancreas System: Android APS / Branch: Dev (Dynamic ISF)
Pump: Mixture of Omnipod and Accu-Check Combo
Insulin: Fiasp
Insulin Peak: 55 minutes
DIA: 9 hours
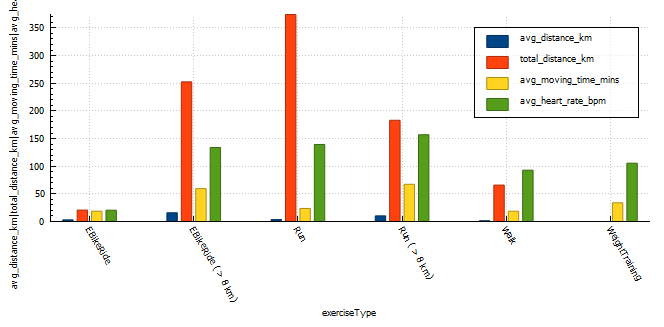
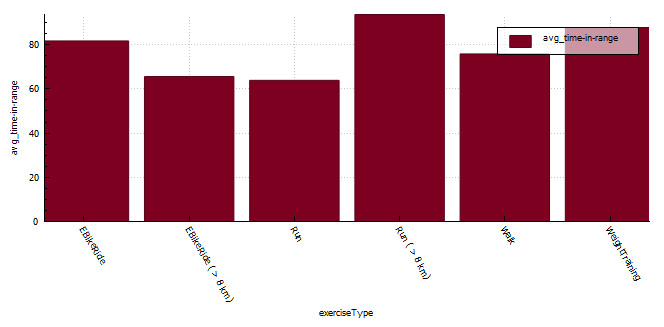
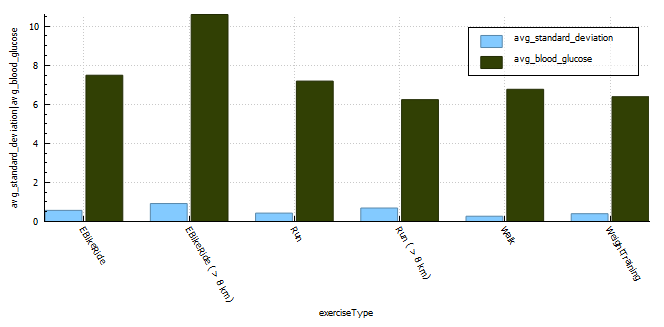
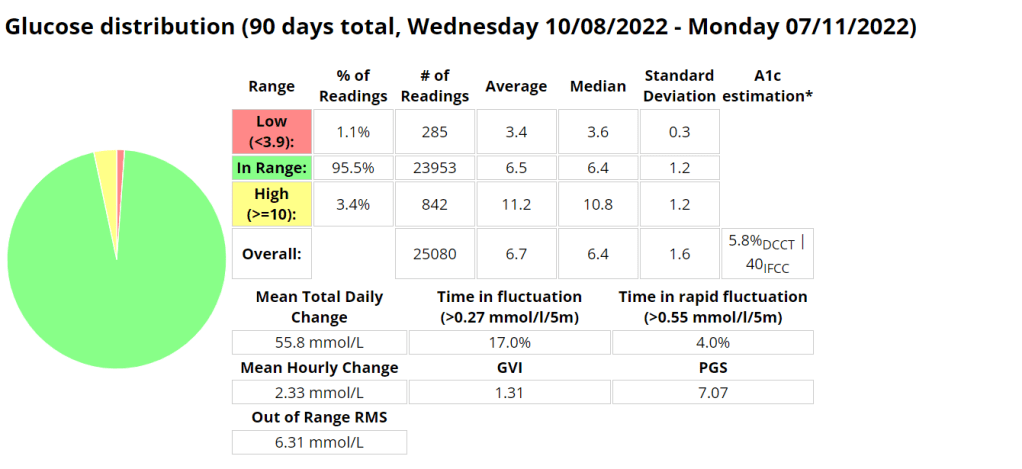
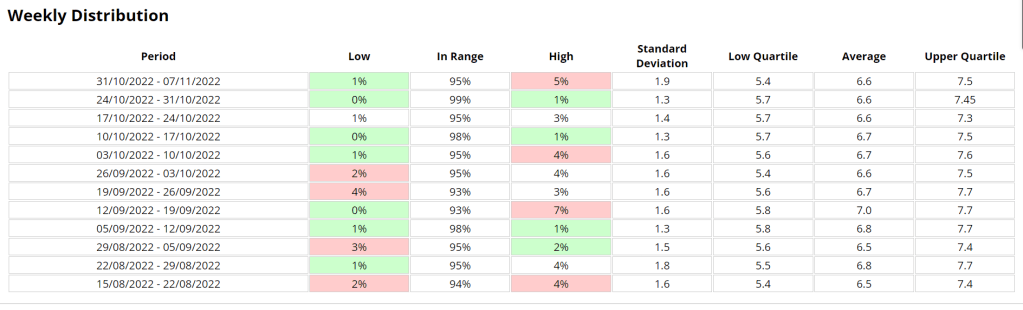
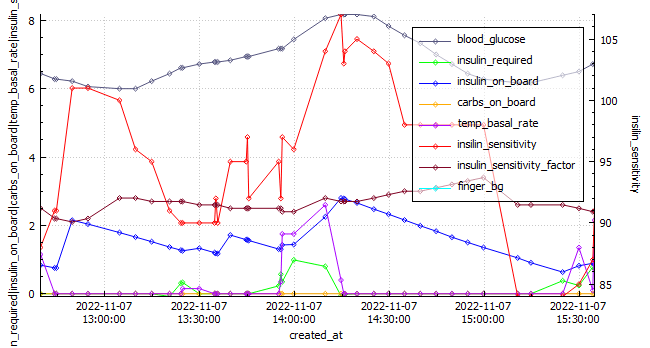
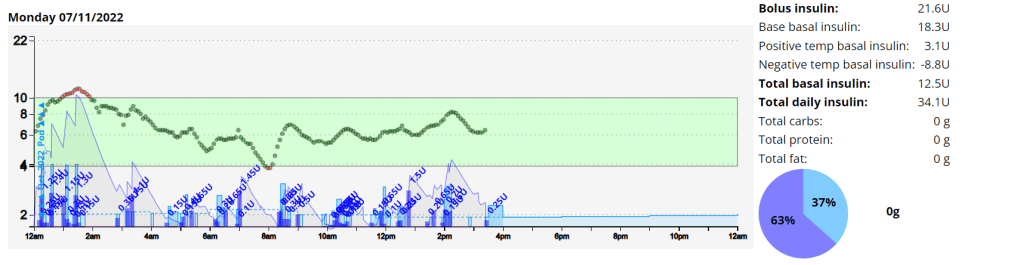
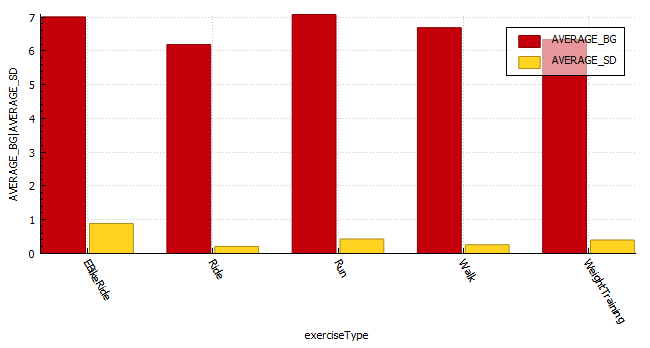
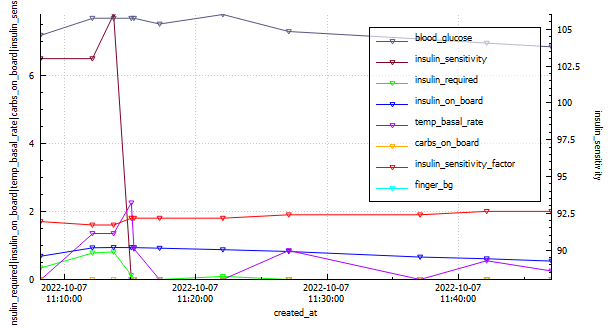
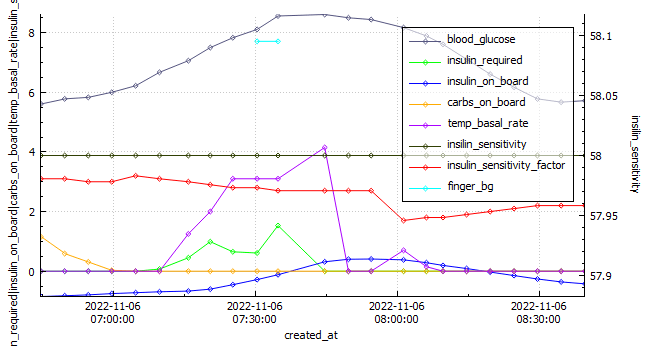
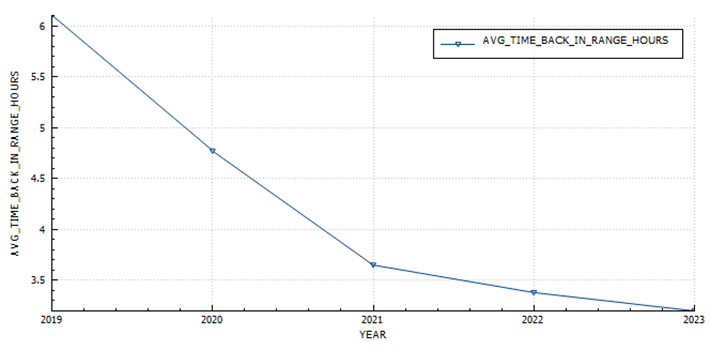
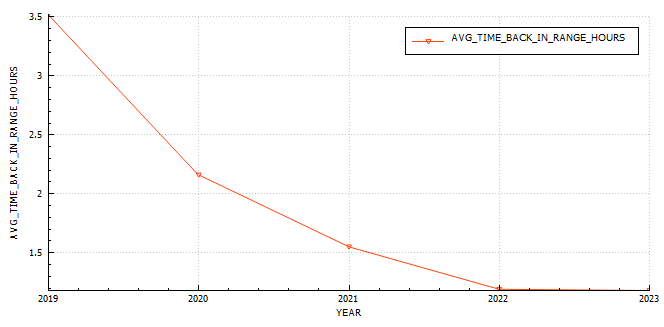
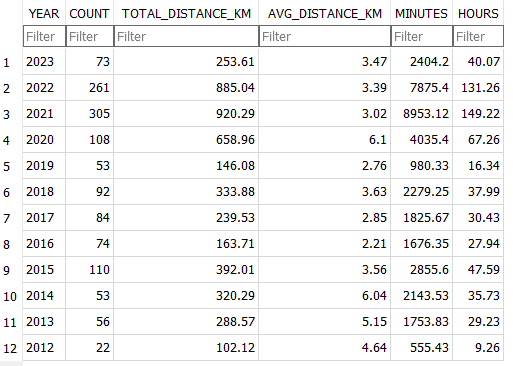
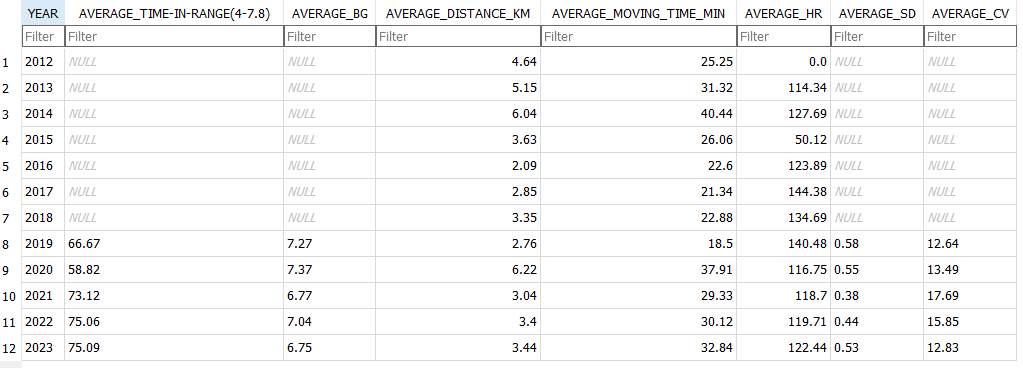
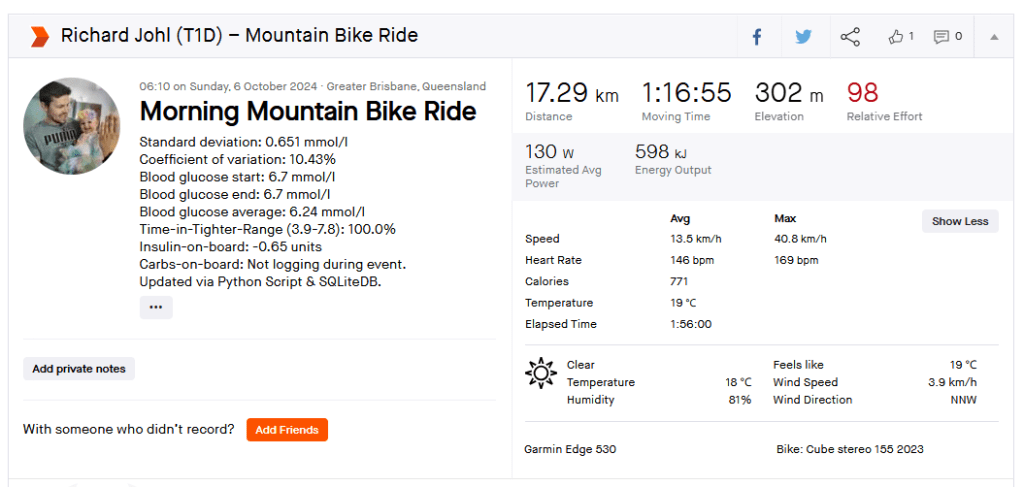
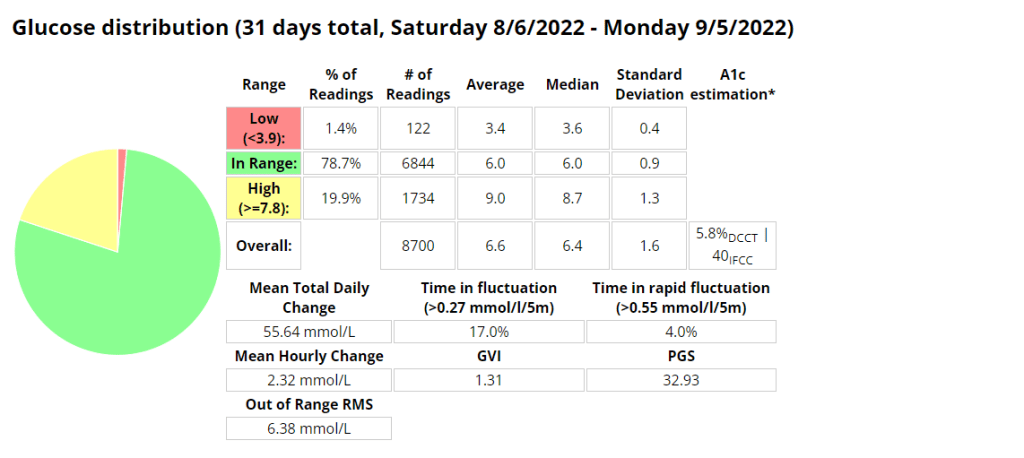
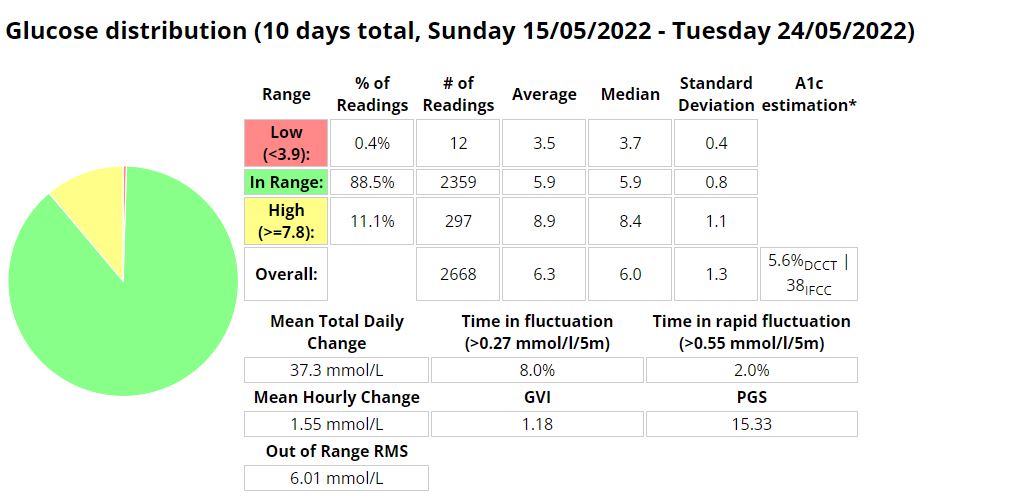
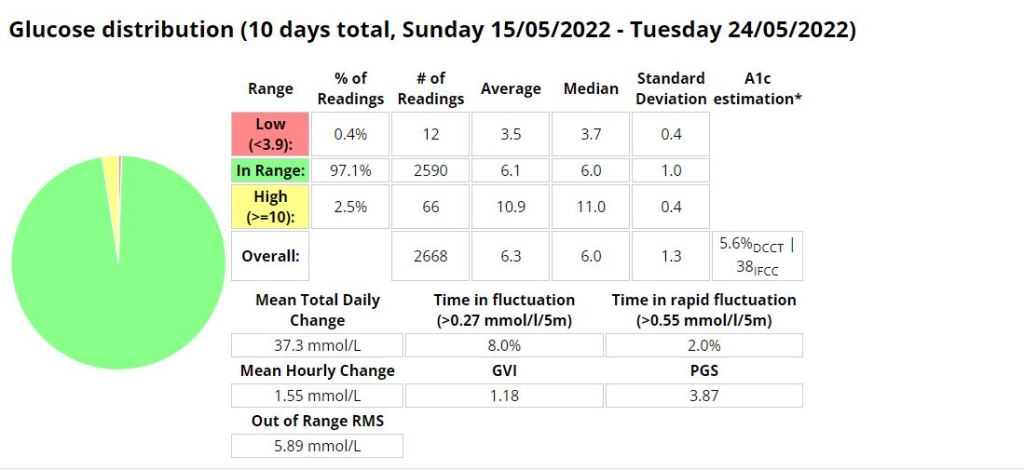
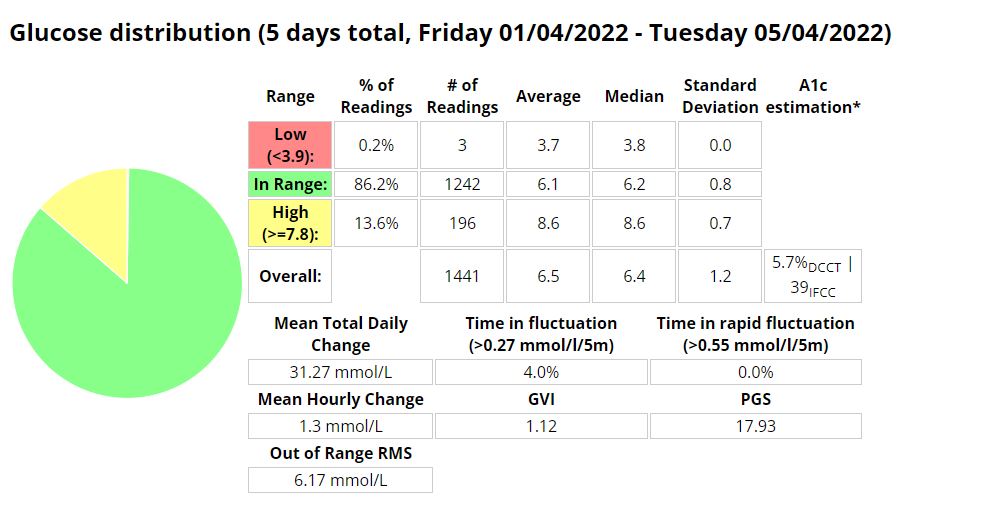
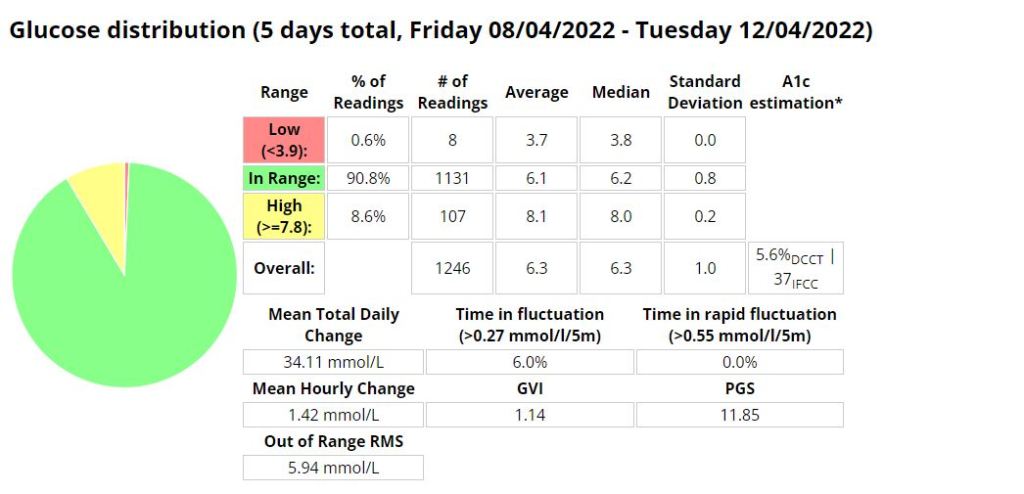
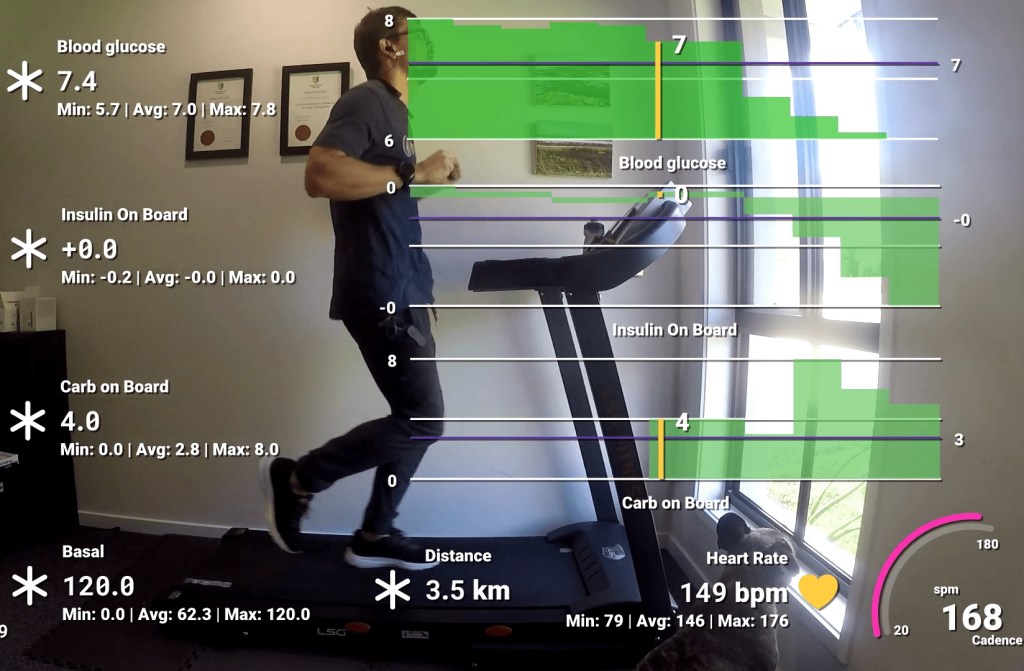
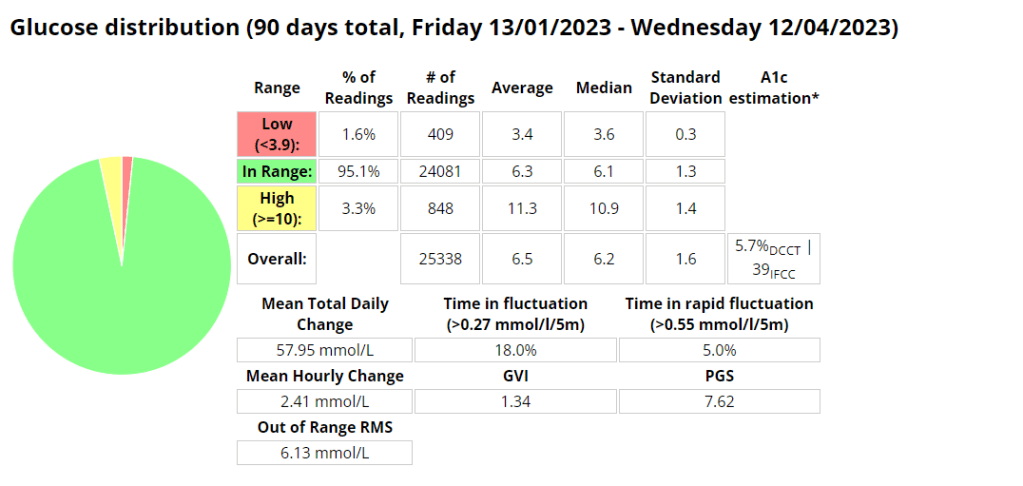
Glucose statistics
Measurements
Weight: 75km (afternoon)
Waist: 88cm
Body fat (estimate):
Updates (Weekly)
I will try and update the blog weekly with progress.