Glycemic Management Indicator (GMI)

The Glycemic Management Indicator (GMI) is an essential tool used to evaluate and monitor long-term glycemic control in individuals with diabetes. It is derived from continuous glucose monitoring (CGM) data or frequent fingerstick blood glucose measurements obtained over a specific period, typically ranging from two weeks to three months. GMI is considered an alternative to traditional HbA1c (glycated hemoglobin) measurements, offering a more comprehensive and insightful assessment of glucose management.

  1. Benefits of GMI Compared to HbA1c:

GMI provides several advantages over traditional HbA1c measurements:

a. Real-Time Data: Unlike HbA1c, which reflects an average of blood glucose levels over the past 2-3 months, GMI is based on current and recent glucose data. This real-time aspect allows for timely adjustments to diabetes management strategies.

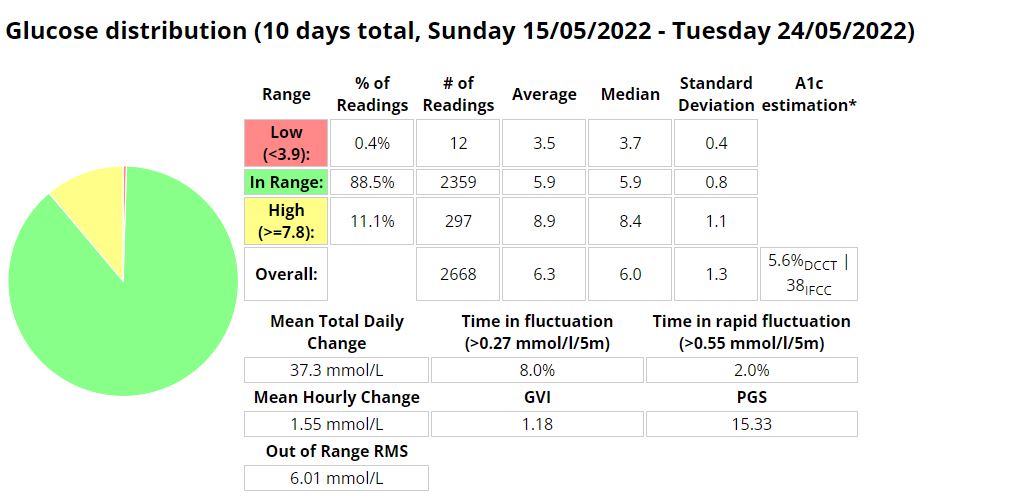
b. More Comprehensive: GMI incorporates a broader range of glucose data, capturing variations and fluctuations in glucose levels that HbA1c may not reveal. It considers both hyperglycemia and hypoglycemia, offering a more comprehensive view of glycemic control.

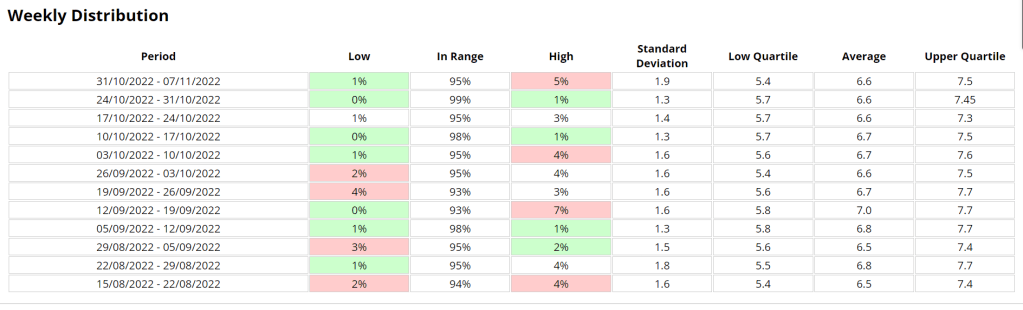
c. Better Glucose Trend Assessment: GMI can monitor trends in glucose levels, helping healthcare professionals and individuals with diabetes identify patterns and make targeted interventions to improve glycemic management.

  1. Examples of Using GMI for Glycemic Control Monitoring:a. Personalized Treatment Plans: GMI data enables healthcare professionals to tailor treatment plans to individual needs. For instance, if a person has a high GMI with frequent hyperglycemic excursions, treatment adjustments can be made to reduce these excursions and improve overall glycemic control.b. Predicting Hypoglycemia: GMI can help identify periods of increased risk for hypoglycemia, allowing patients to take preventive measures, such as adjusting insulin doses or modifying meal plans.c. Assessing Treatment Changes: When implementing changes in diabetes management, GMI can track the impact of those changes over time, providing valuable feedback on the effectiveness of the modifications.
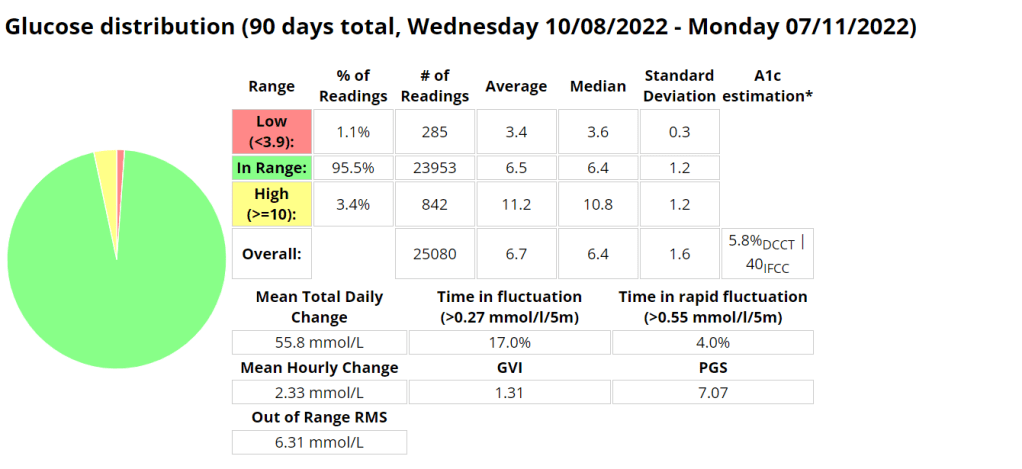
  2. Addressing Variations in GMI Calculation:The formula to calculate GMI is generally (Mean Glucose + 46.7) / 28.7. However, it’s essential to acknowledge that different devices, CGM systems, and methodologies might use alternative formulas or constants for GMI calculation. To obtain accurate and specific information on GMI calculation, users should refer to the guidelines and documentation provided by the manufacturer of the CGM device or the healthcare professional overseeing diabetes management. This ensures consistency and proper interpretation of GMI results.

In summary, GMI is a valuable tool in diabetes management, offering real-time insights and a more comprehensive assessment of glycemic control compared to traditional HbA1c measurements. By leveraging GMI data, healthcare professionals and individuals with diabetes can make informed decisions and take proactive steps to optimize diabetes management strategies.

Continuous Glucose Monitoring (CGM) vs. Traditional Blood Testing

06/06/2023

What is CGM?

Continuous glucose monitoring (CGM) is a technology that allows people with diabetes to track their blood sugar levels in real time. A CGM sensor is inserted under the skin and measures glucose levels in the interstitial fluid, which is the fluid that surrounds the cells. The sensor sends readings to a receiver or smartphone every few minutes, so you can see how your blood sugar levels are changing throughout the day.

What is traditional blood glucose testing?

Traditional blood glucose testing involves pricking your finger to draw a drop of blood, which is then applied to a test strip. The test strip is inserted into a blood glucose meter, which provides a reading of your blood sugar level. Traditional blood glucose testing is typically done several times a day, but it can be more frequent if you have diabetes that is not well controlled.

Advantages of CGM

CGM has several advantages over traditional blood glucose testing, including:

  • Real-time monitoring: CGM allows you to see your blood sugar levels changing throughout the day, which can help you make better decisions about insulin dosing and food choices.
  • More data: CGM provides more data about your blood sugar levels than traditional blood glucose testing. This data can be used to identify trends and patterns in your blood sugar levels, which can help you improve your diabetes management and has allowed for advances like Artificial pancreas systems (APS) to be created.
  • Less finger pricks: CGM can help you reduce the number of finger pricks you need to do each day. This can be helpful for people who have diabetes and are sensitive to pain.

Disadvantages of CGM

CGM also has some disadvantages, including:

  • Cost: CGM devices can be expensive, and the sensors need to be replaced every 7-10 days.
  • Accuracy: CGM sensors are not always accurate, and they can be affected by factors such as exercise, illness, and food.
  • Inconvenience: CGM sensors can be uncomfortable to wear, and they can be damaged if they are not properly cared for.

When to use CGM

CGM is a good option for people with diabetes who want to improve their diabetes management. It is especially helpful for people who:

  • Have frequent highs and lows
  • Have difficulty controlling their blood sugar levels with traditional blood glucose testing
  • Are at risk for hypoglycemia or hyperglycemia
  • Are pregnant

What happens when you are dehydrated or playing sports?

When you are dehydrated, your blood sugar levels can rise. This is because your body is not able to get enough water to flush out excess glucose. When you are playing sports, your blood sugar levels can also rise. This is because your body is using more energy, which can lead to a release of stored glucose.

If you are using a CGM, it is important to monitor your blood sugar levels closely when you are dehydrated or playing sports. You may need to adjust your insulin dose or eat more carbohydrates to keep your blood sugar levels in a safe range.

Dexcom sensor settling time

The Dexcom sensor needs about 24 hours to settle after it is inserted. During this time, the sensor may be less accurate. It is important to monitor your blood sugar levels closely during this time and to use a backup method of blood sugar testing, such as a finger prick, if you are concerned about your blood sugar levels.

Sensor placement

The placement of the Dexcom sensor is important. The sensor should be placed on the abdomen or the back of the upper arm. It is important to avoid placing the sensor on areas of the skin that are:

  • Injured
  • Irritated
  • Tattooed
  • Scarred

Acceptable tolerance of CGMS and blood sugar testers

CGMS devices are not always accurate, and they can be affected by factors such as exercise, illness, and food. Dexcom accepts a tolerance of 20% from blood readings. This means that a CGM reading that is 20% higher or lower than a blood reading is still considered to be accurate.

Most finger prick testers can be different to laboratory results. This is because finger prick testers measure blood sugar levels in the blood, while laboratory results measure blood sugar levels in plasma. Plasma is a thicker fluid that contains more glucose than blood. This is why laboratory results are typically higher than finger prick results.

Conclusion

CGM is a valuable tool for people with diabetes. It can help you improve your diabetes management and reduce the risk of complications. If you are considering using a CGM, talk to your doctor about the best option for you.

CGMs vs. Traditional Blood Testers: Revolutionizing Glucose Monitoring

05/06/2023

Introduction:
Monitoring blood glucose levels is a vital aspect of managing diabetes, as it helps individuals make informed decisions about their diet, insulin dosage, and overall health. For many years, traditional blood testers were the primary method of measuring glucose levels. However, with advancements in technology, continuous glucose monitors (CGMs) have emerged as a game-changer in diabetes management. In this blog post, we will explore the key differences between CGMs and traditional blood testers, delve into the effects of dehydration and sports activities on glucose readings, and touch upon the settling time required for CGM sensors like Dexcom.

CGMs vs. Traditional Blood Testers: An Overview:
Traditional blood testers, commonly known as fingerstick glucose meters, require a small blood sample obtained by pricking the finger with a lancet. The sample is then placed on a test strip, which is inserted into the meter for analysis. This process provides a snapshot of the blood glucose level at the specific moment the test is performed. It requires periodic testing throughout the day to get an idea of how glucose levels fluctuate.

On the other hand, CGMs provide continuous and real-time glucose readings throughout the day without the need for fingerstick tests. CGMs consist of a small sensor inserted under the skin, which measures interstitial fluid glucose levels, usually every few minutes. The data collected is transmitted wirelessly to a receiver or a smartphone app, allowing users to monitor their glucose levels continuously and detect trends and patterns.

The Benefits of CGMs:

  1. Continuous Monitoring: CGMs offer a comprehensive view of glucose levels, revealing trends, highs, and lows that might be missed with traditional blood testers.
  2. Alerts and Alarms: CGMs can be set to provide notifications when glucose levels fall outside of a target range, helping individuals take immediate action and avoid severe hypo- or hyperglycemia.
  3. Data Analysis: CGMs generate detailed reports and graphs, enabling healthcare providers to analyze glucose patterns over extended periods, leading to more informed treatment decisions.

Dehydration and Sports: Implications for Glucose Monitoring:
Dehydration and engaging in physical activities such as sports can affect glucose readings. When dehydrated, the blood becomes more concentrated, leading to a higher glucose concentration in the blood. Consequently, both CGMs and traditional blood testers may yield elevated glucose readings in dehydrated individuals. Therefore, it is crucial to stay adequately hydrated to ensure accurate glucose measurements.

During sports or rigorous exercise, the body’s demand for energy increases, resulting in the release of stored glucose. This can lead to a temporary decrease in glucose levels. CGMs, with their continuous monitoring capabilities, can help individuals track these fluctuations in real-time and take necessary steps to prevent hypoglycemia.

Sensor Settling Time: Dexcom and the 24-Hour Period:
Dexcom, one of the leading manufacturers of CGMs, suggests a 24-hour settling period for their sensors. This recommendation accounts for the initial trauma caused by sensor insertion. During this period, users may experience inaccurate readings or fluctuations. Waiting for the sensor to settle allows for stabilization and more reliable glucose measurements.

Conclusion:
The advent of CGMs has revolutionized glucose monitoring, offering substantial benefits over traditional blood testers. With continuous monitoring, alerts, and data analysis capabilities, CGMs empower individuals with diabetes to make more informed decisions about their health. However, it is important to stay hydrated and consider the effects of physical activities on glucose readings. Furthermore, users of CGMs like Dexcom should allow for a 24-hour settling period to ensure accurate and reliable measurements. Embracing this technological advancement can significantly enhance the management of diabetes, promoting better health outcomes for individuals worldwide.

References:

  1. American Diabetes Association.
Featured

Diabetes awareness month and Android APS

14/11/2022

Introduction

It’s diabetes awareness month and so I wanted to talk to you about something I am very passionate about, Android artificial pancreas system (AAPS). It’s not the cure I wanted but as far as I am concerned, it’s the closest to normal I have felt in the 25 years I have been a diabetic.

Why I LOVE Android APS

I decided to try Android APS just prior to the birth of my daughter. At the time I was using multiple daily injections (MDI) on a low-carb diet (less than 45g per day excluding protein and fat) and trying to pick up some muscle. I found it rather challenging to eat the number of carbs the trainer suggested without compromising control. I was also anticipating the late nights having a baby entails and I wanted to be prepared. David Burren’s blog provided a blueprint of what could be expected if I committed to investing the time required to perform all necessary testing and fine-tuning.

Benefits of Android APS

  • Meal management
    • Meals can be managed through a number of mechanisms including;
      • Un-announced meals (UAM) – AAPS boluses insulin without intervention or carb entry.
      • Announcing carbs – Add the carbs into the system and the calculator estimates the amount of insulin required based on your COB, IOB, ISF, current blood glucose, blood glucose deltas, and insulin sensitivity.
      • Extended carbs – typically used to mimic the absorption of protein (gluconeogenesis) or delayed gastric emptying caused by high-fat meals.
  • Exercise management
    • Insulin scaling adjusts basal insulin based on current insulin sensitivity
    • Automations allow you to schedule profile changes and temporary blood sugar targets for the duration of activity or condition.
  • Hardware / pumps / wearables
    • Functional on many old and new low-cost Android phones
    • Directly or indirectly (via Nightscout) display various blood glucose-related data on compatible watches. If you are using an Android watch (WearOS) you can control AAPS via the watch. Garmin watches can display blood glucose data during an activity.
    • Control a wide variety of pumps
    • Utilise the blood glucose data from a wide variety of CGMs (continuous glucose monitors)
  • Software
    • Automations allow you to automate system actions based on conditions (eg. blood glucose increasing, blood glucose decreasing, leaving for work, pump disconnect) or schedules.
    • SMS Commands to control AAPS remotely
    • Super micro boluses / boli (SMBs) allow AAPS to provide insulin efficiently and effectively.
    • The system will suspend insulin delivery when blood sugar is predicted to go below a certain threshold.
    • Highly customizable to your unique needs, with certain advanced builds allowing you to control more system variables (Boost, AIMI, Eating Now).
    • Cutting-edge development
      • Dynamic insulin sensitivity factor (ISF that changes based on blood glucose)
      • Improved prediction models
      • Improved insulin modeling (9-hour DIA)
  • Quality of Life
    • Reduced diabetic burden and stress.
    • Glucose is constantly monitored, with the ability for someone to follow you remotely, including community members. This can assist with fine-tuning settings.
    • Ability to eat more foods without compromising control
    • Improved glucose control reduces the possibility of long-term complications.
  • Safety
    • Objectives provide a level of safety as users need to understand basic principles of how to use the APS prior to closing the loop.
  • Cost
    • AAPS is open-source and free to use.
  • Monitoring / Reporting

Dis-benefits of Android APS

  • DIY Software build
    • As with all DIY systems, you are required to build the application prior to using it.
  • Cost of hardware
    • Phone
    • CGM
    • Pump and supplies
  • Connectivity fatigue
    • The burden of being connected to technology 24/7
  • Reliance
    • It is easy to become reliant on AAPS managing blood sugars.
  • Usability
    • Due to its complexity, you are required to invest a large amount of time in order to gain the understanding and skills required to configure and utilise it correctly.

Statistics and examples:

Nightscout statistics – 3 Months

Nightscout blood glucose distribution report
Nightscout blood glucose weekly distribution report

Control stats for different systems

Date Started TestControl Mechanisme-A1CAverage Blood GlucoseTime In Range (TIR) 3.9 – 10Standard DeviationAverage carbs consumedGVIPGSCGP – PGR
20/11/2019MDI6.1%7 mmol/l87%2.2 mmol/l1.220.331.7
20/11/2020MDI5.6%6.3 mmol/l94%1.7 mmol/l< 601.178.671.3
20/11/2021Loop5.7%6.5 mmol/l94%1.7 mmol/l<100 (carb counting)1.258.291.3
04/02/2022Android APS5.7%6.5 mmol/l96%1.5 mmol/l>200, little to no carb counting1.245.701.2
Analysis stats provided by Nightscout reporter.
Comprehensive glucose pentagon from Nightscout reporter report.

Un-announced meal (UAM) example

Low-carb meal with UAM running (Low-carb bread with cheese, ham, and mayo.)

Extract from Android APS data for a low carb meal

As can be seen above the system manages low-carb meals quite well with no carb inputs from the user. The system constantly monitors for rapid changes in blood sugars and administers insulin when required to quickly brings sugars into range.

Nightscout screenshot of low carb meal being absorbed while AAPS manages sugars.

Exercise stats / examples

YearAverage Time in Range (3.9-7.8 mmol/l)Average blood glucose (mmol/l)Average Standard Deviation (mmol/l)Total HoursTotal KM
202280.1 %6.60.43 131885
202171.9 %6.7 0.4149920
202069.7 %6.9 0.767658
Annual improvements are made through tweaking system variables and my approach to exercise.
Weight Training
DateIOB @ startMoving timeExercise TypeAverage HR (bpm)Standard Deviation (mmol/l)CGM BG StartCGM BG EndCGM BG Average (mmol/l)TIR (3.9-10)
2022-10-070.1436.93WeightTraining101.10.3657.76.87.27100.0%
EBike Ride
Android APS data exported during an E-Bike Ride 2022-11-06.
DateIOB @ startMoving timeExercise TypeDistance (km)Average HR (bpm)Standard Deviation (mmol\l)CGM BG StartCGM BG EndCGM BG Average (mmol\)TIR (3.9-10)
2022-11-06-0.849115.92eBikeRide271431.0955.95.87.16100%
Running
Android APS data exported during a run 2022-10-03.
DateIOB @ startMoving timeExercise TypeDistance (km)Average HR (bpm)Standard Deviation (mmol\l)CGM BG StartCGM BG EndCGM BG Average (mmol\)TIR (3.9-10)
2022-10-03-0.53478Run12 1681.1055.55.16.75100%
Featured

Thirty day challenge – week 4

Summary

This week was the best so far. I did my longest run to date (12km) and had a really good gym week lifting (approx. 20% more volume). My diabetes control is improving (thank you AAPS and exercise) and I have learned a lot digging though my data and through responses from the previous weeks question regarding carb sensitivity factor (CSF) being used to measure insulin sensitivity post exercise. I made some strides in my glucose management tool which also felt great.

BG vs. ISF vs. insulin sensitivity post gym (@11:48:09 – 42min)
BG vs. ISF vs. insulin sensitivity post run (@11:49:30 – 33min)

After gym sensitivity increased to 115% directly post training, while my sensitivity was stable at 78% post my run.

Body Metrics

Body mass vs. body fat
StartWeek 1Week 2Week 3Week 4
Weight (kilograms)75.8747574.173.1
Body fat percentage (according to Samsung)17.3%17.8**
Body fat percentage (according to the navy seal calculator)15%15%14.8%14%
Total volume
Table stating the weekly body metrics I am tracking.

Exercise

Week 1Week 2Week 3Week 4
Distance (kilometres)25.1720.5437.2229.4
Activity (hours)4.343.655.645.4
Table stating the weekly exercise metrics I am tracking

Nutrition

Screenshot of average macro-nutrients consumed during week 4

Diabetes

Week 1Week 2Week 3Week 4
Low (<3.9) (%)0.90.63.51.6
In Range (3.9-7.8) (%)75.374.771.978.9
High (>= 7.8) (%)23.824.724.619.5
Standard deviation (SD) 1.31.71.71.5
Average (mmol/l)6.87.0 6.7 6.5
A1c estimation (%)5.96.05.85.7
Table stating the weekly diabetic metrics I am tracking.

Ideally I want to see a time-in-range (TIR – 3.9-7.8 mmol/l) exceeding 90% with an average in the low sixes and a standard deviation (SD) around one (1).

Featured

Thirty day challenge

It’s spring, and after a brief ‘almost two months’ of going off the reservation snacking at all times of day and barely exercising, I decided to check my weight. I discovered I had picked up a few kilograms since my last weigh in. After learning this, I decided that it was time for me to get my life back together and start another 30 day challenge. I find these great to provide the reason to get back into a routine.

I know that setting unrealistic goals (like losing 5kgs) isn’t going to work, so I’m going to break down my plan in to nutrition, exercise and diabetes goals.

Exercise

My plan for the month is to gym three days a week, run a minimum of 2 times per week and to mountain bike at least once a week. (So I guess I lied about setting unrealistic goals 🙂 )

Nutrition

For my meals I plan to stick to my usual low-ish carbohydrate meals during the week and try to only go coo-coo bananas on the late night snacking over the weekend. I’ll start carb-counting again as this will almost always yield the best results. This will be supplemented with 2-3 liters of water, depending on length of cardio that day.

Diabetes

Above is a chart of my starting metrics. Lets see how quickly I can improve those values. Its going to be a little bit of an unfair test as I was not carb-counting during the above period.

We want to see the In range (Time-in-range) increase and the standard deviation decrease. By doing that the average and the A1c should follow. This will mostly be achieved by the diet component of the plan. The exercise component will allow me to eat more cabs and require less insulin, as well as improve circulation, sleep, blood pressure, mood, cholesterol, memory and overall mental and physical health.

I will check in with weekly updates to ensure I keep motivated and accountable.

Unannounced meals – Week 1

I started testing unannounced meals in Android APS on Saturday 30 July 2022. I am a bit of a control freak and really couldn’t believe that a system could manage my diabetes better than I could. I had more information available to me to make more informative decisions “I would tell myself”. But I seem to be wrong, well at least partly. I am using a branch of AAPS that delivers insulin early, but I found that managing protein and fat was more problematic than carbs seemed to be. Stubborn high blood sugar that seemed to take a few hours to correct. So I decided to do a little testing with automatons to try and improve those numbers.

Boost UAM stats (Time in range 3.9-7.8 mmol/l)
Boost UAM stats (Time in range 3.9-10 mmol/l)

Announcing carbs and pre-bolusing

Eerm…what? How is this possible? It seems with accurate carb counting I still cant account for digestion times as well as AAPS can.

Automations

I use two (2) automations to try and manage my readings more closely. These automations are over and above the Boost logic that provides insulin earlier than the standard code.

The first automation simply sets a lower target when my reading is above 7.8 mmol/l AND not dropping. This allows AAPS to bring down my readings more quickly.

The second is to try and compensate for protein and fat in the low carb meals I eat. This automation will activate if

  • my reading is above 6.5 mmol/l AND
  • between meal times AND
  • my reading isn’t dropping AND
  • there is active resistance detected (not sure if this even matters)

My hypothesis is that the system can detect the resistance post the meal window but I need to test this assertion further.

Android APS – Adjusting Boost after testing AIMI

An interesting set of results from my time with Boost. I cant wait to return to AIMI with what I have learned.

I was eating slightly less carbs (118g vs. 136g) than when I was using AIMI, but I would expect that if your profile is setup correctly that the amount of carbs shouldn’t have much of an impact on performance metrics. I was running into a few hypos so I lowered the algorithms insulin required percentage (70% vs. 100%) which resulted in a whopping 1.6% decrease (57 minutes vs. (288 minutes / 4.8 hours)) of time spent in a hypoglycaemic state while using Boost.

My standard deviation was slightly lower (1.3 vs. 1.4) signifying less fluctuations between readings while my time in a hyperglycaemic state went up 0.6% (25.2 hours vs. 26.6 hours)).

I did have to turn off “enable boost percentage scale” as this was providing too much insulin, but more experimenting could remedy this.

Another interesting observation was that my ratio between total daily dose (TDD) and total carbs eaten went down from 4.2 to 4.01 (grams of carbs per unit of insulin) as my average blood sugar lowered.

My exercise seems to have stayed pretty consistent during testing (as per the table below) which leads me to believe the reduced insulin need may be related to requiring less insulin when blood sugar is euglycemic. Its going to be a little more difficult to track that for the next few weeks as I am preparing to ramp up training for the Southern Cross 10km in July. The training has however provided an opportunity to fine tune my running routine as outlined here in my post about predicting blood sugars while running.

I cant wait to do some further testing with AIMI, Boost and Eating now.

Table of performance metrics from when I was MDI to the latest build of Boost.
Boost Stats (70% insulin required)
AIMI Stats (100% insulin required)
Boost TIR stats 3.9 – 10mmol/l
Exercise table (stats derived from Strava and Python scripts)

Predicting blood sugars while exercising.

I recently posted about how my experimenting with running using AAPS was progressing. I observed that under certain conditions there was a significant lag between the capillary blood and CGM readings at about the 30 minute mark. This sparked some interest in wanting to know if I could predict what my capillary blood sugar could be using machine learning. I’m still not sure if its entirely possible yet, but I am having fun trying, and I have learned a lot in the process. I’m currently working on the script that will allow me to overlay a lot more AAPS data during a workout, including predictions.

I am getting a lot better at managing blood sugars as I noticed the last 14 exercises I was in range (3.9-7.8) 100% of the time.

Python script data capture

I have changed my approach slightly towards eating before exercise and have piggy backed off some research done by Gary Scheiner to create a spreadsheet that estimates the carbs required and effort for a run.

https://wordpress.com/post/t1daaps.wordpress.com/482

Dynamic Insulin Sensitivity Factor (ISF)

Dynamic ISF is all the buzz in the diabetic community at the moment, and so it should be! In the first few days of using it I was able to see marked improvements with little to no intervention as the algorithm scaled my correction doses.

What is Dynamic ISF

Your insulin sensitivity factor (ISF) is how much one unit of insulin will lower your blood glucose. Simply put dynamic ISF uses your total daily dose (TDD) of insulin to scale this value depending on blood sugar.

My results

So far the results have been astoundingly positive.

Before D-ISF : Average TDD: 30.1, Average Carbs :138g
Using D-ISF: Average TDD: 25.1, Average Carbs :102g

Update:

Using D-ISF for one (1) month. A little bit of an unfair test as I had 3 sensors fail during this period, which resulted in many issues with sensor accuracy.

Formula

ISF = 277700 / ( BG * TDD )

Differences in the GUI (when using DEV)

As you can see in the picture below, the yellow square highlights the time the loop last ran, and the red square shows the profile ISF vs. the calculated dynamic ISF.

Home screen of AAPS

It’s interesting to note that the D-ISF code isn’t implemented when using the calculator, its only actively scaling ISF using SMB’s (and maybe basal %). This will mean your normal profile ISF is going to be used when eating a meal. If you have never tested your ISF It may be worth while checking what the scaled ISF is at meal time (provided your BG is perfect) and setting your profile to that value if the values are vastly different. This is also providing that you aren’t in a period of significant resistance or sensitivity.

The Dynamic ISF plugin you will obtain in the config builder of the Dev code.

Where do I get a copy of the AAPS Dynamic ISF branch

It is in the same repository as the standard (master) version of AAPS. In order to use it you will need to select a different branch of AAPS (dev) and build that branch. I suggest you read Tim Streets repo notes for a more in depth description of the code and its functionality, even though you will not require the code from that repository. You will need to enable engineering mode on the phone in order to utilise the dev branch.

https://github.com/nightscout/AndroidAPS

I’ll write a post about building in the next few days.

Ciao for now!