13th Feb 2022 (updated 18th October 2022 to include unannounced meals)
In recent years scientists have discovered that carbohydrates are not the only macronutrient that has an effect blood sugar. In fact there are more and more medical studies exploring the effects of the other macronutrients (fat and protein) on blood sugar, and the complications they pose to blood sugar control. In the post below I provide my understanding and explore how I inject for protein and fats using an artificial pancreas system (APS).
Science / Background
One of the more interesting reads on the subject is a medical study entitled “The Role of Dietary Protein and Fat in Glycaemic Control in Type 1 Diabetes: Implications for Intensive Diabetes Management”. In the study they explore the effect of fats and protein on blood sugar management. I have summarised some of the more interesting elements below;
- Fat itself doesn’t get converted through gluconeogenesis into carbohydrates, but glycerol from the hydrolysis of TAGs can be metabolised to pyruvate and makes up between 5-15% of the weigh of TAGs, so only part of the TAGs would be converted into glucose.
- Fat does have an impact on gastric emptying, slowing the process down by delaying and reducing glycaemic and insulinemic responses.
- Meal protein influences hormones such as cortisol, growth hormone, IGF-1 and ghrelin. These changes impact insulin resistance and increase insulin requirements.
- 90% of the amino acids found in protein are converted into glucose through gluconeogenesis and will increase blood glucose.
How do I inject for the effects of fat and protein?
There are currently a few different methods to deal with the effects of protein and fat on blood glucose, I will outline the one I mostly use, but if you are on multiple daily injections (MDI) I strongly suggest reading Dr. Bernstein’s diabetes solution for an approach using regular insulin. All of these approaches require some experimenting on your part.
Loop / Android APS
Depending on the macronutrient profile, I shift my approach appropriately. I generally eat low-carb high protein meals as these meals are more easily managed by an APS or covered by MDI. For these types of meals I use the formula eCarbs (extended carbs) = (Protein *25%) + (Fat *10%). I then add an absorption time of around 5-6 hours, unless the fats are above 40g, then I would increase the absorption time to 7-8 hours to counter the delayed gastric emptying caused from the increased fat content.
eCarbs (extended carbs) = (Protein *25%) + (Fat *10%)

If the fat content is more than 60g, I prefer to add 30% to the total carb count and then split the dose 60/40 (this amount will vary on the protein content and your body’s ability to digest the food) . This can either be done by scheduling the second dose or by using an extended bolus.
Its often a hit and miss process. So I keep detailed notes to help me repeat the process should I guess correctly and want to eat that meal again. Otherwise its used as a variable and adjusted the next time I eat that meal.
Unannounced meals (UAM) – Android APS / OpenAPS
Another mechanism of managing high protein, moderate fat meals is though an Android APS / OpenAPS function called unannounced meals (UAM). This is extremely low input (All you need to do is not add carbs to AAPS). This requires you to manage your expectations somewhat in terms of how much fat AAPS can manage without user intervention, but moderate fat high protein meals can be managed with minor deviations and no user intervention as can be seen in the example below and is a complete game changer in terms of quality of life.
Goal
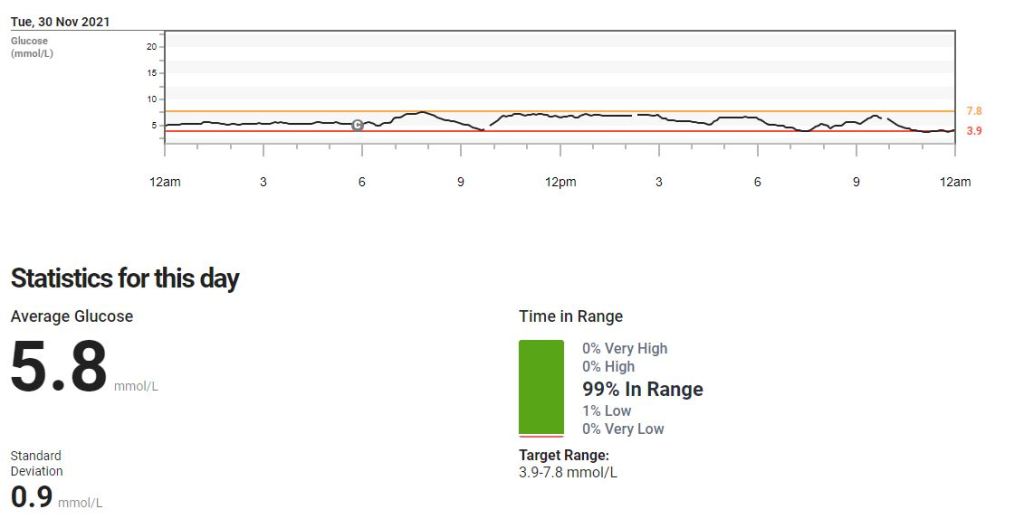
The goal of any meal as far as I am concerned is to keep your readings within a normal blood sugar range for the entire duration of the meal, whilst minimising any sudden spikes in blood sugar, essentially mimicking a working pancreas. To analyse this I use two values, standard deviation and time in range (TIR). These two (2) values will assist you in determining how good or bad a meal was for you in terms of blood sugar impact.
Time in Range (TIR): For TIR we are looking for a high percentage of your readings within a normal (I use 3.9-7.8 mmol/l ) range.
Standard Deviation: For standard deviation I look for values under 1 as a meal that has little to no blood glucose impact (BGI).
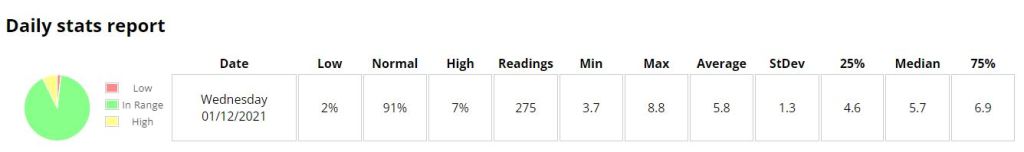
Coefficient of the variation (CV): Is the standard deviation divided by the average glucose. Its a measure that helps normalise the results by reducing the influence on average glucose. Most studies indicate that anything under 33% is good.


You will notice that all the meals are low-carb high protein meals. My blood sugar hardly deviated in the first 3 hours of eating and then had a slight bump during the absorption of proteins later. This can be seen by observing the differences in the three (3) and five (5) hour standard deviation values. The first set of standard deviations being lower represent blood sugars that are close to the each other in number and not changing much, then they start getting a litter larger as blood sugars rise (so the SD gets higher) as the proteins digest in the last 2 hours.
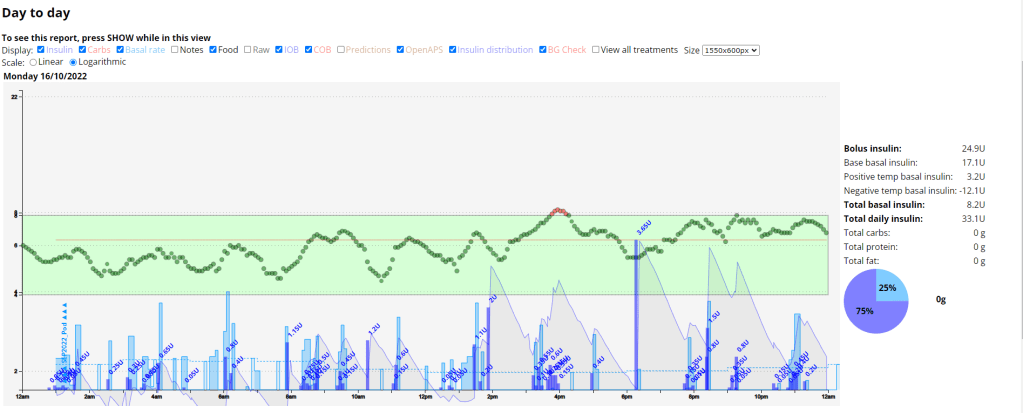
Example of Android APS (UAM) counteracting the absorption of proteins and fats
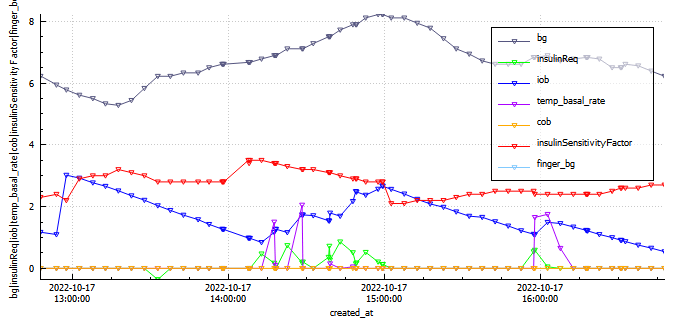
An export of the device status for the 4 hours post meal consumption.
In the graph above we can see sugars (grey) steadily rise and peak (8.2 mmol/l) at around the two (2) hour mark due to protein digestion (gluconeogenesis). By the four (4) hour mark the system has infused an additional 3.2 units of insulin through super micro boluses (SMBs) and temporary basal adjustments to bring sugars down to a comfortable, but not perfect 6.2 mmol/l. This was completely managed by AAPS with no intervention by myself. Using additional functionality in AAPS we could provide insulin more quickly using automations and profile switches to further reduce the impact of protein. If we use the Loop eCarb formula previously stated, then insulin required for fat and protein equates to 3.3 units.
| Meal Name | Insulin | Carbs | Protein | Fat | Start BG BG | End BG | Average 2 hours | Average 4 hours | Time in Range 2 hours (3.9-7.8) | Time in Range 4 hours (3.9-7.8) |
| Lunch | 2 units @ meal start | 18.4g | 62g | 41g | 5.8 mmol/l | 6.2 mmol/l | 6.69 mmol/l | 6.87 mmol/l | 85.1% | 88.6% |
As you can see from the Nightscout graph, no carbs have been entered into AAPS and results have been outstanding.
Example of Loop counteracting the absorption of proteins and fats
In the picture below we can see how Loop manages gluconeogenesis (eCarbs or extended carbs) from a low-carb high protein meal I ate.
At the top of the Loop user interface (UI) (the yellow arrow) we can see that Loop is issuing a 2.3U temporary basal (temp basal) almost three hours after I injected for the meal. This temp basal is to counter the absorption of the fats and proteins. These temp basals’ are issued and adjusted multiple times during the course of the meal digestion timeframe.
In the Insulin delivery section of the Loop UI (the red arrow) we can see Loop delivering insulin in the form a temp basal. It takes multiple hours for the protein to be synthesised into glucose and so a temporary basal can easily manages the resultant rise in blood sugar from gluconeogenesis.
In the Active carbohydrates section of the Loop UI (the blue arrow) we can see that there are still 14g of unabsorbed carbohydrates that Loop will manage with temporary basals’.

The picture below is from the ICE (Insulin Carbohydrate Effect) chart displaying a graphical representation of the predicted vs observed blood glucose effects that insulin and carbohydrates have on the body.

Meal examples
Here are a few examples of meals I eat, not all are low-carb meals, but all meals are under 50g of carbs.