Diabetes awareness month and Android APS

14/11/2022

Introduction

It’s diabetes awareness month and so I wanted to talk to you about something I am very passionate about, Android artificial pancreas system (AAPS). It’s not the cure I wanted but as far as I am concerned, it’s the closest to normal I have felt in the 25 years I have been a diabetic.

Why I LOVE Android APS

I decided to try Android APS just prior to the birth of my daughter. At the time I was using multiple daily injections (MDI) on a low-carb diet (less than 45g per day excluding protein and fat) and trying to pick up some muscle. I found it rather challenging to eat the number of carbs the trainer suggested without compromising control. I was also anticipating the late nights having a baby entails and I wanted to be prepared. David Burren’s blog provided a blueprint of what could be expected if I committed to investing the time required to perform all necessary testing and fine-tuning.

Benefits of Android APS

  • Meal management
    • Meals can be managed through a number of mechanisms including;
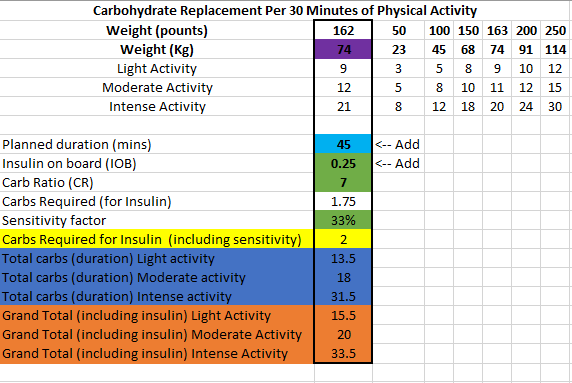
      • Un-announced meals (UAM) – AAPS boluses insulin without intervention or carb entry.
      • Announcing carbs – Add the carbs into the system and the calculator estimates the amount of insulin required based on your COB, IOB, ISF, current blood glucose, blood glucose deltas, and insulin sensitivity.
      • Extended carbs – typically used to mimic the absorption of protein (gluconeogenesis) or delayed gastric emptying caused by high-fat meals.
  • Exercise management
    • Insulin scaling adjusts basal insulin based on current insulin sensitivity
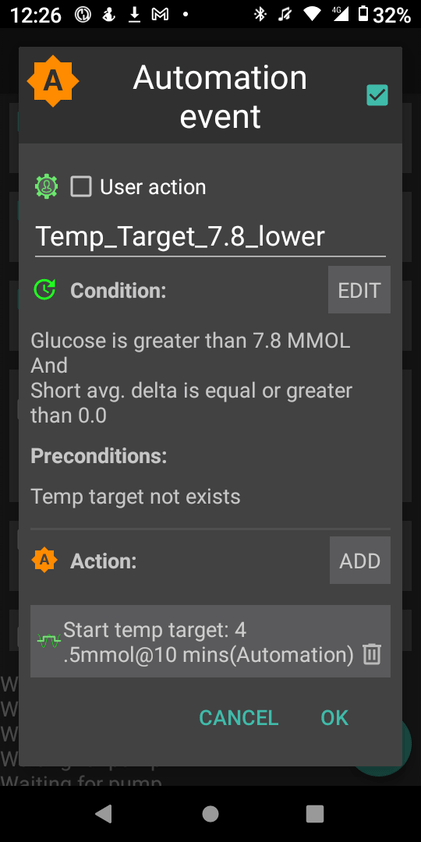
    • Automations allow you to schedule profile changes and temporary blood sugar targets for the duration of activity or condition.
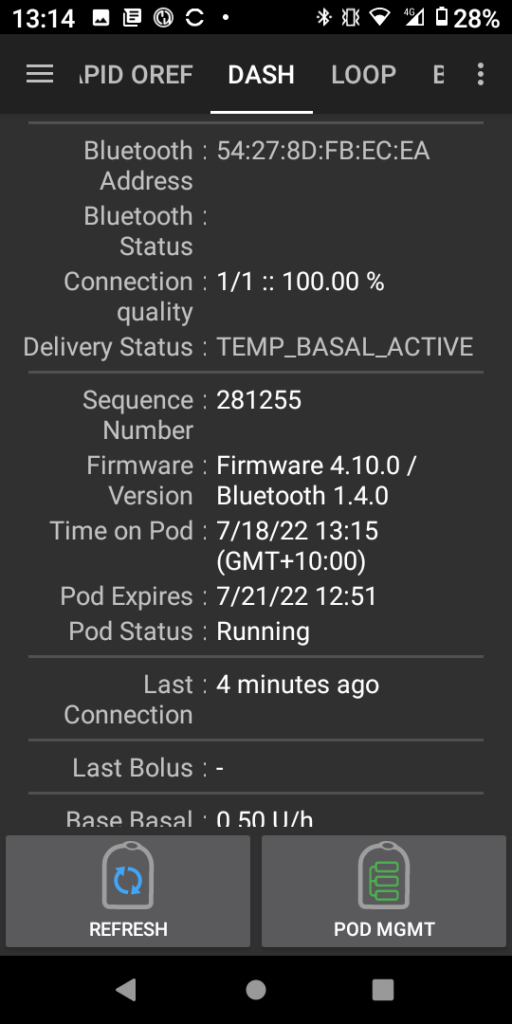
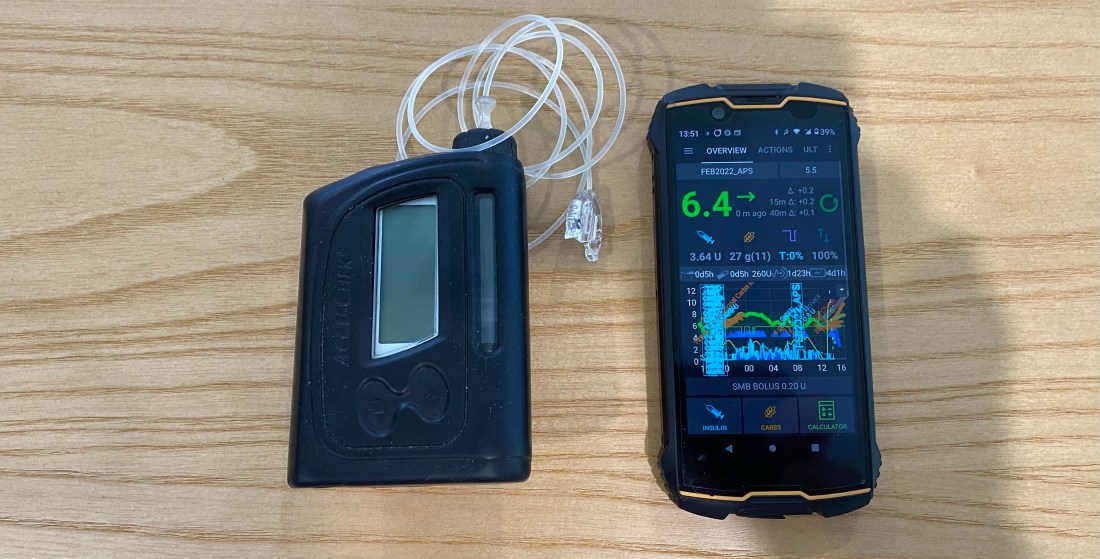
  • Hardware / pumps / wearables
    • Functional on many old and new low-cost Android phones
    • Directly or indirectly (via Nightscout) display various blood glucose-related data on compatible watches. If you are using an Android watch (WearOS) you can control AAPS via the watch. Garmin watches can display blood glucose data during an activity.
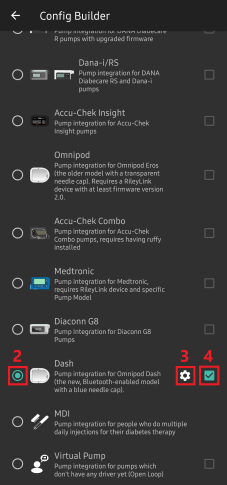
    • Control a wide variety of pumps
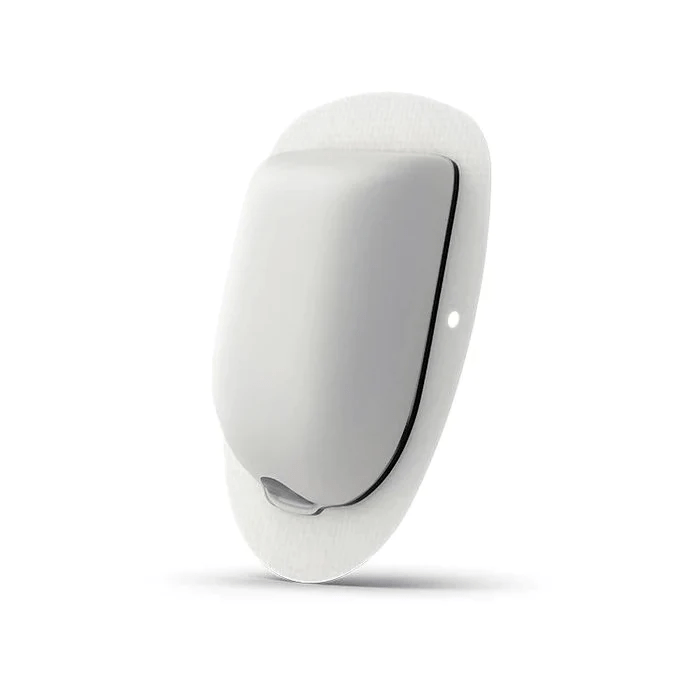
    • Utilise the blood glucose data from a wide variety of CGMs (continuous glucose monitors)
  • Software
    • Automations allow you to automate system actions based on conditions (eg. blood glucose increasing, blood glucose decreasing, leaving for work, pump disconnect) or schedules.
    • SMS Commands to control AAPS remotely
    • Super micro boluses / boli (SMBs) allow AAPS to provide insulin efficiently and effectively.
    • The system will suspend insulin delivery when blood sugar is predicted to go below a certain threshold.
    • Highly customizable to your unique needs, with certain advanced builds allowing you to control more system variables (Boost, AIMI, Eating Now).
    • Cutting-edge development
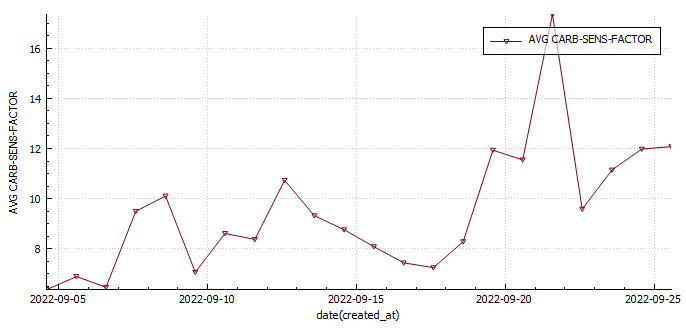
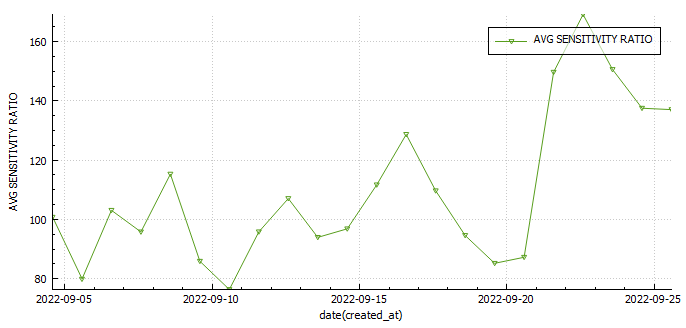
      • Dynamic insulin sensitivity factor (ISF that changes based on blood glucose)
      • Improved prediction models
      • Improved insulin modeling (9-hour DIA)
  • Quality of Life
    • Reduced diabetic burden and stress.
    • Glucose is constantly monitored, with the ability for someone to follow you remotely, including community members. This can assist with fine-tuning settings.
    • Ability to eat more foods without compromising control
    • Improved glucose control reduces the possibility of long-term complications.
  • Safety
    • Objectives provide a level of safety as users need to understand basic principles of how to use the APS prior to closing the loop.
  • Cost
    • AAPS is open-source and free to use.
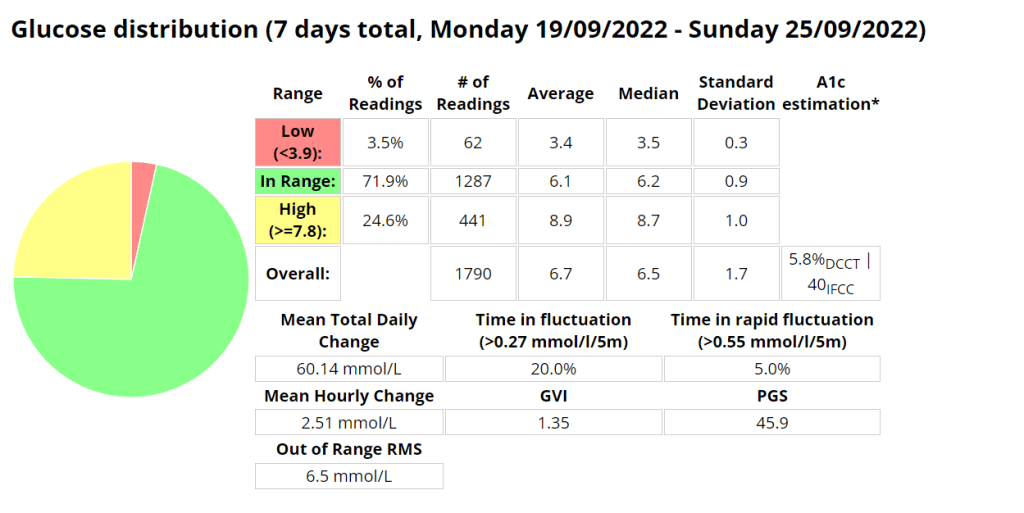
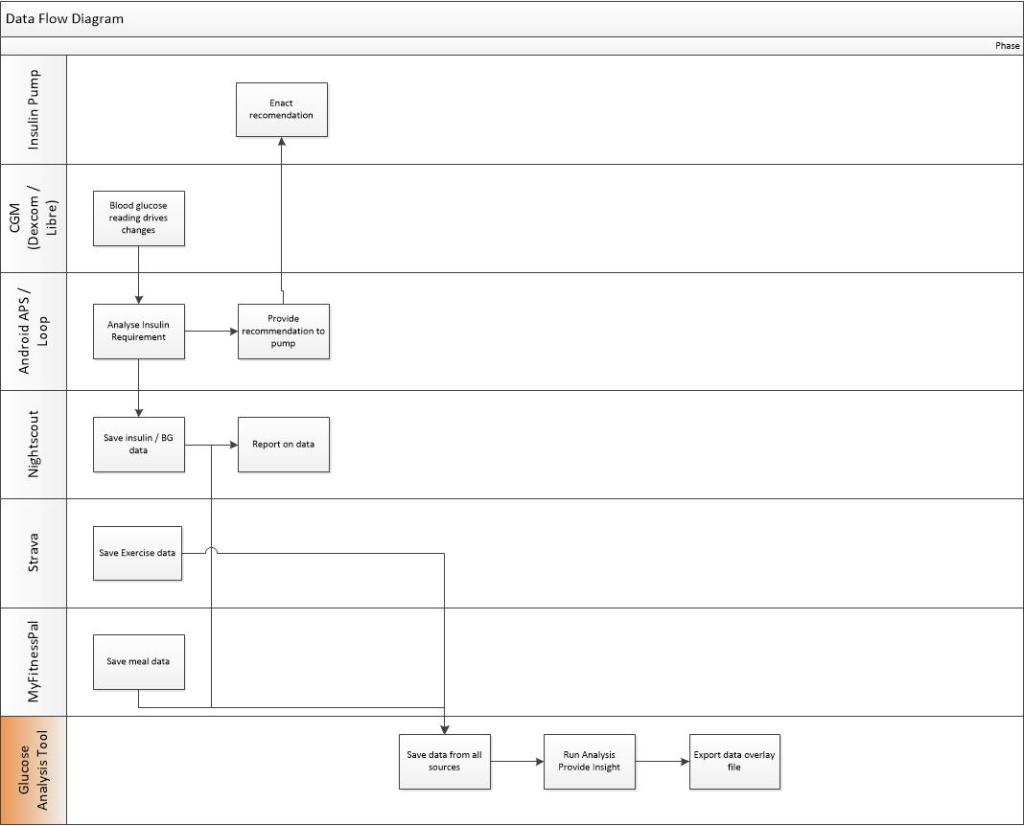
  • Monitoring / Reporting

Dis-benefits of Android APS

  • DIY Software build
    • As with all DIY systems, you are required to build the application prior to using it.
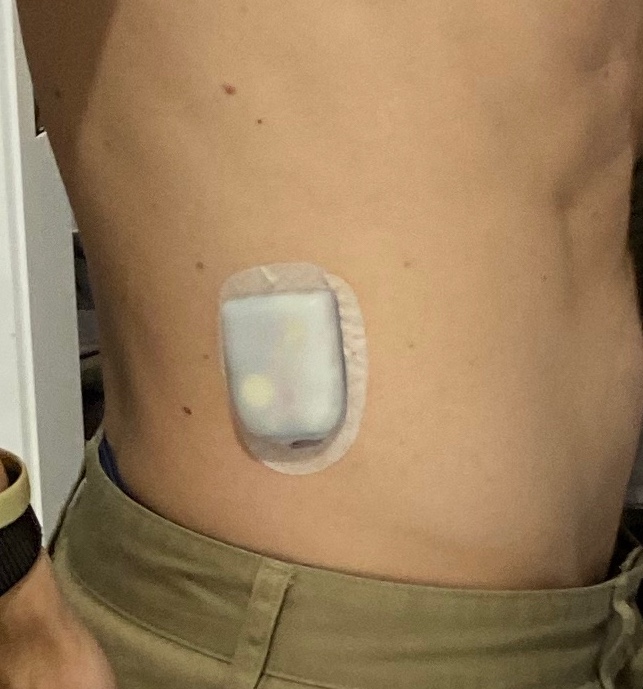
  • Cost of hardware
    • Phone
    • CGM
    • Pump and supplies
  • Connectivity fatigue
    • The burden of being connected to technology 24/7
  • Reliance
    • It is easy to become reliant on AAPS managing blood sugars.
  • Usability
    • Due to its complexity, you are required to invest a large amount of time in order to gain the understanding and skills required to configure and utilise it correctly.

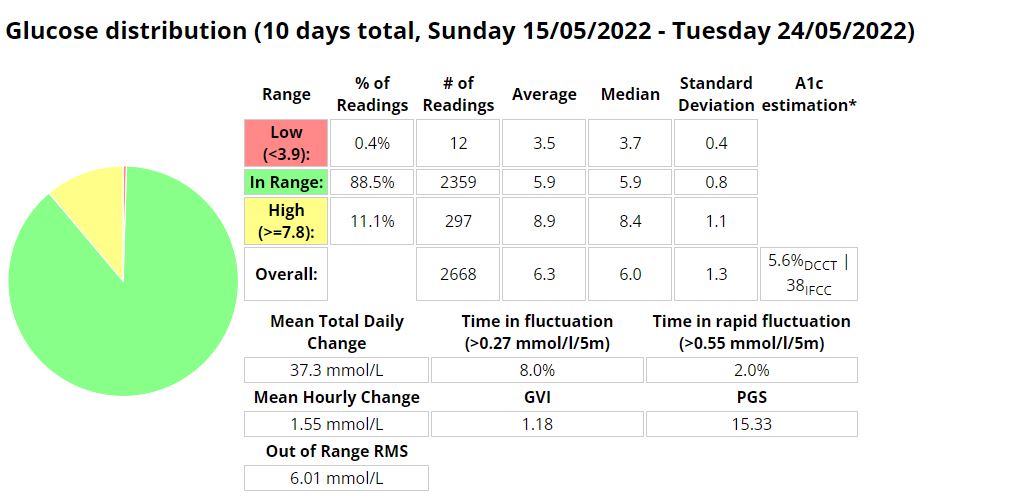
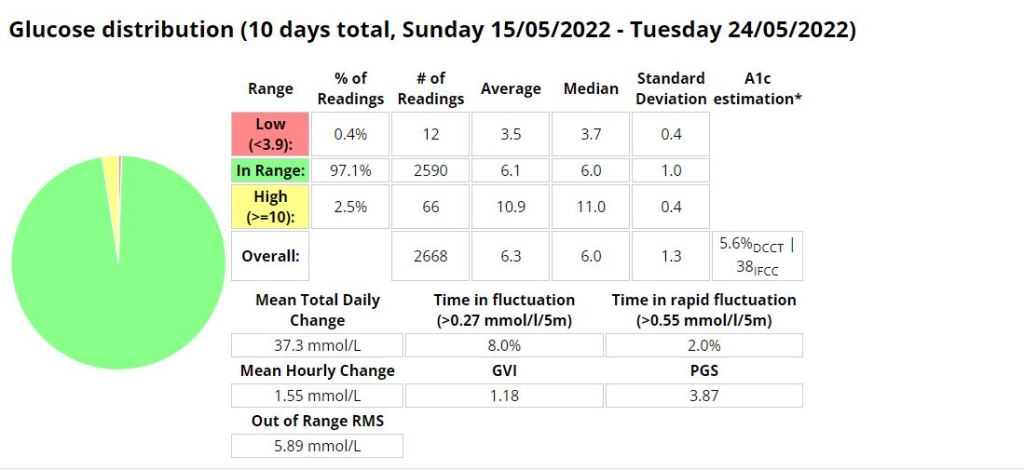
Statistics and examples:

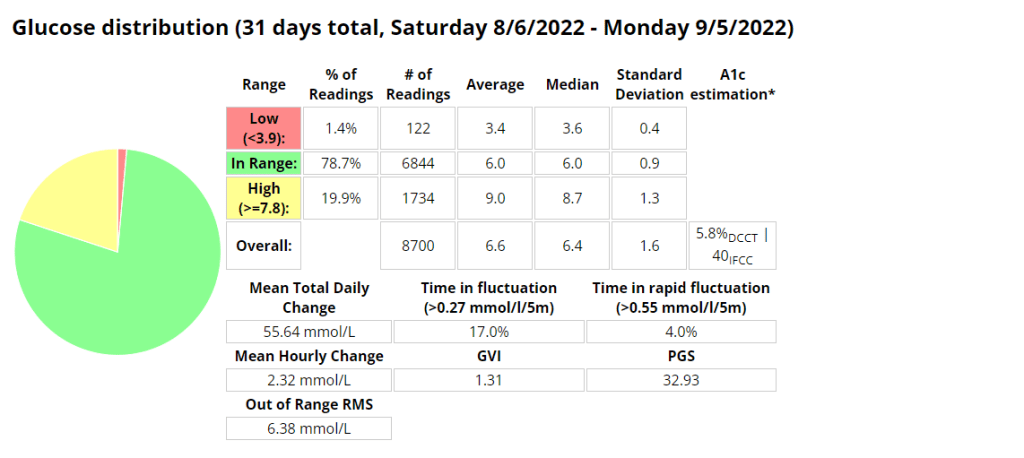
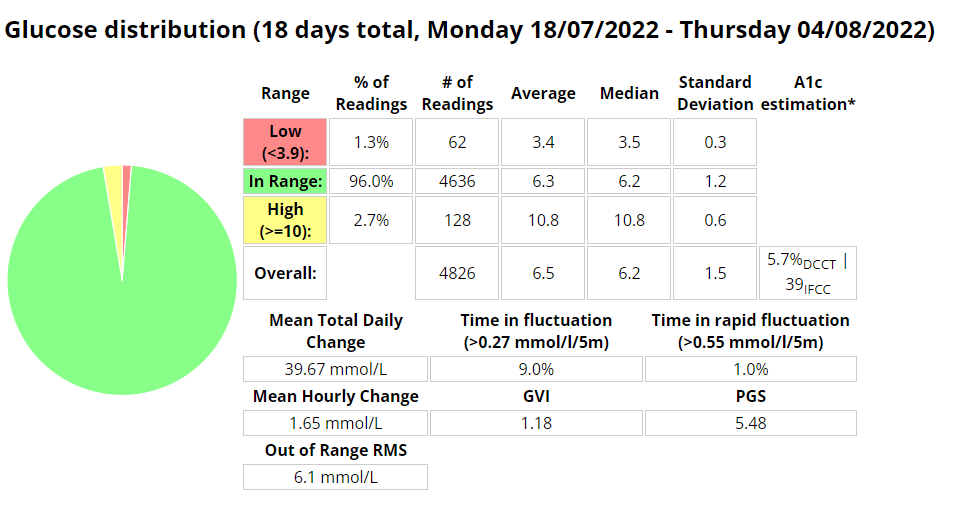
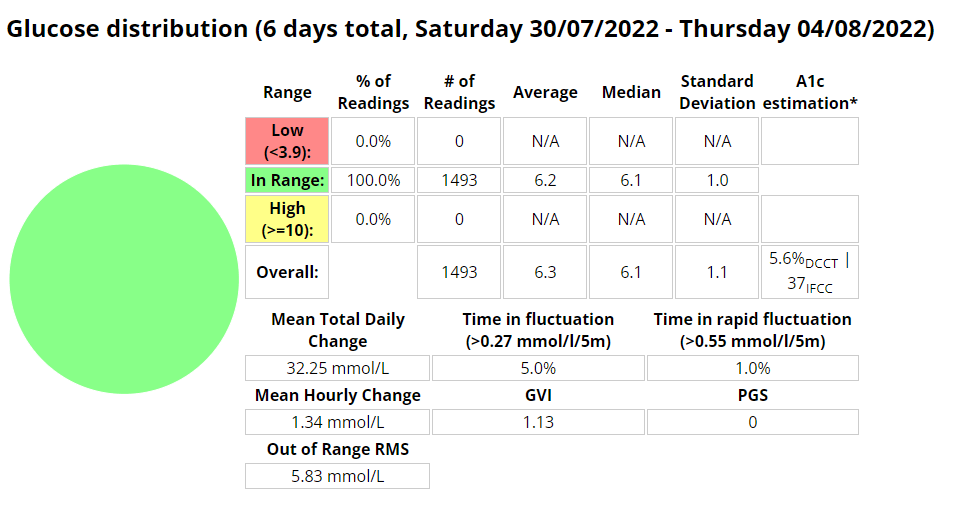
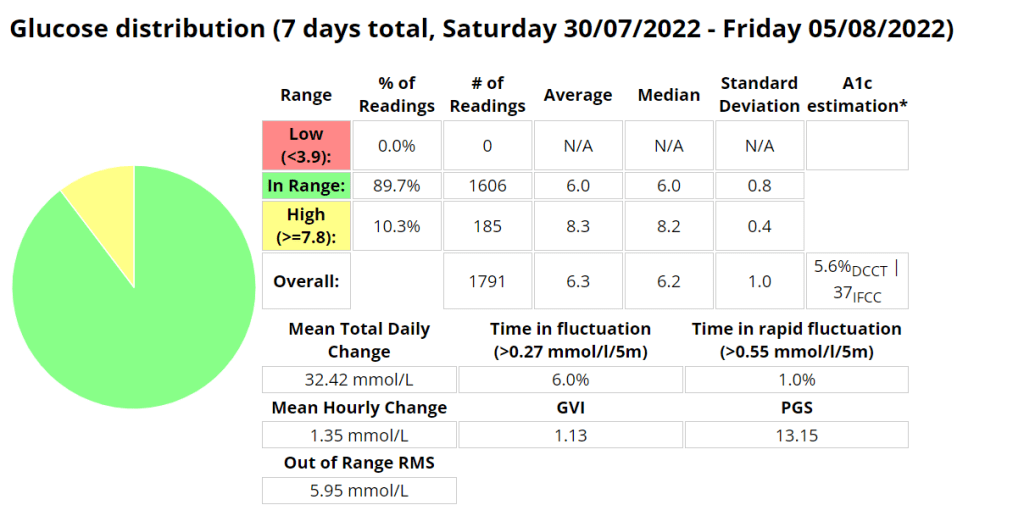
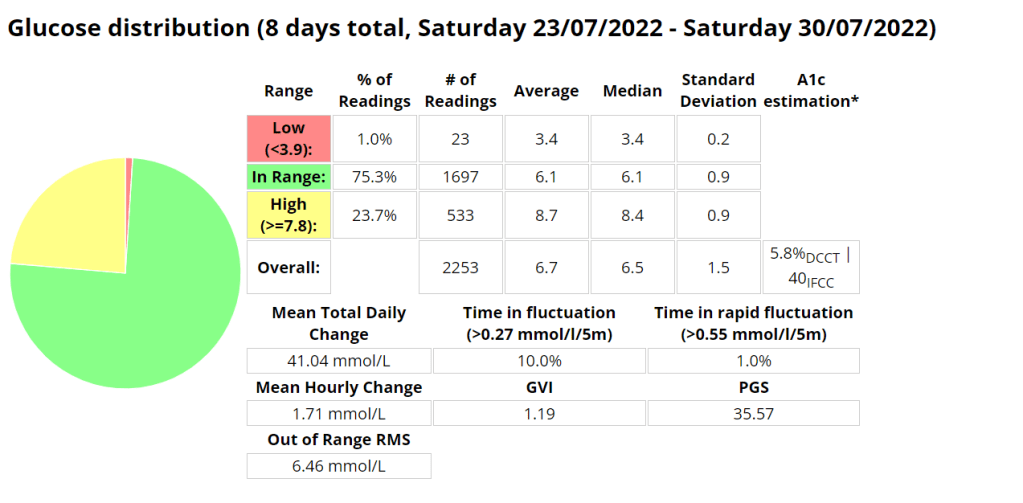
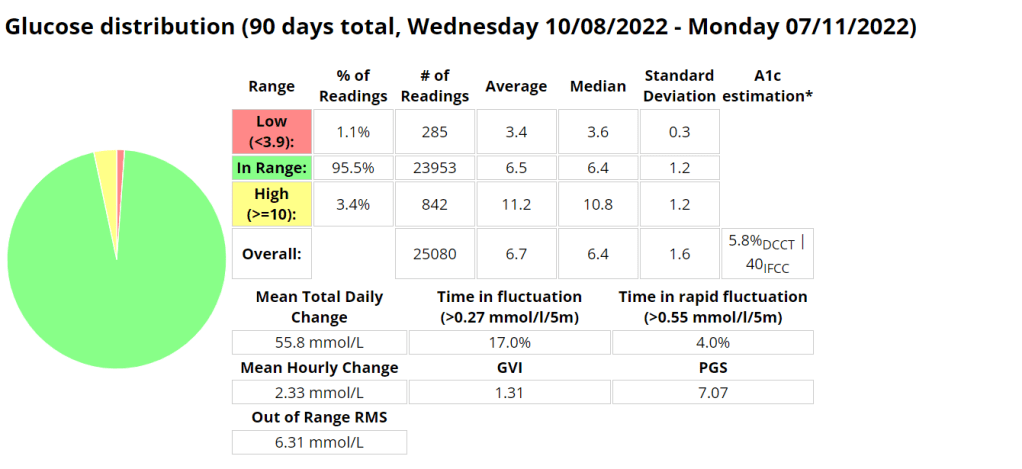
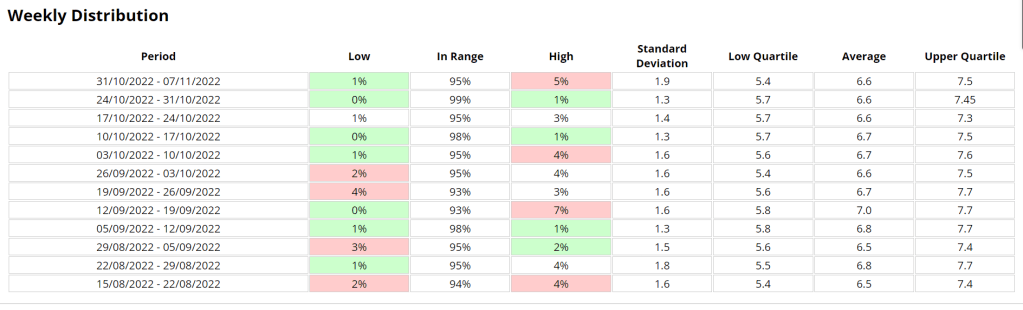
Nightscout statistics – 3 Months

Nightscout blood glucose distribution report
Nightscout blood glucose weekly distribution report

Control stats for different systems

Date Started TestControl Mechanisme-A1CAverage Blood GlucoseTime In Range (TIR) 3.9 – 10Standard DeviationAverage carbs consumedGVIPGSCGP – PGR
20/11/2019MDI6.1%7 mmol/l87%2.2 mmol/l1.220.331.7
20/11/2020MDI5.6%6.3 mmol/l94%1.7 mmol/l< 601.178.671.3
20/11/2021Loop5.7%6.5 mmol/l94%1.7 mmol/l<100 (carb counting)1.258.291.3
04/02/2022Android APS5.7%6.5 mmol/l96%1.5 mmol/l>200, little to no carb counting1.245.701.2
Analysis stats provided by Nightscout reporter.
Comprehensive glucose pentagon from Nightscout reporter report.

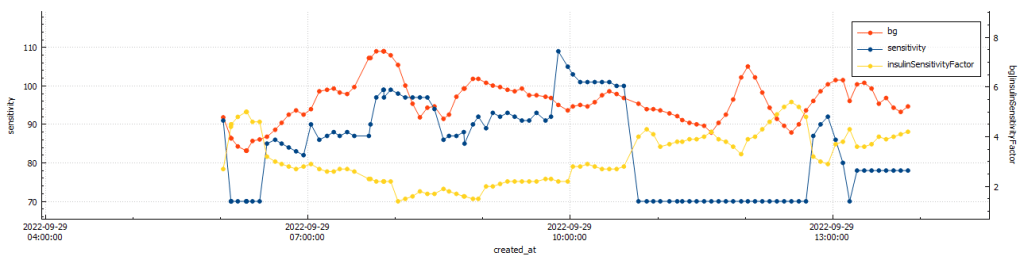
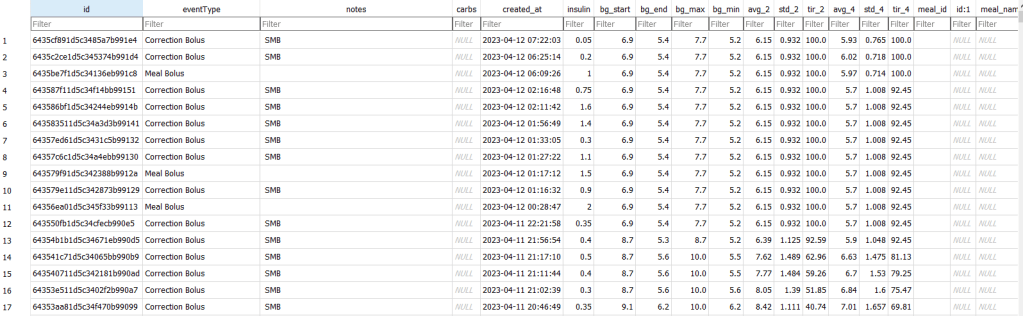
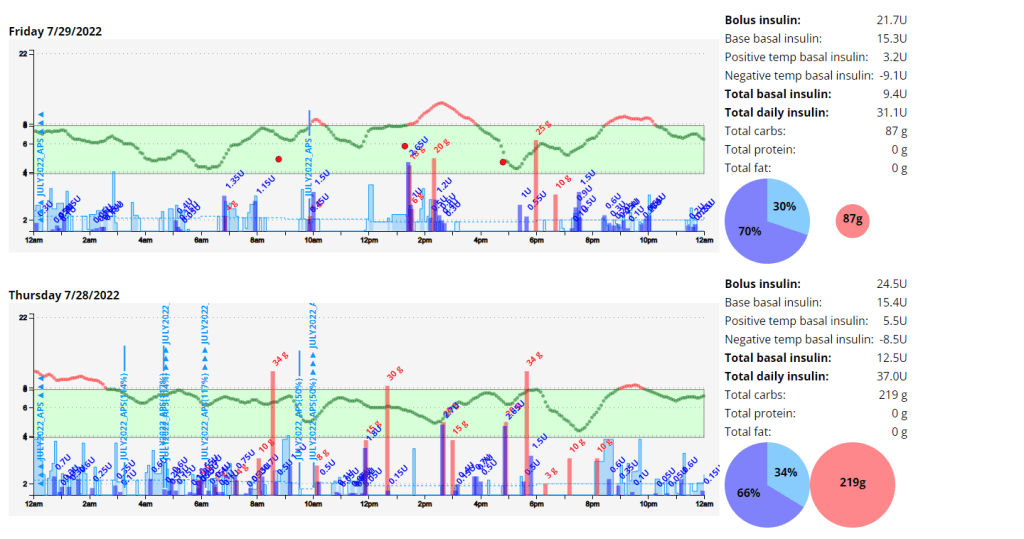
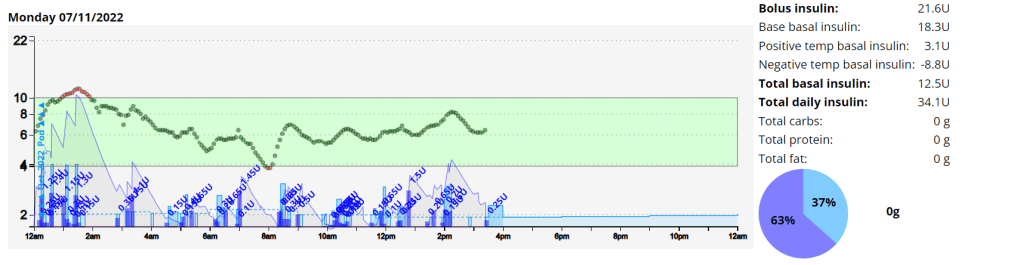
Un-announced meal (UAM) example

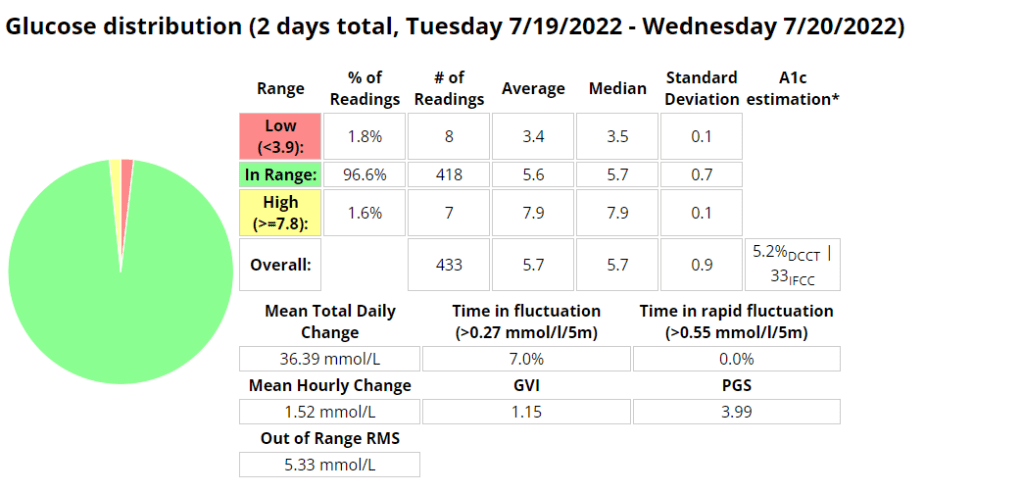
Low-carb meal with UAM running (Low-carb bread with cheese, ham, and mayo.)

Extract from Android APS data for a low carb meal

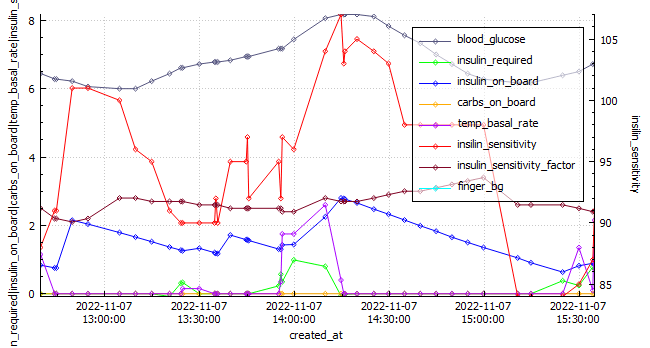
As can be seen above the system manages low-carb meals quite well with no carb inputs from the user. The system constantly monitors for rapid changes in blood sugars and administers insulin when required to quickly brings sugars into range.

Nightscout screenshot of low carb meal being absorbed while AAPS manages sugars.

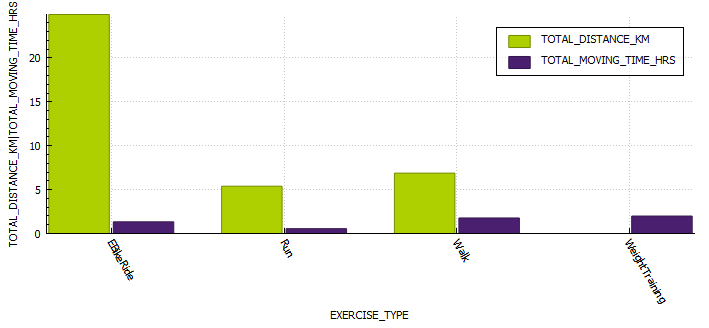
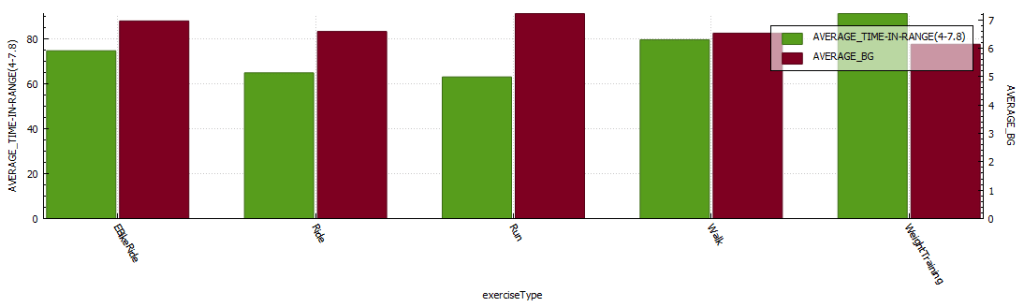
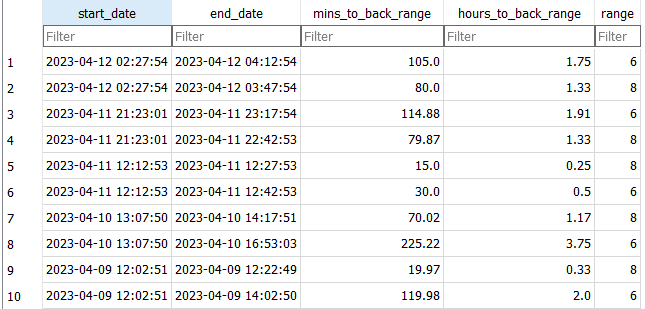
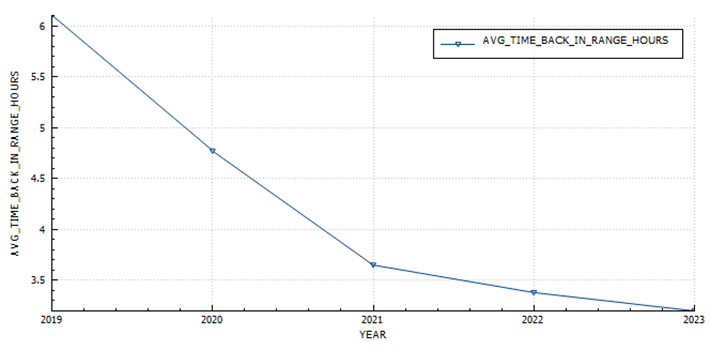
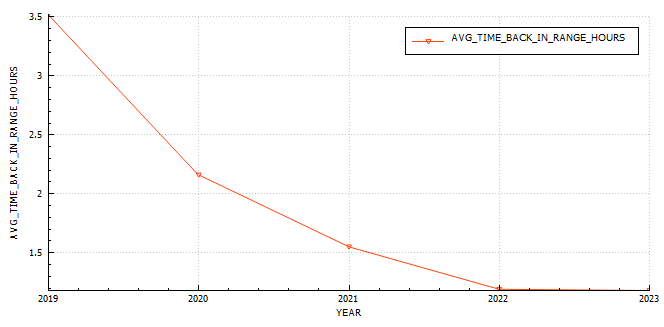
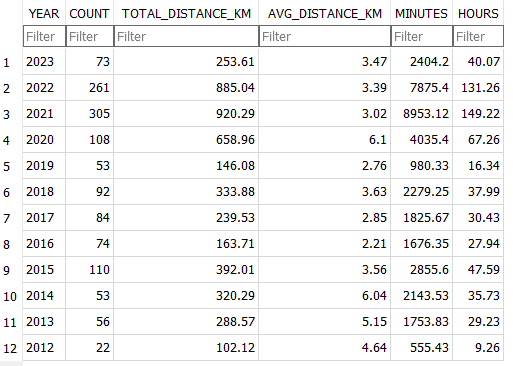
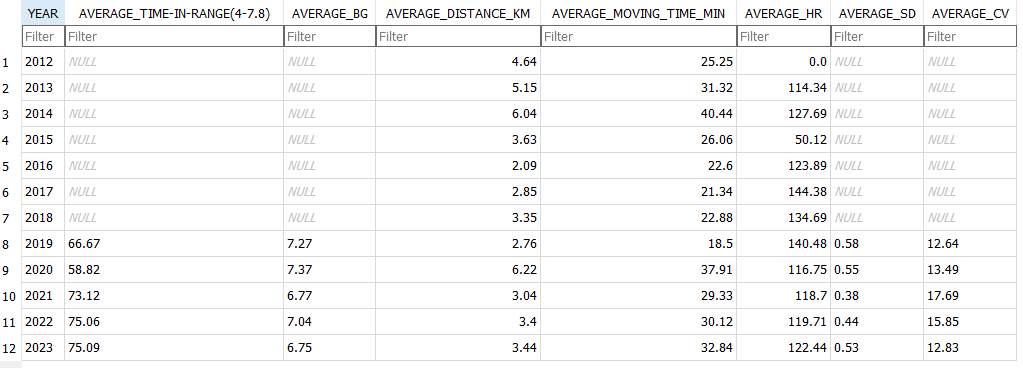
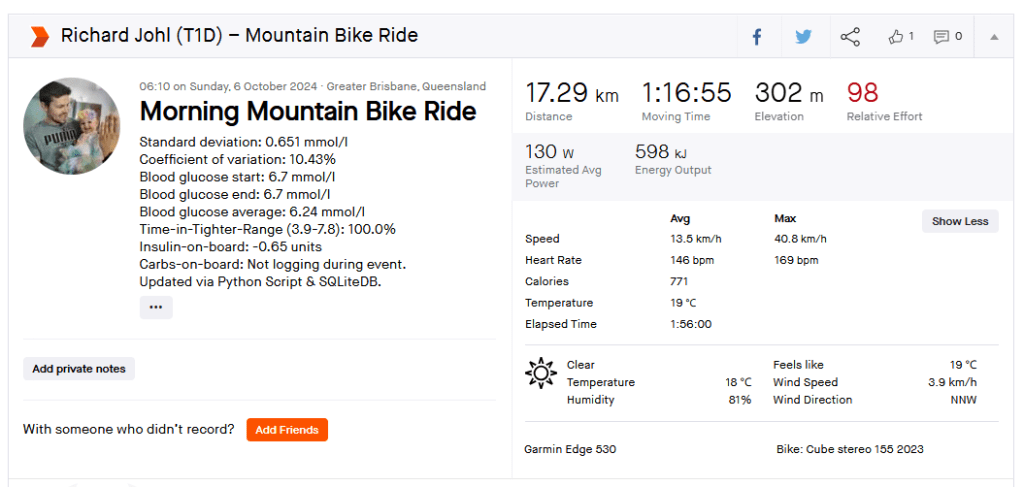
Exercise stats / examples
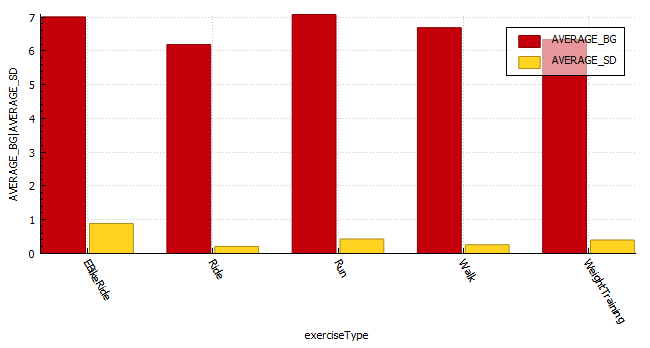
YearAverage Time in Range (3.9-7.8 mmol/l)Average blood glucose (mmol/l)Average Standard Deviation (mmol/l)Total HoursTotal KM
202280.1 %6.60.43 131885
202171.9 %6.7 0.4149920
202069.7 %6.9 0.767658
Annual improvements are made through tweaking system variables and my approach to exercise.
Weight Training
DateIOB @ startMoving timeExercise TypeAverage HR (bpm)Standard Deviation (mmol/l)CGM BG StartCGM BG EndCGM BG Average (mmol/l)TIR (3.9-10)
2022-10-070.1436.93WeightTraining101.10.3657.76.87.27100.0%
EBike Ride
Android APS data exported during an E-Bike Ride 2022-11-06.
DateIOB @ startMoving timeExercise TypeDistance (km)Average HR (bpm)Standard Deviation (mmol\l)CGM BG StartCGM BG EndCGM BG Average (mmol\)TIR (3.9-10)
2022-11-06-0.849115.92eBikeRide271431.0955.95.87.16100%
Running
Android APS data exported during a run 2022-10-03.
DateIOB @ startMoving timeExercise TypeDistance (km)Average HR (bpm)Standard Deviation (mmol\l)CGM BG StartCGM BG EndCGM BG Average (mmol\)TIR (3.9-10)
2022-10-03-0.53478Run12 1681.1055.55.16.75100%

Thirty day challenge – week 3

Summary

I am starting to feel like a routine is forming, perhaps not around diet yet, but definitely in regards to training. In previous years of doing this I was eating clean most days, as it provided improved diabetic control in the absence of an APS/AID and pump.

This week was particularly heavy due to my birthday dinner, a new phone, a new version of AAPS (Boost test platform 3.6.5) and a 25 km cycle. *I have been unable to pair my galaxy watch with my new phone, which is sad as I really liked the watch and having the plethora of sensors.

I was investigating the possibility of measuring insulin sensitivity changes in AAPS . One way would be to use the autosens feature in AAPS , but since I wasn’t including the carbs I ate to fix hypos, and I was snacking in-between to keep my readings steady that wasn’t going to work. The only metric that may prove useful may be my carb sensitivity factor (CSF). The average CSF over the 22 days so far is 8.7 while the average sensitivity ratio was 106%. This would mean that according to CSF I was 36% more sensitive to carbs yesterday or 29% less sensitive according to autosens.

Body Metrics

StartWeek 1Week 2Week 3Week 4
Weight (kilograms)75.8747574.1
Body fat percentage (according to Samsung)17.3%17.8*
Body fat percentage (according to the navy seal calculator)15%15%14.8%
Total volume
Table stating the weekly body metrics I am tracking.

Exercise

Week 1Week 2Week 3Week 4
Distance (kilometres)25.1720.5437.22
Activity (hours)4.343.655.64
Table stating the weekly exercise metrics I am tracking

Nutrition

Screenshot of average macro-nutrients consumed during week 3

Diabetes

Week 1Week 2Week 3Week 4
Low (<3.9) (%)0.90.63.5
In Range (3.9-7.8) (%)75.374.771.9
High (>= 7.8) (%)23.824.724.6
Standard deviation (SD) 1.31.71.7
Average (mmol/l)6.87.0 6.7
A1c estimation (%)5.96.05.8
Table stating the weekly diabetic metrics I am tracking.

Ideally I want to see a time-in-range (TIR – 3.9-7.8 mmol/l) exceeding 90% with an average in the low sixes and a standard deviation (SD) around one (1).

Glucose Analysis Tool

Two years ago my daughter was born. At this time I was off work for a few weeks and I had been strongly considering writing a tool that could provide some insight into managing my blood sugars, as I knew controlling my blood sugar was the best chance I had of being the best parent I cold be. At the time I was on multiple daily injections (MDI), leveraging heavily on Dr Bernstein’s teachings and using daily (if possible) exercise as a tools for glucose control.

Two years later the tool has pivoted many times, and at one time I was using machine learning (ML) to predict blood glucose during exercise, until I started using the Dexcom G6 continues glucose monitor (CGM) which was accurate enough to circumvented the need for the aforementioned tool.

At present I am using an automated insulin delivery (AID) device to deliver most of my insulin based on my shifting needs. This significantly reduces the mental burden required for good glycaemic control, as well as reduce some of the anxiety I was experiencing at meals times and when going to the doctor for diabetic checks. This system still requires manual input prior to exercise and constant tuning if you want to have the best experience, and so my tool has pivoted towards analysing this data and providing insight there.

Diabetic Metrics

An analysis of the last 4 years of my diabetic journey highlights a better A1C with a lower standard deviation (SD) indicating more consistency in blood sugars. Its interesting to note the much improved time-in-range (TIR-IN) metrics once I moved over to a insulin pump using an automated insulin delivery (AID) device.

PeriodHypo (below 3.9)In (3.9-10)High (above 10)AverageA1CSDGVIPGSPGRPGR-RiskExercise hoursKilometresPump / MDI
201919%77%3%7.76.50%2.61.2640.192.2Low16146MDI
20208%88%3%6.96.00%2.11.1917.341.6very-low67658MDI
20213%94%3%6.45.60%1.71.188.791.3very-low149920Pump (Loop) 20/11/2021
2022 (YTD)3%96%1%6.55.70%1.51.25.431.2very-low75496Pump (AAPS)
Table displaying the last few years worth of diabetic data.

For a description of some of these values mean please read this article.

Goals

My goal was to provide some insight into what was working and was not. To do this I needed to obtain blood sugar readings as well as nutritional and exercise data. I achieved this by creating a tool that obtains data from Nightscout, Strava and MyFitnessPal This data is then processed and enriched to provide insight. I then developed a tool to export some of this data and display it on my YouTube videos. I had it connected to Garmin to extract sleep and exercise data but the Garmin API failed and I have not had time to update the program.

My tool will then do some analysis to provide some insight at a per meal or per activity level by looking at metrics like time-in-range, average glucose, standard deviation, max glucose, min glucose and many more metrics.

Below are some example’s of some of the data I am exporting and using to make decisions.

This tool is very much still under constant development, as I am always finding new stats to display and bugs with some of my current code (at present both the Garmin API and the MyFitnessPal API have issues)

Below are some graphs and tables that I created in my Tool (The graphs are generated in DB Browser, these will at some stage be created in a JS library or Python graphing library).

Analysis of BG vs ISF, vs Sensitivity after a run.
Analysis of BG vs ISF, vs Sensitivity after gym.
Average TIR (time-in-range) and average blood glucose per exercise type for 2022.

Return-to-Range

I use this table to understand how quickly the system is able to reduce sugars into a normal blood sugar range. At the moment I am using 8 and 6.

Return-to-range analysis (by year)

In 2019 It took just over 6 hours to return to euglycemia (blood glucose < 6) after a peak, in 2023 I managed to reduce that to 3.2 hours.

The average time it takes to return to a blood glucose of 6 mmol/l after a peak.
The average time it takes to return to a blood glucose of 8 mmol/l after a peak.

Daily Sensitivity Analysis

I find this useful to determine if I am more sensitive to insulin on certain days, usually due to exercise.

Exercise Sensitivity Analysis

The exercise sensitivity data has been updated to be hourly for 12 hours post exercise. Its now calculated via SQL (insert statement) and not a Python function into a staging table.

APS Version Analysis

APS Version Battery Analysis

Exercise Stats Analysis (per exercise)

Exercise Stats Analysis (annual)

In the hopes of improving time-in-range while exercising I experimented with reducing insulin and used these values to provide insight into wether the changes were successful or not. In 2019 I was in-range only 66.6 of the time, in 2023 I am in-range 75%, with a slight improvement in glucose while exercising.

Treatments Analysis (per treatment)

Treatment Type Analysis

I use this table to understand how frequently I am interacting with the loop. This has little impact on the version of the variant of Android APS I am using.

Strava diabetic stats

I wanted to see diabetic statistics for each event in Strava, so I wrote a script to update the description field with some data I calculating in the Python tool. The script will check to see if the description field is populated and only update records that have no data in the description field.

Data to follow:

https://1drv.ms/u/s!AmpIRdFk1_yMgosDqE73Osiyl30ZAg?e=w9sIzl

Improvements

There are a number of improvements I am working on.

  • Web Interface

Thirty day challenge

It’s spring, and after a brief ‘almost two months’ of going off the reservation snacking at all times of day and barely exercising, I decided to check my weight. I discovered I had picked up a few kilograms since my last weigh in. After learning this, I decided that it was time for me to get my life back together and start another 30 day challenge. I find these great to provide the reason to get back into a routine.

I know that setting unrealistic goals (like losing 5kgs) isn’t going to work, so I’m going to break down my plan in to nutrition, exercise and diabetes goals.

Exercise

My plan for the month is to gym three days a week, run a minimum of 2 times per week and to mountain bike at least once a week. (So I guess I lied about setting unrealistic goals 🙂 )

Nutrition

For my meals I plan to stick to my usual low-ish carbohydrate meals during the week and try to only go coo-coo bananas on the late night snacking over the weekend. I’ll start carb-counting again as this will almost always yield the best results. This will be supplemented with 2-3 liters of water, depending on length of cardio that day.

Diabetes

Above is a chart of my starting metrics. Lets see how quickly I can improve those values. Its going to be a little bit of an unfair test as I was not carb-counting during the above period.

We want to see the In range (Time-in-range) increase and the standard deviation decrease. By doing that the average and the A1c should follow. This will mostly be achieved by the diet component of the plan. The exercise component will allow me to eat more cabs and require less insulin, as well as improve circulation, sleep, blood pressure, mood, cholesterol, memory and overall mental and physical health.

I will check in with weekly updates to ensure I keep motivated and accountable.

Video overlay description

I have been working on a repeatable process to create YouTube videos that contain my AndroidAPS (AAPS) device data stored in Nightscout. My first attempt used a Python script to export a CSV file. This needed to be started by saving a note in Nightscout, which I often forgot to do just before I started riding. My most recent update stores the devicestatus (https://your-nightscout-site/api/v1/devicestatus) API call into a database and does not require any external trigger to start the logging process. This data is updated every five (5) minutes as a calculation cycle completes in AAPS. The below is an explanation of some of the fields I am exporting.

Description of values present in the video:

  • IOB (Insulin-on-board) – The amount of active rapid-acting insulin you have in your body.
  • COB (Carbs-on-board) – The estimated number of grams of carbohydrates in your system that are waiting to be absorbed into your bloodstream
  • Basal – The primary job of basal insulin is to keep your blood glucose levels stable during periods of fasting, such as while you’re sleeping
  • Uploader battery – The battery % of the uploader device.
  • BGI (blood sugar impact) – The algorithm uses BGI (blood glucose impact) to determine when carbs are absorbed.
  • Insulin Required – The amount of insulin the algorithm calculates you require to return to a euglycemic state.
  • Finger prick BG – The blood sugar reading from a standard finger prick test.
  • Blood sugar – The CGM blood sugar value.
  • CSF (carb-sensitivity-factor) – The carb rise ratio (by some also called CSF, carb sensitivity factor) describes by how many mg/dl our glucose rises per gram of absorbed carbohydrate.
  • Dynamic ISF (insulin-sensitivity-factor) – An insulin sensitivity factor (ISF) or correction factor describes how much one unit of rapid or regular insulin will lower blood glucose. Dynamic ISF is calculated based on your total daily dose of insulin.

Omnipod Dash – Summary – Week 1&2

Its only been a week and already I feel so comforted by the barely audible click of the pump depressing the plunger in the mini pump at meal times or sporadically throughout the day. Its the sound of blood sugar control. What a week its been learning all I can about Pod changes and being woken up on day 3 by the Pod alarm alerting me its 8 hours before the Pod expires. Once expired it was interesting to note that the Pod functioned as per normal, apparently for another 8 hours.

I had a Pod on days 3 and 4 that was inserted into my leg that may have had a cannula issue, as I struggled to maintain my standard level of control.

Its been a lot easier to exercise focusing on enjoying the task rather than if I would break the pump or rip out a cannula. Having no wires makes it a lot easier to run or gym as I don’t have to worry about pump placement as much. Previously I needed to ensure I had pants with pockets or a belt clip available.

I have also found sleeping a little easier, as I can barely notice the pump If I roll over onto it.

Flank insertion.
Boost Omnipod – Time in Range (3.9 -7.8 mmol/l)
Boost Omnipod – Time in Range (3.9 – 10 mmol/l)

Unannounced meals

I decided to test the system with unannounced meals consisting of 40g of carbs or less. I am a bit of a control freak when it comes to diabetes so I have been postponing testing this for a long time. The results were outstanding. I will be writing more about this in the future, including any automations I use or test.

Boost Omnipod – UAM – Time in Range (3.9 -7.8 mmol/l)

Boost Omnipod – UAM – Time in Range (3.9 – 10 mmol/l)

Unannounced meals – Week 1

I started testing unannounced meals in Android APS on Saturday 30 July 2022. I am a bit of a control freak and really couldn’t believe that a system could manage my diabetes better than I could. I had more information available to me to make more informative decisions “I would tell myself”. But I seem to be wrong, well at least partly. I am using a branch of AAPS that delivers insulin early, but I found that managing protein and fat was more problematic than carbs seemed to be. Stubborn high blood sugar that seemed to take a few hours to correct. So I decided to do a little testing with automatons to try and improve those numbers.

Boost UAM stats (Time in range 3.9-7.8 mmol/l)
Boost UAM stats (Time in range 3.9-10 mmol/l)

Announcing carbs and pre-bolusing

Eerm…what? How is this possible? It seems with accurate carb counting I still cant account for digestion times as well as AAPS can.

Automations

I use two (2) automations to try and manage my readings more closely. These automations are over and above the Boost logic that provides insulin earlier than the standard code.

The first automation simply sets a lower target when my reading is above 7.8 mmol/l AND not dropping. This allows AAPS to bring down my readings more quickly.

The second is to try and compensate for protein and fat in the low carb meals I eat. This automation will activate if

  • my reading is above 6.5 mmol/l AND
  • between meal times AND
  • my reading isn’t dropping AND
  • there is active resistance detected (not sure if this even matters)

My hypothesis is that the system can detect the resistance post the meal window but I need to test this assertion further.

Omnipod Dash

I decided to purchase the Omnipod Dash trial pack of 10 pods for $30 AUD to see what all the hype was about. It turns out the hype is warranted, as this is an incredible little system. I’m very excited to use the device under a multitude of conditions and I hope that my experience can be informative. My main testing criteria will be connectivity, recovery in the unlikely event a Pod is damaged, robustness during various activity, water resistance and general day-to-day activity including time with my two year old daughter.

Benefits

The pump system operates much the same as any other pump system available, with the main difference being that the pump and cannula are all part of the same physical unit. This is a huge advantage for sports, but can be noticeable while changing clothes, going to the toilet or during sexy time. The unit is so small its presence is barely noticeable.

Omnipod Dash.

Sugar Management stats (So far)

I am very pleased (and surprised to be honest) that I am using 28% less insulin on the Pods with improved (+9.3%) blood sugar control (Time in Range 3.9-7.8 mmol/l). I noticed far fewer super micro boluses (SMBs) being administered than before, but maybe that is due to me letting AAPS do more of the work in managing my sugars through unannounced meals (UAM).

Management Stats from Nightscout for the duration of the experiment so far. TIR = 3.9-7.8 mmol/l
Total daily dose (TDD) and carbs average for the duration of the experiment.

Note: I am not adding in all the carbs I am eating as I am using announced meals in AAPS.

The Ambulatory Glucose Profile (AGP) enables retrospective analysis of dense data, trends and
patterns for the duration of the experiment.
Management Stats from Nightscout for the week prior to the experiment so far. TIR = 3.9-7.8 mmol/l
Total daily dose (TDD) and carbs average for the week prior to the experiment.
The Ambulatory Glucose Profile (AGP) enables retrospective analysis of dense data, trends and
patterns for the week prior to the experiment.
Management Stats from Nightscout for the duration of the experiment so far. TIR = 3.9-10 mmol/l
Screenshot from AAPS highlighting the SMB’s.

Android APS Setup

Setup of the Pod system in Android APS (AAPS) Boost Master 3.6.4 was surprisingly easy and intuitive. I just followed the Prompts after going to the configuration builder and selecting Dash as the pump.Its a very similar process for Eros pods, with the added requirement to pair the OrangeLink / RileyLink device.

Setup Instructions

Installed Pod

Installed Pod
Dash page within AAPS
Dash page within AAPS.

Errors

I had an error starting the pod, but after hitting retry multiple times the pod activated and all was working as expected

Exercise

Exercise has been a lot more enjoyable without all the wires and having to worry about pump placement or damage. If I mountain bike and fall off (which happens every now and again) I lose one pod, and not an entire pump. Having more pocket space and less to carry is an added benefit.

Whats next?

I plan to test the pod while resistance training, mountain biking, running and the most intense sport I play, wrangling my two year old. If she cant destroy them, they are indestructible 🙂

Android APS – Adjusting Boost after testing AIMI

An interesting set of results from my time with Boost. I cant wait to return to AIMI with what I have learned.

I was eating slightly less carbs (118g vs. 136g) than when I was using AIMI, but I would expect that if your profile is setup correctly that the amount of carbs shouldn’t have much of an impact on performance metrics. I was running into a few hypos so I lowered the algorithms insulin required percentage (70% vs. 100%) which resulted in a whopping 1.6% decrease (57 minutes vs. (288 minutes / 4.8 hours)) of time spent in a hypoglycaemic state while using Boost.

My standard deviation was slightly lower (1.3 vs. 1.4) signifying less fluctuations between readings while my time in a hyperglycaemic state went up 0.6% (25.2 hours vs. 26.6 hours)).

I did have to turn off “enable boost percentage scale” as this was providing too much insulin, but more experimenting could remedy this.

Another interesting observation was that my ratio between total daily dose (TDD) and total carbs eaten went down from 4.2 to 4.01 (grams of carbs per unit of insulin) as my average blood sugar lowered.

My exercise seems to have stayed pretty consistent during testing (as per the table below) which leads me to believe the reduced insulin need may be related to requiring less insulin when blood sugar is euglycemic. Its going to be a little more difficult to track that for the next few weeks as I am preparing to ramp up training for the Southern Cross 10km in July. The training has however provided an opportunity to fine tune my running routine as outlined here in my post about predicting blood sugars while running.

I cant wait to do some further testing with AIMI, Boost and Eating now.

Table of performance metrics from when I was MDI to the latest build of Boost.
Boost Stats (70% insulin required)
AIMI Stats (100% insulin required)
Boost TIR stats 3.9 – 10mmol/l
Exercise table (stats derived from Strava and Python scripts)

Predicting blood sugars while exercising.

I recently posted about how my experimenting with running using AAPS was progressing. I observed that under certain conditions there was a significant lag between the capillary blood and CGM readings at about the 30 minute mark. This sparked some interest in wanting to know if I could predict what my capillary blood sugar could be using machine learning. I’m still not sure if its entirely possible yet, but I am having fun trying, and I have learned a lot in the process. I’m currently working on the script that will allow me to overlay a lot more AAPS data during a workout, including predictions.

I am getting a lot better at managing blood sugars as I noticed the last 14 exercises I was in range (3.9-7.8) 100% of the time.

Python script data capture

I have changed my approach slightly towards eating before exercise and have piggy backed off some research done by Gary Scheiner to create a spreadsheet that estimates the carbs required and effort for a run.

https://wordpress.com/post/t1daaps.wordpress.com/482