Its only been a week and already I feel so comforted by the barely audible click of the pump depressing the plunger in the mini pump at meal times or sporadically throughout the day. Its the sound of blood sugar control. What a week its been learning all I can about Pod changes and being woken up on day 3 by the Pod alarm alerting me its 8 hours before the Pod expires. Once expired it was interesting to note that the Pod functioned as per normal, apparently for another 8 hours.
I had a Pod on days 3 and 4 that was inserted into my leg that may have had a cannula issue, as I struggled to maintain my standard level of control.
Its been a lot easier to exercise focusing on enjoying the task rather than if I would break the pump or rip out a cannula. Having no wires makes it a lot easier to run or gym as I don’t have to worry about pump placement as much. Previously I needed to ensure I had pants with pockets or a belt clip available.
I have also found sleeping a little easier, as I can barely notice the pump If I roll over onto it.
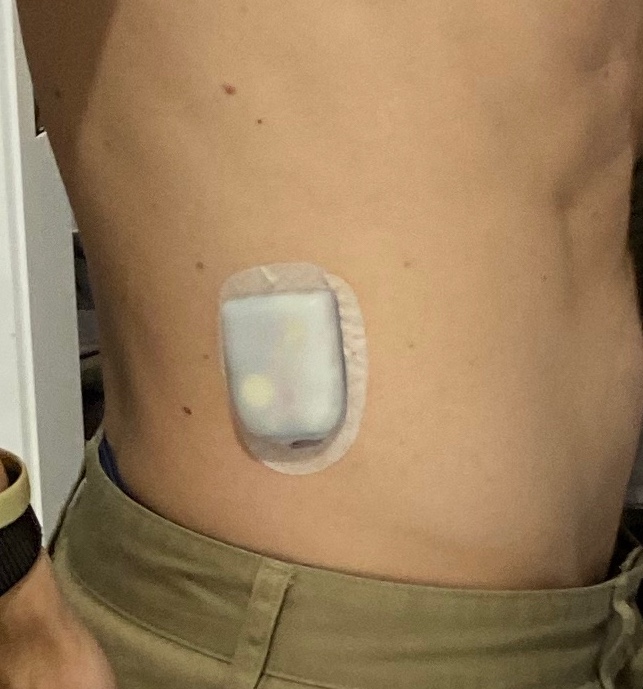
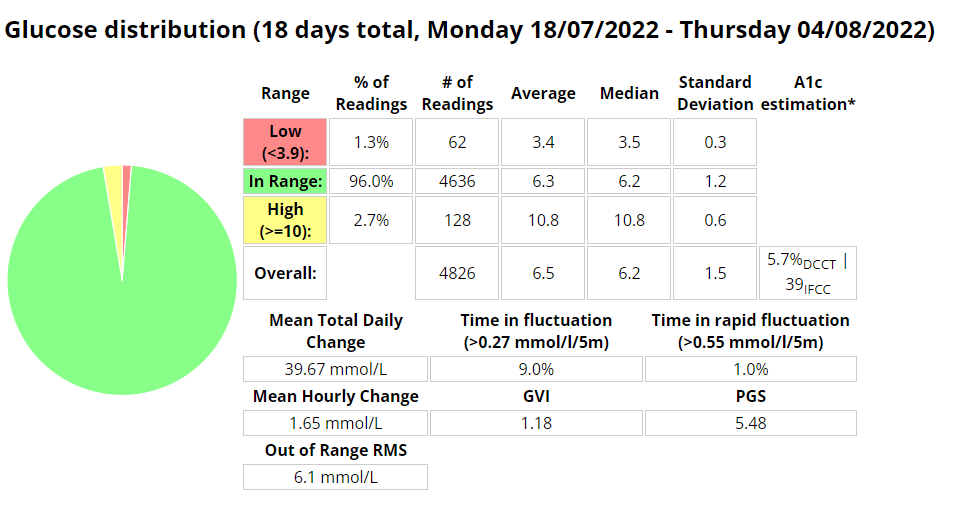
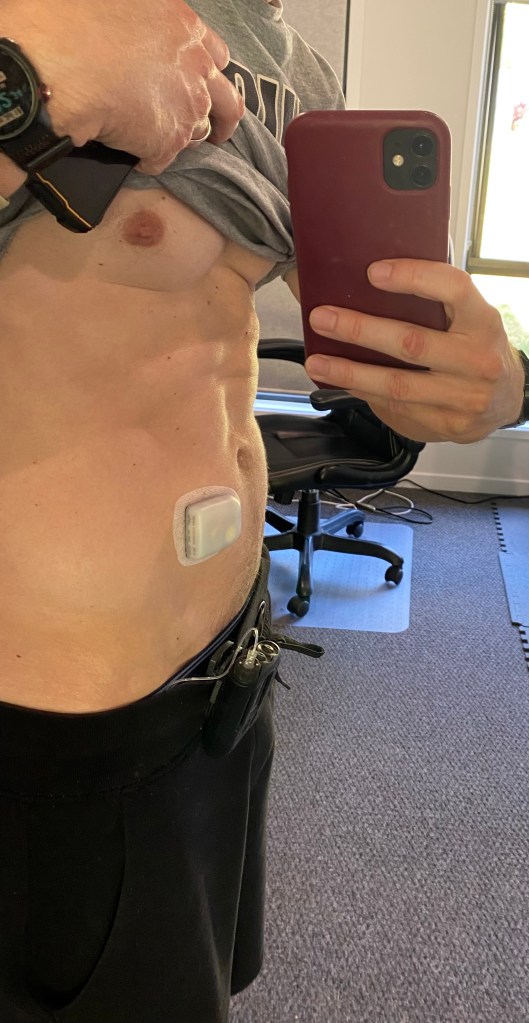
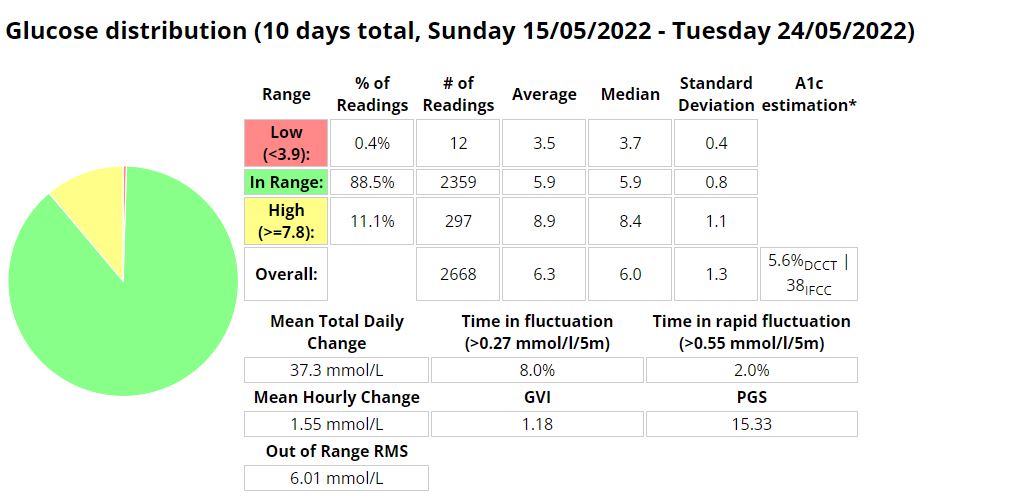
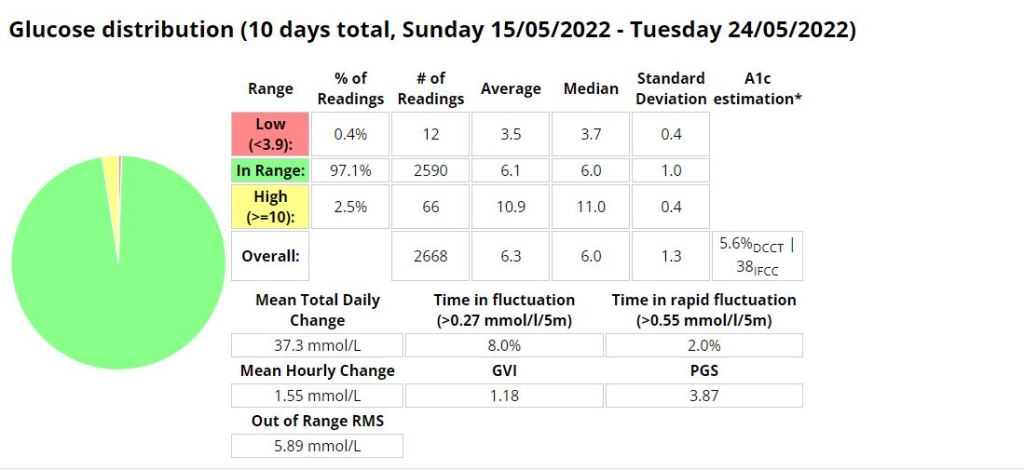
Flank insertion. Boost Omnipod – Time in Range (3.9 -7.8 mmol/l)Boost Omnipod – Time in Range (3.9 – 10 mmol/l)
Unannounced meals
I decided to test the system with unannounced meals consisting of 40g of carbs or less. I am a bit of a control freak when it comes to diabetes so I have been postponing testing this for a long time. The results were outstanding. I will be writing more about this in the future, including any automations I use or test.
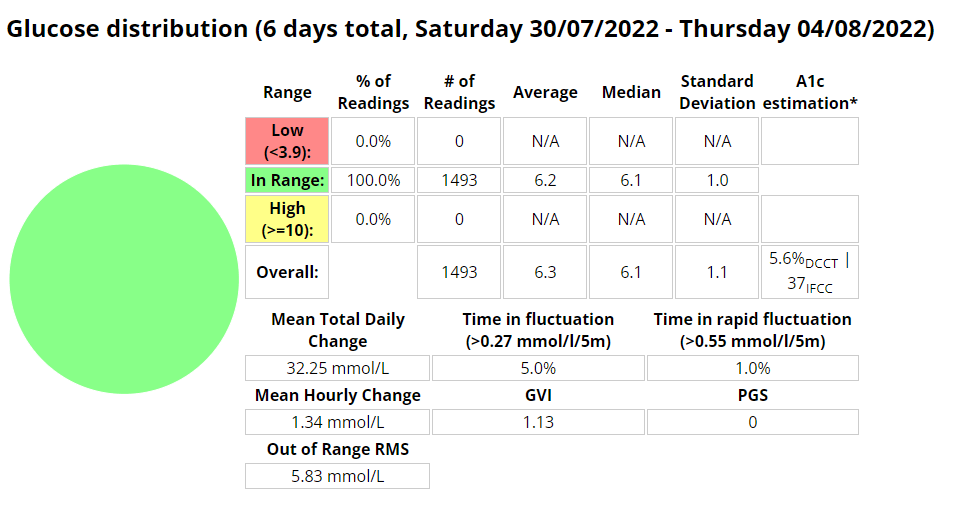
Boost Omnipod – UAM – Time in Range (3.9 -7.8 mmol/l)
Boost Omnipod – UAM – Time in Range (3.9 – 10 mmol/l)
The efficacy of any AID (Automated Insulin Delivery) device is directly proportional to the amount of insulin it provides in relation to your needs, and everybody’s needs are slightly different. To ensure safety the native AAPS loop only administers 50% of the calculated insulin requirement per loop cycle. This limitation can be overcome by using one of the branches I mention below, or by profile switching, using temp targets and automations.
AIMI
Pros:
A ton of unique features seen nowhere else (dynamic SMBRatio, DIA change for every SMB or Bolus, if TIR above 180 during the last two hours and up of 30 % the profile during the next hour if it’s still the case,if the TIR below 75 one hour before and reduce the profile during the next hour,calculation to propose one basal value for the day,A new function is working, after the manual bolus > iTime_starting_bolus, AIMI will force the basal 500% during the next 20 minutes.)
Frequent updates
A lot of collaboration with the diabetic community.
Cons
The DEV branch takes much longer to calculate cob using my KK mini 2. This can result in periods where I think insulin may be delivered later than preferred.
The battery life of your loop device is significantly impacted due to multiple calculations.
Watch seems to be less stable with more periods of stale data
More frequent pump disconnects.
Thoughts: I don’t think I gave this a fair go. I should have adjusted to use less insulin. I think this is more suitable to people using UAM.
AIMIAIMI
BOOST
Pros:
Best control I have ever had
Adjustable and scalable insulin required percent (SMBRatio). example. You can set Boost to provide 75% of the required insulin %, but if the glucose deltas are greater that percentage can increase to a maximum of 150%.
The setup process is straight forward.
Cons:
Less frequent updates
Thoughts: Suitable for people who enter carbs or who use UAM. Works well with Dash pods.
BOOSTBoost
Eating Now
Pro:
Frequent updates
A lot of unique features seen nowhere else (too many to mention here, read the docs)
Excellent documentation
The reasons (device status) behind why the system is adjusted are well documented and clear in the loop status and the documentation.
Lots of safety functions in the code.
Con:
You can adjust insulin required percentage but its (as far as I am aware) a static value.
Thoughts: Works extremely well when entering carbs and pre-bolusing.
I started testing unannounced meals in Android APS on Saturday 30 July 2022. I am a bit of a control freak and really couldn’t believe that a system could manage my diabetes better than I could. I had more information available to me to make more informative decisions “I would tell myself”. But I seem to be wrong, well at least partly. I am using a branch of AAPS that delivers insulin early, but I found that managing protein and fat was more problematic than carbs seemed to be. Stubborn high blood sugar that seemed to take a few hours to correct. So I decided to do a little testing with automatons to try and improve those numbers.
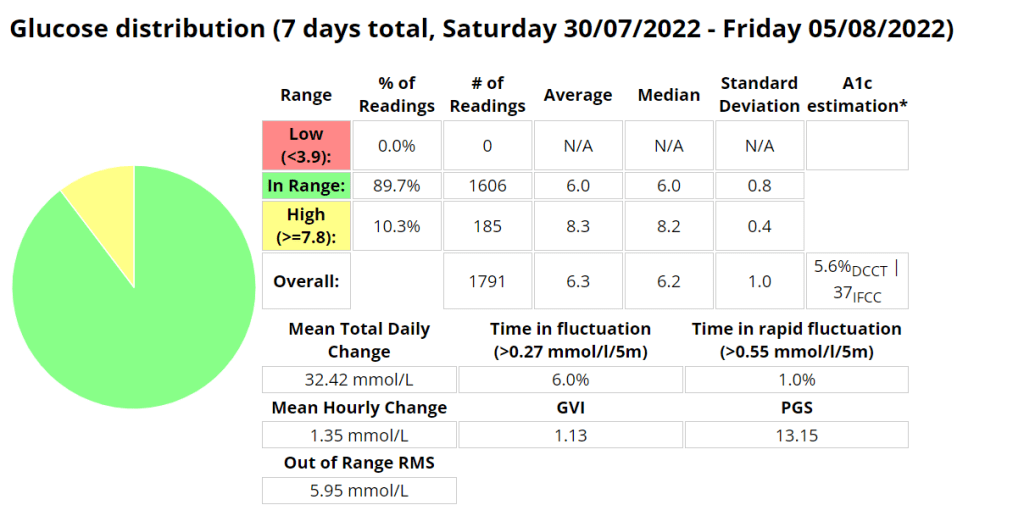
Boost UAM stats (Time in range 3.9-7.8 mmol/l)
Boost UAM stats (Time in range 3.9-10 mmol/l)
Announcing carbs and pre-bolusing
Eerm…what? How is this possible? It seems with accurate carb counting I still cant account for digestion times as well as AAPS can.
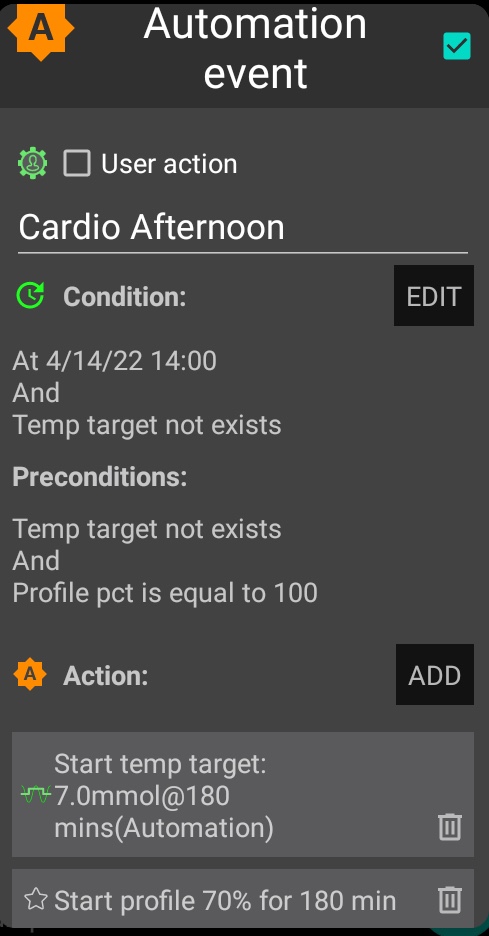
Automations
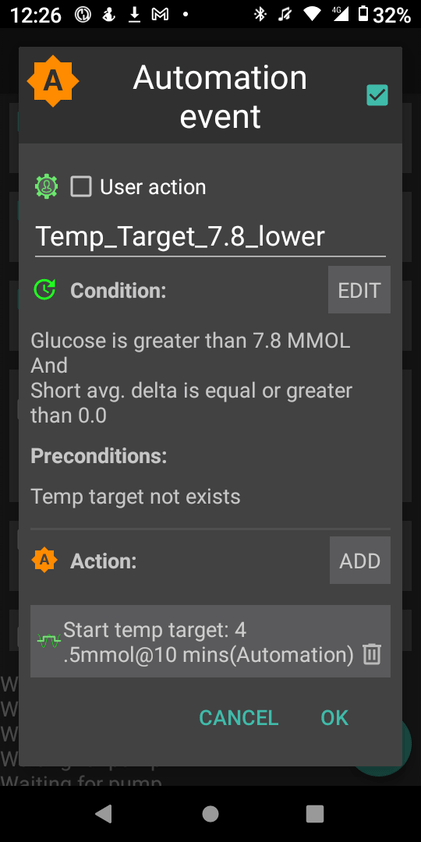
I use two (2) automations to try and manage my readings more closely. These automations are over and above the Boost logic that provides insulin earlier than the standard code.
The first automation simply sets a lower target when my reading is above 7.8 mmol/l AND not dropping. This allows AAPS to bring down my readings more quickly.
The second is to try and compensate for protein and fat in the low carb meals I eat. This automation will activate if
my reading is above 6.5 mmol/l AND
between meal times AND
my reading isn’t dropping AND
there is active resistance detected (not sure if this even matters)
My hypothesis is that the system can detect the resistance post the meal window but I need to test this assertion further.
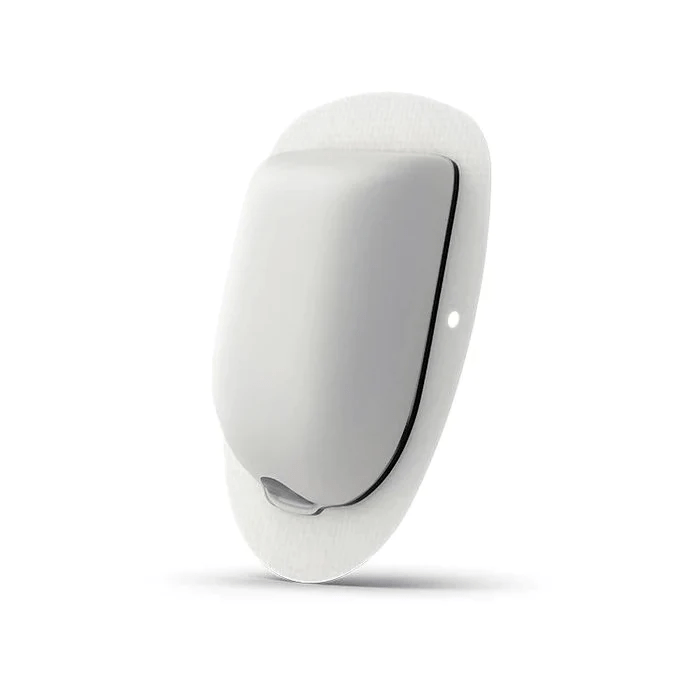
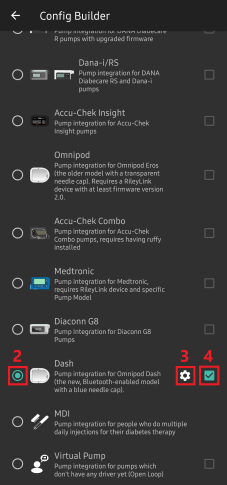
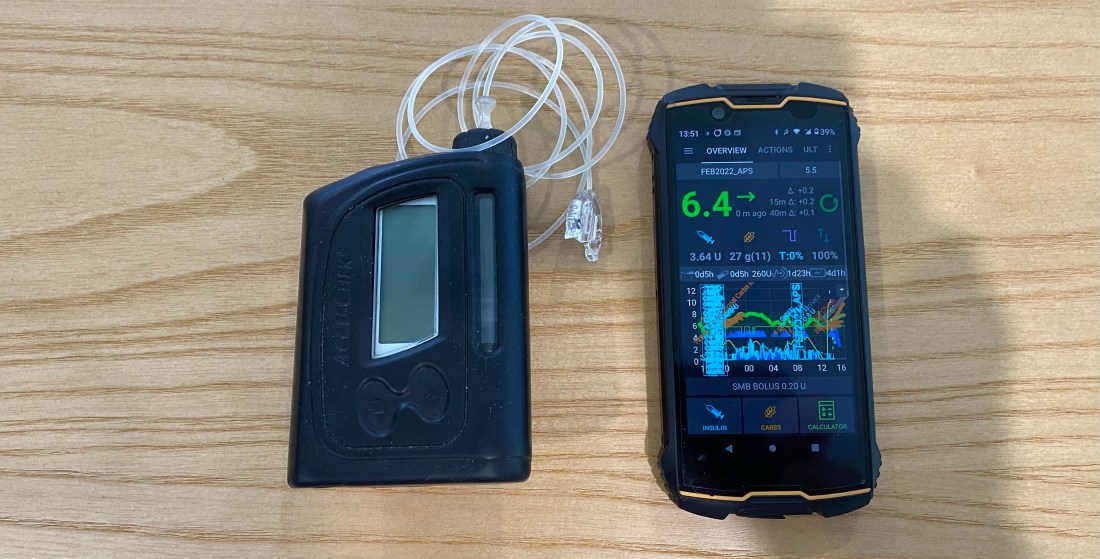
I decided to purchase the Omnipod Dash trial pack of 10 pods for $30 AUD to see what all the hype was about. It turns out the hype is warranted, as this is an incredible little system. I’m very excited to use the device under a multitude of conditions and I hope that my experience can be informative. My main testing criteria will be connectivity, recovery in the unlikely event a Pod is damaged, robustness during various activity, water resistance and general day-to-day activity including time with my two year old daughter.
Benefits
The pump system operates much the same as any other pump system available, with the main difference being that the pump and cannula are all part of the same physical unit. This is a huge advantage for sports, but can be noticeable while changing clothes, going to the toilet or during sexy time. The unit is so small its presence is barely noticeable.
Omnipod Dash.
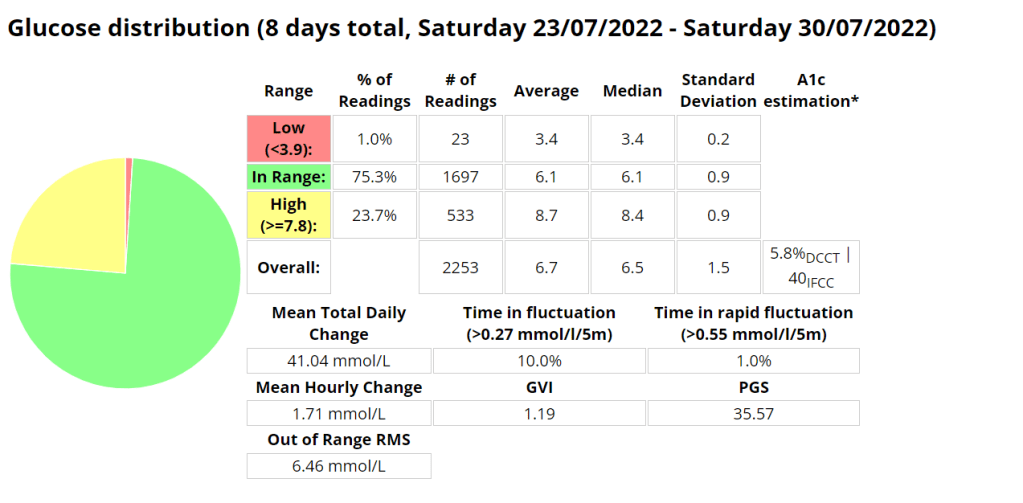
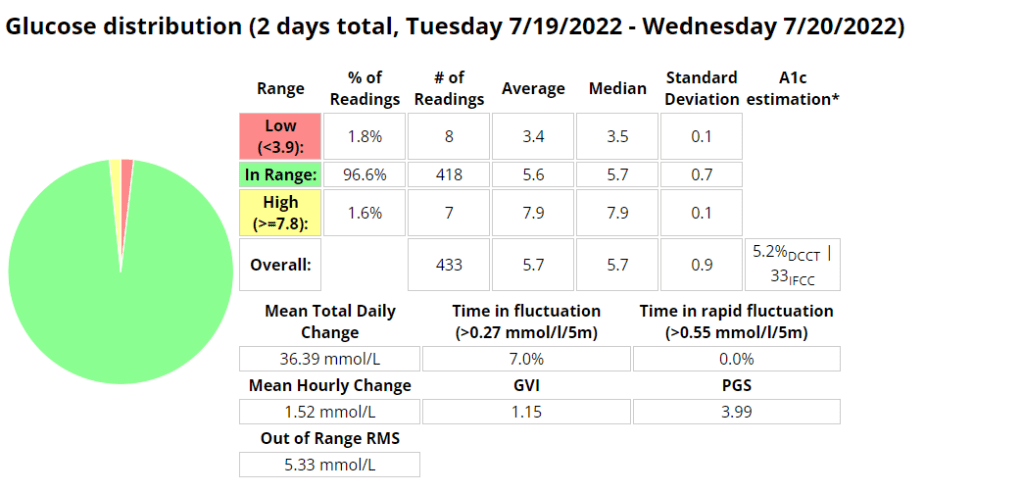
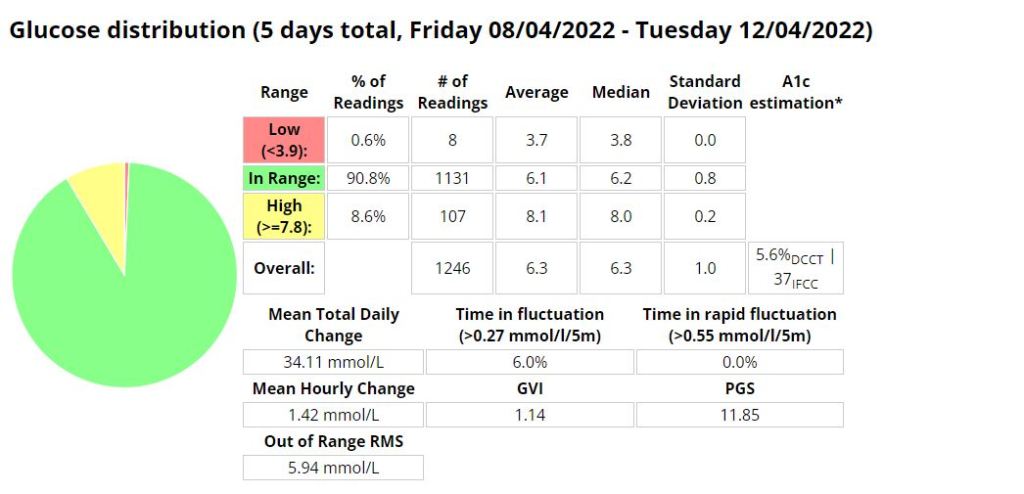
Sugar Management stats (So far)
I am very pleased (and surprised to be honest) that I am using 28% less insulin on the Pods with improved (+9.3%) blood sugar control (Time in Range 3.9-7.8 mmol/l). I noticed far fewer super micro boluses (SMBs) being administered than before, but maybe that is due to me letting AAPS do more of the work in managing my sugars through unannounced meals (UAM).
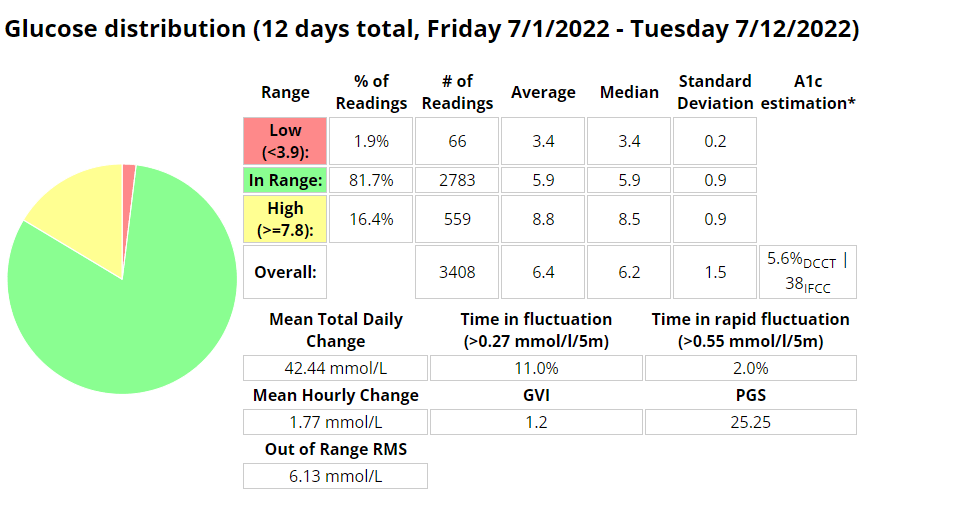
Management Stats from Nightscout for the duration of the experiment so far. TIR = 3.9-7.8 mmol/l
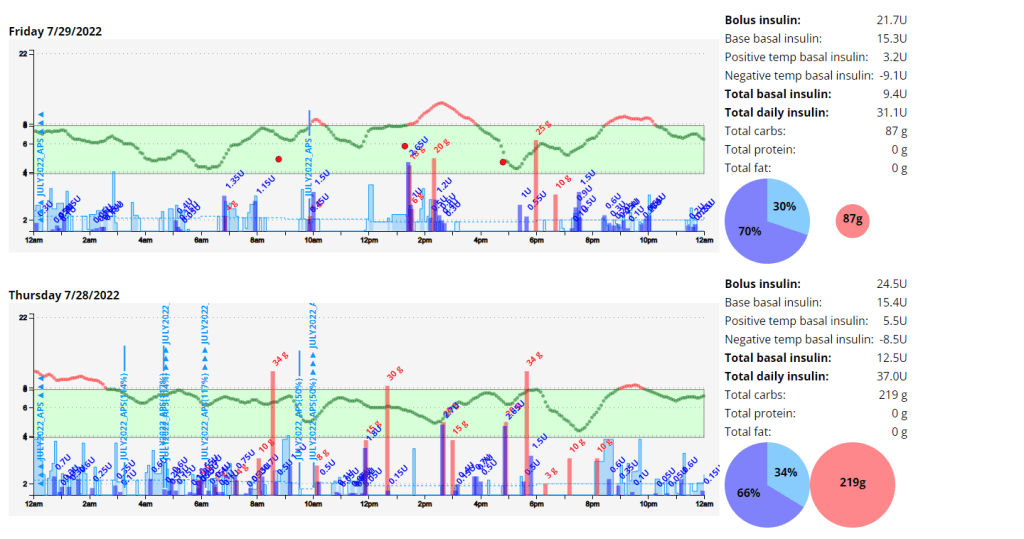
Total daily dose (TDD) and carbs average for the duration of the experiment.
Note: I am not adding in all the carbs I am eating as I am using announced meals in AAPS.
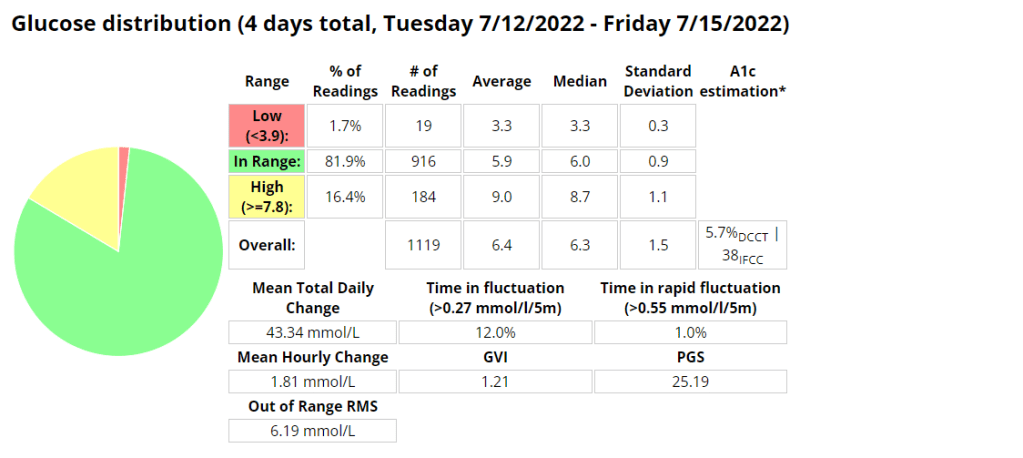
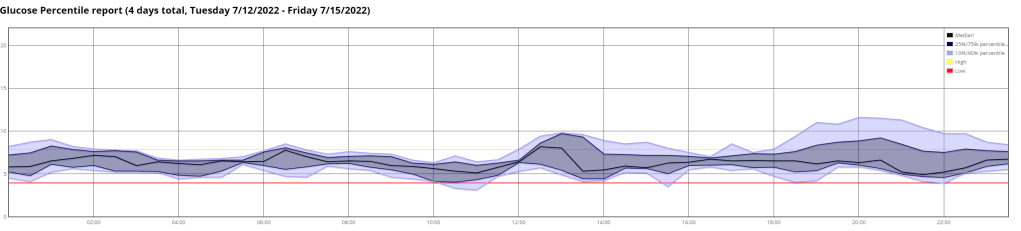
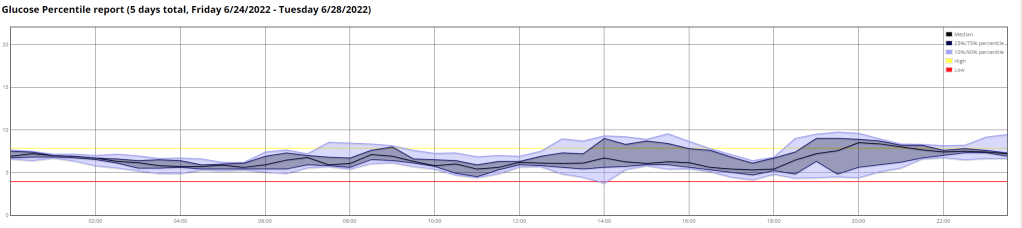
The Ambulatory Glucose Profile (AGP) enables retrospective analysis of dense data, trends and patterns for the duration of the experiment. Management Stats from Nightscout for the week prior to the experiment so far. TIR = 3.9-7.8 mmol/l
Total daily dose (TDD) and carbs average for the week prior to the experiment.
The Ambulatory Glucose Profile (AGP) enables retrospective analysis of dense data, trends and patterns for the week prior to the experiment. Management Stats from Nightscout for the duration of the experiment so far. TIR = 3.9-10 mmol/l
Screenshot from AAPS highlighting the SMB’s.
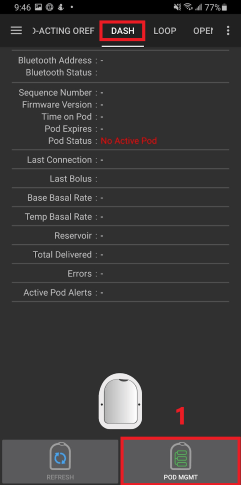
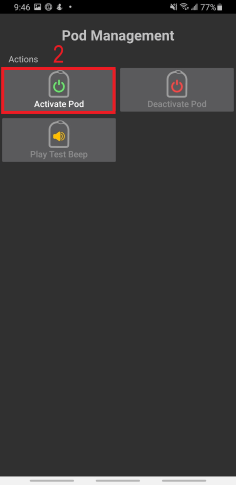
Android APS Setup
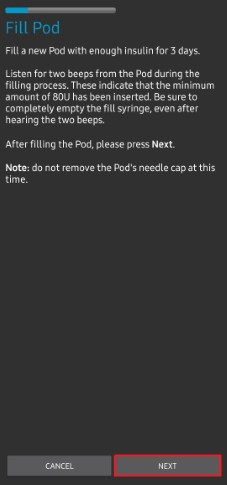
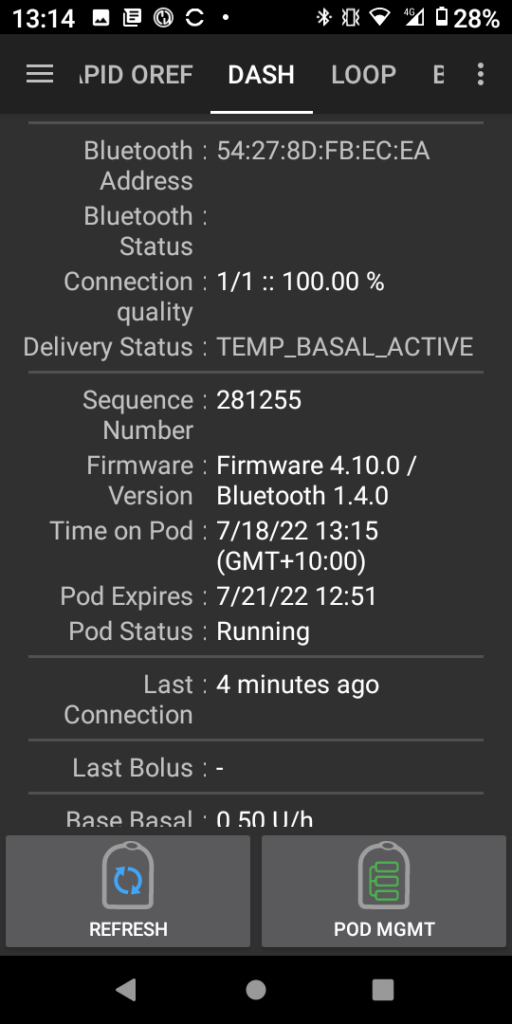
Setup of the Pod system in Android APS (AAPS) Boost Master 3.6.4 was surprisingly easy and intuitive. I just followed the Prompts after going to the configuration builder and selecting Dash as the pump.Its a very similar process for Eros pods, with the added requirement to pair the OrangeLink / RileyLink device.
I had an error starting the pod, but after hitting retry multiple times the pod activated and all was working as expected
Exercise
Exercise has been a lot more enjoyable without all the wires and having to worry about pump placement or damage. If I mountain bike and fall off (which happens every now and again) I lose one pod, and not an entire pump. Having more pocket space and less to carry is an added benefit.
Whats next?
I plan to test the pod while resistance training, mountain biking, running and the most intense sport I play, wrangling my two year old. If she cant destroy them, they are indestructible 🙂
An interesting set of results from my time with Boost. I cant wait to return to AIMI with what I have learned.
I was eating slightly less carbs (118g vs. 136g) than when I was using AIMI, but I would expect that if your profile is setup correctly that the amount of carbs shouldn’t have much of an impact on performance metrics. I was running into a few hypos so I lowered the algorithms insulin required percentage (70% vs. 100%) which resulted in a whopping 1.6% decrease (57 minutes vs. (288 minutes / 4.8 hours)) of time spent in a hypoglycaemic state while using Boost.
My standard deviation was slightly lower (1.3 vs. 1.4) signifying less fluctuations between readings while my time in a hyperglycaemic state went up 0.6% (25.2 hours vs. 26.6 hours)).
I did have to turn off “enable boost percentage scale” as this was providing too much insulin, but more experimenting could remedy this.
Another interesting observation was that my ratio between total daily dose (TDD) and total carbs eaten went down from 4.2 to 4.01 (grams of carbs per unit of insulin) as my average blood sugar lowered.
My exercise seems to have stayed pretty consistent during testing (as per the table below) which leads me to believe the reduced insulin need may be related to requiring less insulin when blood sugar is euglycemic. Its going to be a little more difficult to track that for the next few weeks as I am preparing to ramp up training for the Southern Cross 10km in July. The training has however provided an opportunity to fine tune my running routine as outlined here in my post about predicting blood sugars while running.
I cant wait to do some further testing with AIMI, Boost and Eating now.
Table of performance metrics from when I was MDI to the latest build of Boost.
Boost Stats (70% insulin required)
AIMI Stats (100% insulin required)
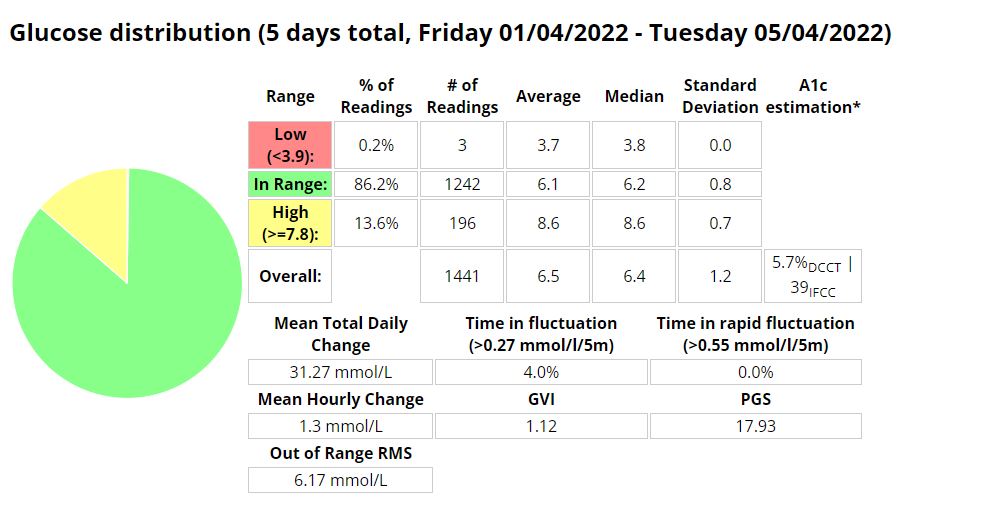
Boost TIR stats 3.9 – 10mmol/l
Exercise table (stats derived from Strava and Python scripts)
I recently posted about how my experimenting with running using AAPS was progressing. I observed that under certain conditions there was a significant lag between the capillary blood and CGM readings at about the 30 minute mark. This sparked some interest in wanting to know if I could predict what my capillary blood sugar could be using machine learning. I’m still not sure if its entirely possible yet, but I am having fun trying, and I have learned a lot in the process. I’m currently working on the script that will allow me to overlay a lot more AAPS data during a workout, including predictions.
I am getting a lot better at managing blood sugars as I noticed the last 14 exercises I was in range (3.9-7.8) 100% of the time.
Python script data capture
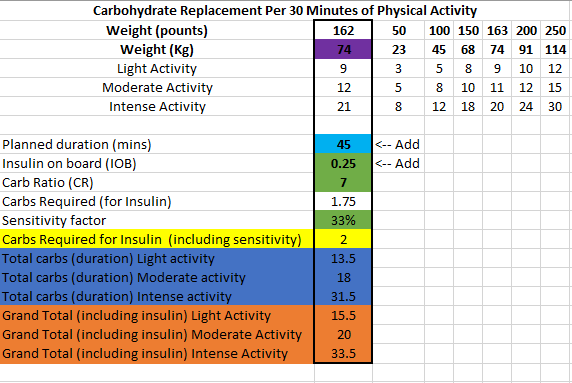
I have changed my approach slightly towards eating before exercise and have piggy backed off some research done by Gary Scheiner to create a spreadsheet that estimates the carbs required and effort for a run.
Dynamic ISF is all the buzz in the diabetic community at the moment, and so it should be! In the first few days of using it I was able to see marked improvements with little to no intervention as the algorithm scaled my correction doses.
What is Dynamic ISF
Your insulin sensitivity factor (ISF) is how much one unit of insulin will lower your blood glucose. Simply put dynamic ISF uses your total daily dose (TDD) of insulin to scale this value depending on blood sugar.
My results
So far the results have been astoundingly positive.
Before D-ISF : Average TDD: 30.1, Average Carbs :138gUsing D-ISF: Average TDD: 25.1, Average Carbs :102g
Update:
Using D-ISF for one (1) month. A little bit of an unfair test as I had 3 sensors fail during this period, which resulted in many issues with sensor accuracy.
Formula
ISF = 277700 / ( BG * TDD )
Differences in the GUI (when using DEV)
As you can see in the picture below, the yellow square highlights the time the loop last ran, and the red square shows the profile ISF vs. the calculated dynamic ISF.
Home screen of AAPS
It’s interesting to note that the D-ISF code isn’t implemented when using the calculator, its only actively scaling ISF using SMB’s (and maybe basal %). This will mean your normal profile ISF is going to be used when eating a meal. If you have never tested your ISF It may be worth while checking what the scaled ISF is at meal time (provided your BG is perfect) and setting your profile to that value if the values are vastly different. This is also providing that you aren’t in a period of significant resistance or sensitivity.
The Dynamic ISF plugin you will obtain in the config builder of the Dev code.
Where do I get a copy of the AAPS Dynamic ISF branch
It is in the same repository as the standard (master) version of AAPS. In order to use it you will need to select a different branch of AAPS (dev) and build that branch. I suggest you read Tim Streets repo notes for a more in depth description of the code and its functionality, even though you will not require the code from that repository. You will need to enable engineering mode on the phone in order to utilise the dev branch.
In preparation for my cycle I started an automation to prepare my body for the impending exercise. This automation reduces my basal insulin ( as well as scale the rest of my management metrics) by 30% and set a temporary target (TT) of 7mmol/l. AAPS will not allow me to automate a profile % shift of more than 30%, so I reduced the profile a further 5% manually in AAPS an hour before the ride.
Exercise Metrics:
Garmin exercise stats
Blood Glucose:
Interestingly, AAPS stopped basal for a long period and allowed the IOB to runs its course.
My blood glucose held quite steady despite a mixture of anaerobic and aerobic levels of activity and so I didn’t need to consume any carbohydrates. Hopefully future attempts are as successful as this one.
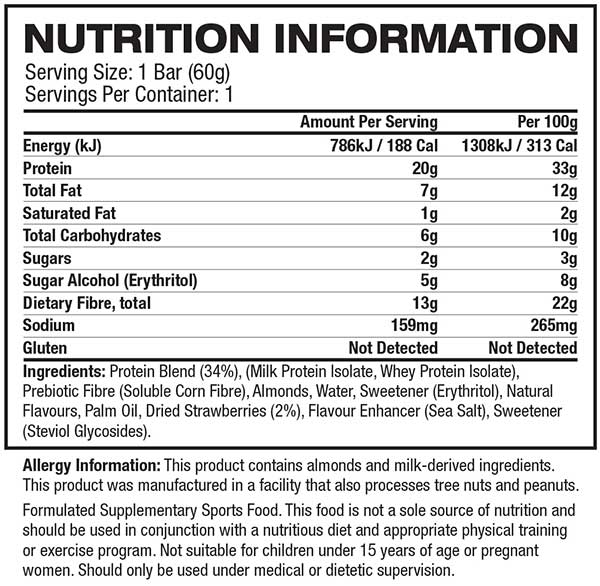
Is the Quest protein bar type 1 diabetic friendly? Yes I think it is, read more below to discover why I think it is.
Review
Nutritional Information
Insulin Strategy
Goal
Results
When trying anything new I always read the nutritional information on order to determine the impact it will have on my body. Certain high fat foods can cause insulin resistance and inflammation and will delay gastric emptying while protein will digest and get synthesised into carbohydrates.
Below are two great resources you should read before deciding on your final dosing strategy. Its important to note that in Australia, most items don’t have total carbohydrate count that includes fibre and sugar alcohol, which can make it difficult to assess the impact of products that don’t list sugar alcohols in the nutritional information.
Based on the nutritional information above, my inulin to carb ratio and my proximity to recent exercise I decided to inject as follows; I didn’t input my eCarbs for the protein as I knew that AAPS would be able to manage. Read my post for injecting for protein and fat if you are not on an AAPS or experience elevated blood glucose two (2) hours after eating.
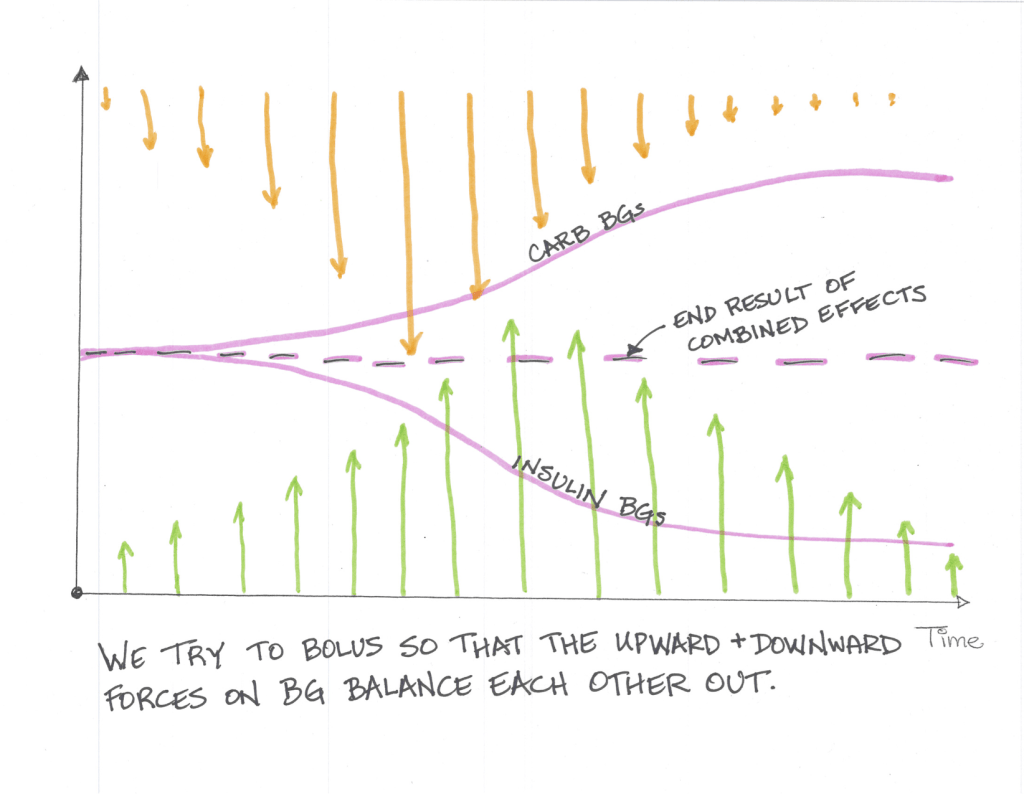
Goal
The goal of any insulin strategy would be to inject enough insulin at the correct time so that the upward force the carbohydrates exert is counteracted by the downward force the insulin exerts and you stay in range for the duration of the meal.
To analyse this I use three (3) values, standard deviation, time in range (TIR) and Coefficient of the variation. These three (3) values will assist you in determining how good or bad a meal was for you in terms of blood sugar impact (BGI).
Time in Range (TIR): For TIR we are looking for a high percentage of your readings within a normal (I use 3.9-7.8 mmol/l ) range.
Standard Deviation: For standard deviation I look for values under 1 as a meal that has little to no blood glucose impact (BGI).
Coefficient of the variation (CV): Is the standard deviation divided by the average glucose. Its a measure that helps normalise the results by reducing the influence on average glucose. Most studies indicate that anything under 33% is good.
As we can see by the table below that this snack consumed with the correct insulin strategy resulted in very stable blood glucose over a number of hours, with little deviation. What should be noted is that the sugar alcohol started to effect readings after 3 hours and that 1 hour prior to consumption I had exercised. The exercise would have increased my insulin sensitivity.
Time in Range (TIR): 100%
Standard Deviation: 0.38
Coefficient of the variation (CV): 0.06
Read my post on some common foods I eat to gain a better understanding of how this meal impacted me in comparison.
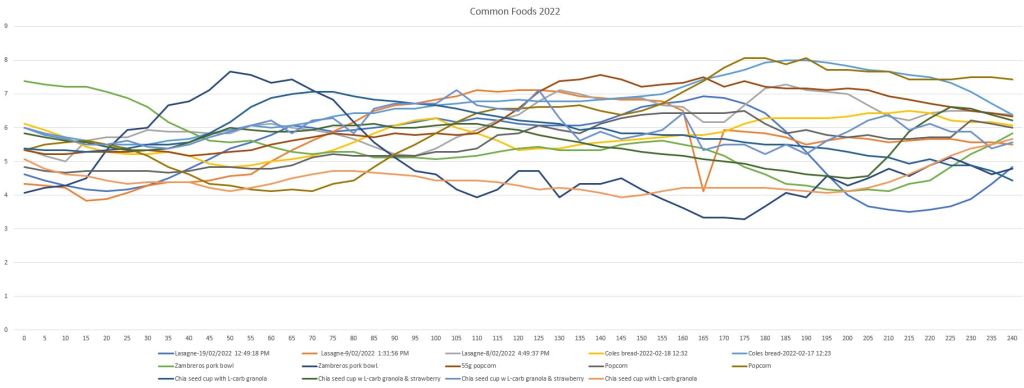
The below is a list of foods I commonly eat that I decided to analyse. I have listed some lower-carb high protein meals, snacks and a few higher-carb meals. These are all more regular meals so I have had the opportunity to adjust my insulin strategy to better cover the various aspects of the meal.
Part of my strategy is to adjust the insulin timing (pre-bolus), starting BG (using temp targets or exercise) and the amounts of insulin used. The amount of insulin used needs to be adjusted based on the macronutrient composition, the amount of fibre and the amount of sugar alcohol in your meal. Sugar alcohols are often not listed on food labels in Australis and those foods should be avoided. Read my post on injecting for protein and fat for a better understanding of how your insulin dose will need to be adjusted to compensate for protein and fat.
To analyse a meal I use three (3) values, standard deviation, time in range (TIR) and Coefficient of the variation. These three (3) values will assist you in determining how good or bad a meal was for you in terms of blood sugar impact (BGI). You can also use the difference between the 3 hour and 5 hour standard deviations to ascertain if you are covering gluconeogenesis correctly.
Time in Range (TIR): For TIR we are looking for a high percentage of your readings within a normal (I use 3.9-7.8 mmol/l ) range.
Standard Deviation: For standard deviation I look for values under 1 as a meal that has little to no blood glucose impact (BGI).
Coefficient of the variation (CV): Is the standard deviation divided by the average glucose. Its a measure that helps normalise the results by reducing the influence on average glucose. Most studies indicate that anything under 33% is good. The lower the number the better the outcome.