| Week no. | Distance | Elapsed time | Avg HR | TIR (3.9 – 7.8) (%) | Average Blood Glucose (mmol/l) | Coefficient of variation (%) | Strava Fitness Metric |
|---|---|---|---|---|---|---|---|
| Week 10 | 32 | 257 | 132 | 69 | 7.0 | 12.0 | 37 |
| Week 9 | 36.29 | 242.65 | 133.95 | 87 | 5.0 | 17.0 | 42 (+5) |
| Week 8 | 34.1 | 240.94 | 152.9 | 79.87 | 6.0 | 3.1 | 45 (+3) |
| Week 7 | 67.5 | 295.01 | 136.46 | 96.0 | 6.2 | 9.0 | 54 (+9) |
| Week 6 | 46.36 | 340.12 | 133.0 | 73.56 | 7.3 | 16.2 | 53 (-1) |
| Week 5 | 40.57 | 224.91 | 142.6 | 89.43 | 6.4 | 12.2 | 55 (+2) |
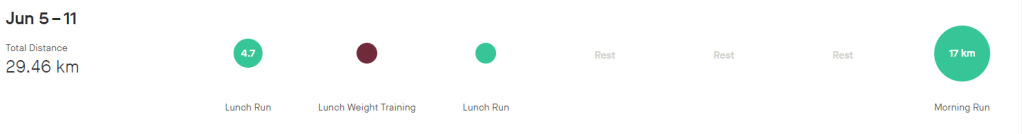
| Week 4 | 29.46 | 208.03 | 140.2 | 90.0 | 6.2 | 9 | 54 (-1) |
| Week 3 | 8.75 | 73.37 | 142.9 | 100.0 | 6.0 | 8.7 | 49 (-5) |
| Week 2 | 23.14 | 146.82 | 153.63 | 50.0 | 6.8 | 18.6 | 48 (-1) |
| Week 1 | 25.4 | 169 | 148 | 60 | 8.4 | 22 | 51 (+3) |
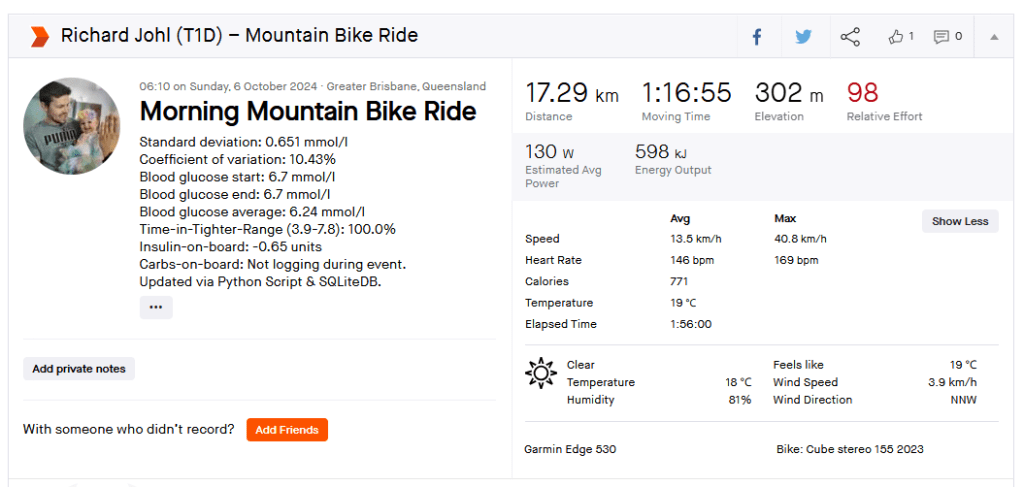
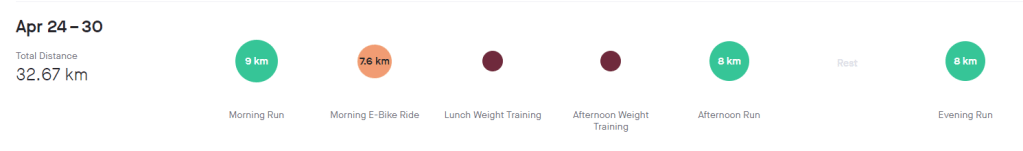
Week 10 (24th – 30th)
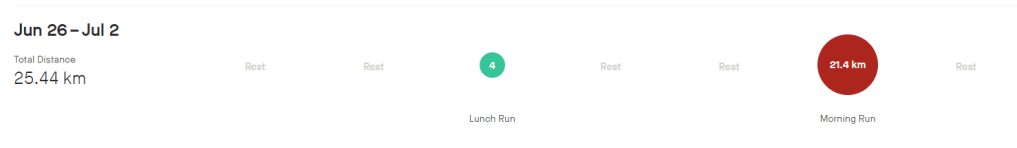
Week 10 is done and dusted. During my long run on Friday I decided to use the New Balance Fresh Foam More V3 running shoes to see if that improved my experience. This is because they are the most padded shoes I own, and the small 3 mm drop is supposed to reduce the risk of injury. Unfortunately this only reduced the pins and needles, but I must have laced them poorly as I got a few blisters. I also started my run way to quickly, and if I cant maintain a few zone 2 runs I am not going to work my slow twitch muscle fibers and improve my fitness fast enough to enjoy this race. These were shoes I had used before so I think it was down to the lacing and running technique. The last run of the week was a 8 km zone 2 run on the treadmill. This was actually the first of run week 9, but I decided to mountain bike ride on the Monday as it was raining on the Sunday so I switched them. For this run I used the New Balance 1080v12 shoes, and this was a great run. Not sure if it was due to treadmill suspension but every second felt good, despise a hypo half way though.
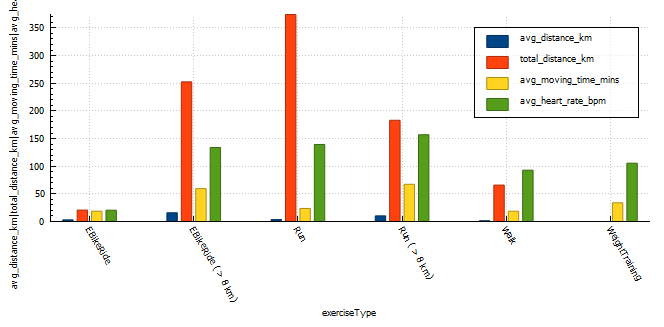
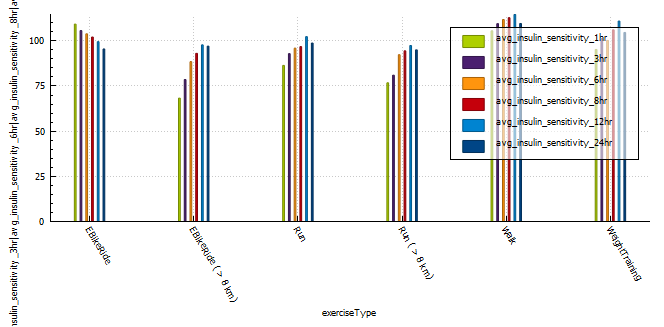
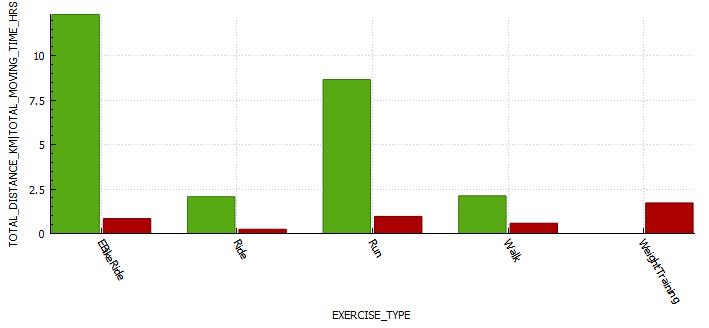
Exercise stats
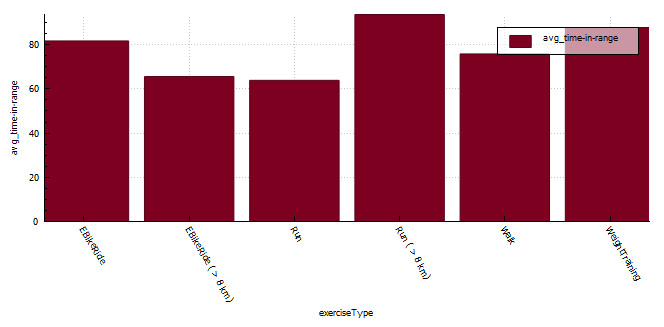
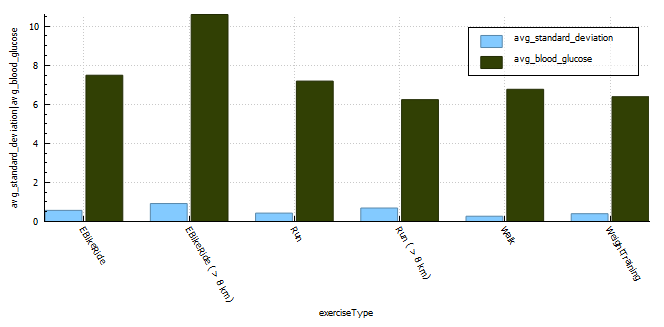
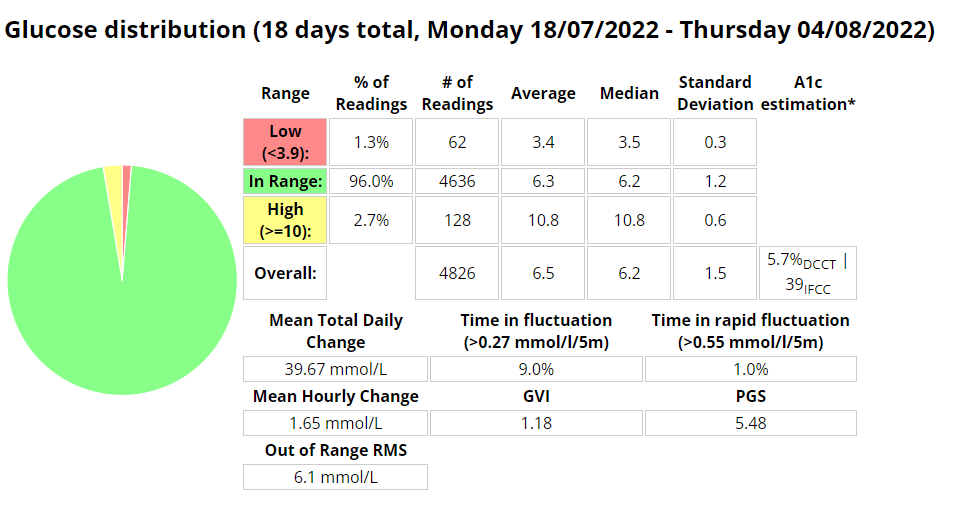
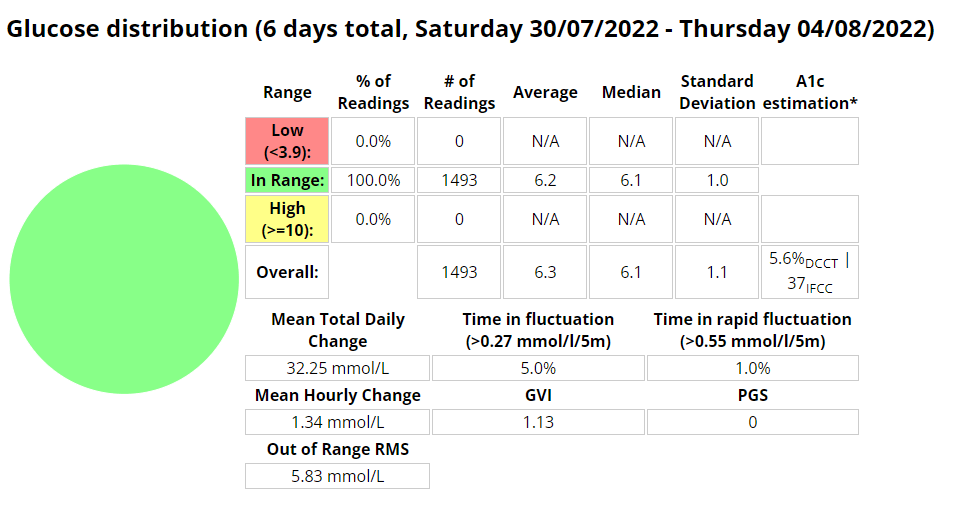
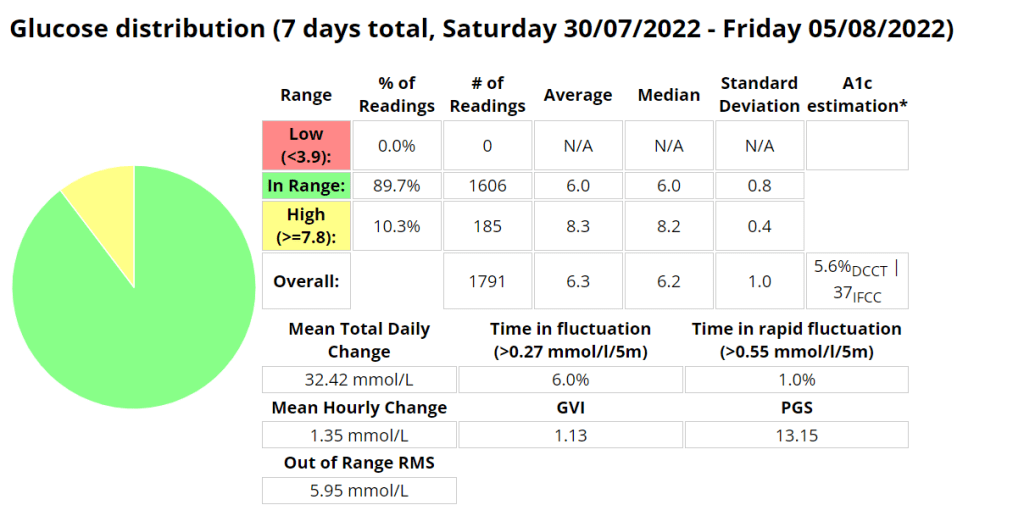
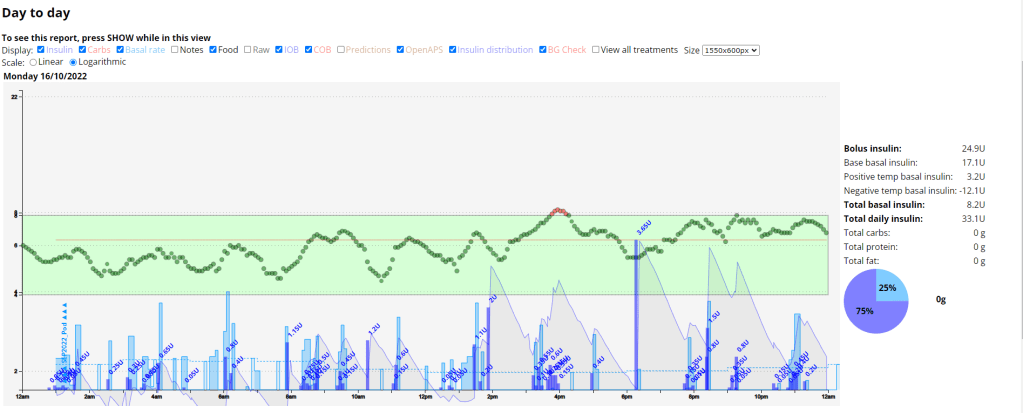
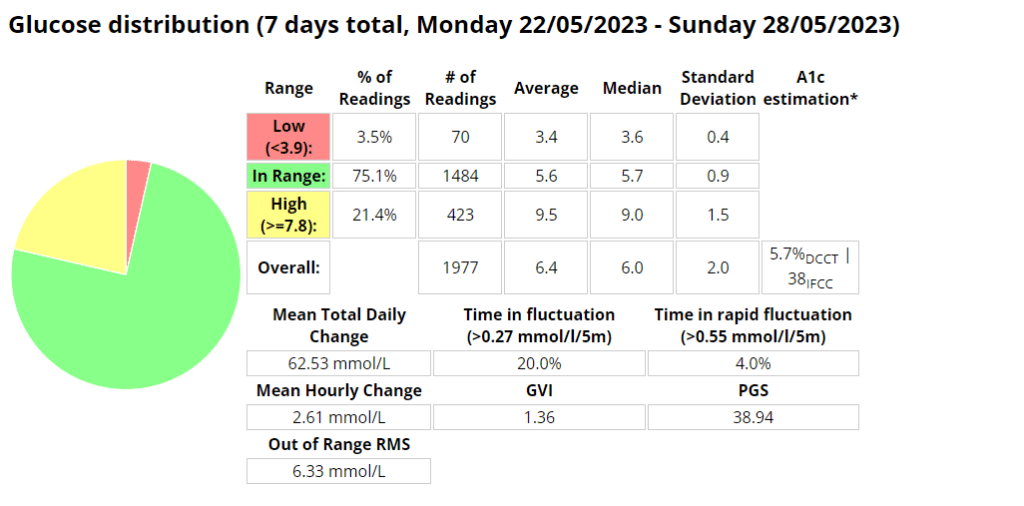
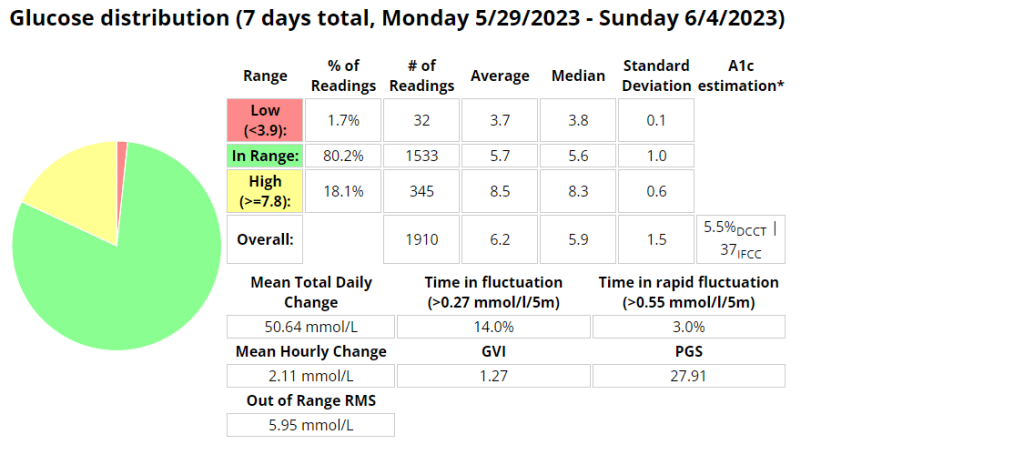
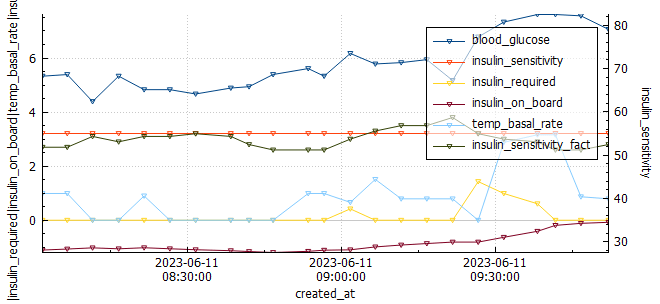
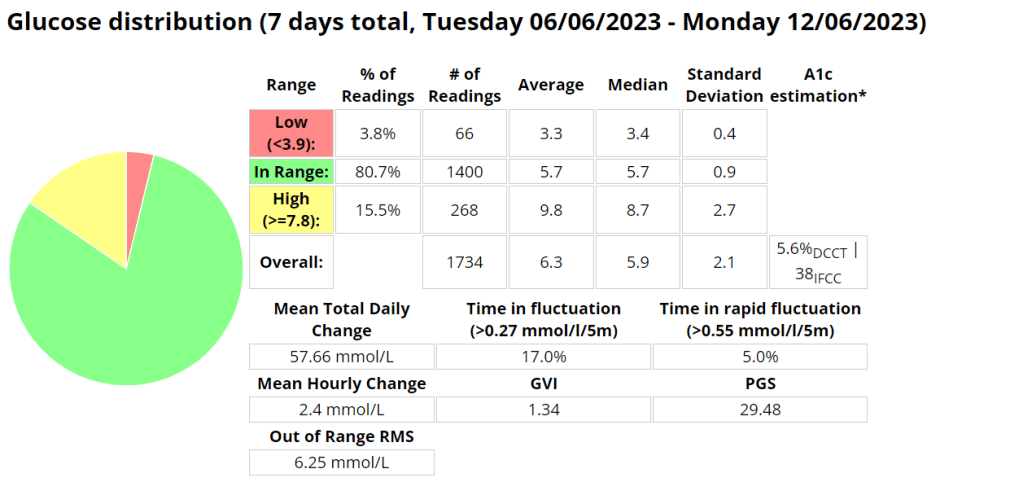
Blood glucose stats
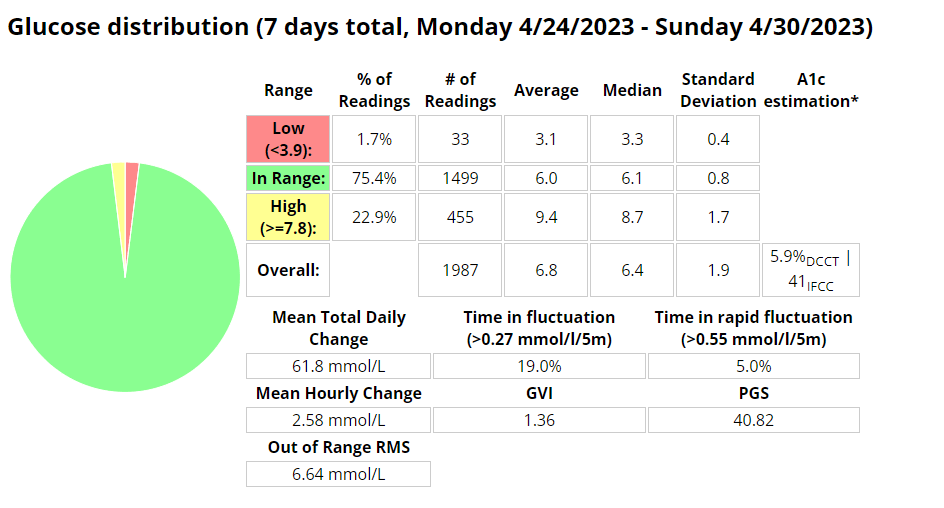
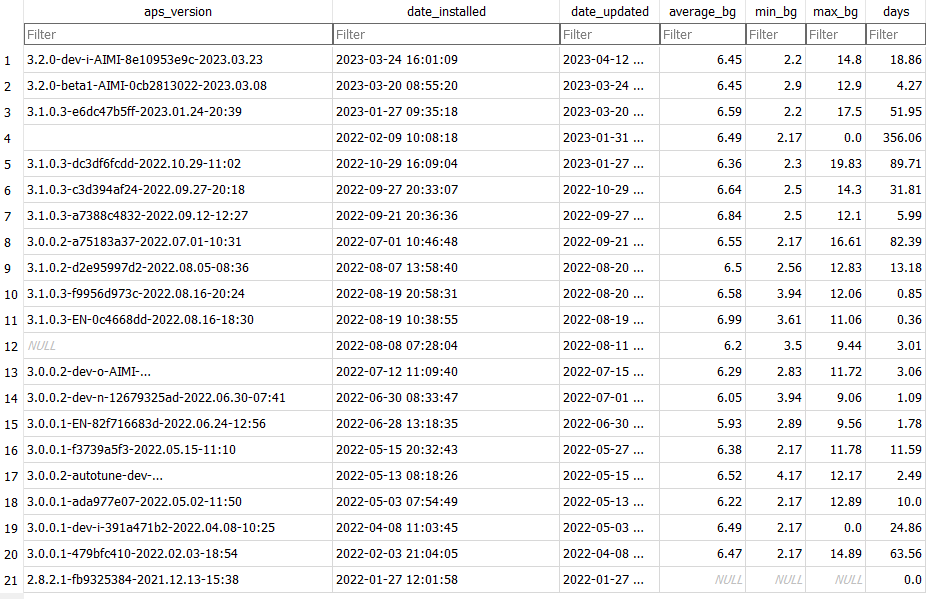
My experience with AIMI AI has not been a good one, for some reason I keep going on the blood sugar roller coaster and the system either gives too much or too little insulin. I am eating way less at the moment so I would expect more control. I’m back to Boost once this Pod expires to try and improve my glucose values. Probably not a great time to be trying a new system while increasing my training.
Measurements
Weight 75.6 kg
Week 9 (01st – 07th)
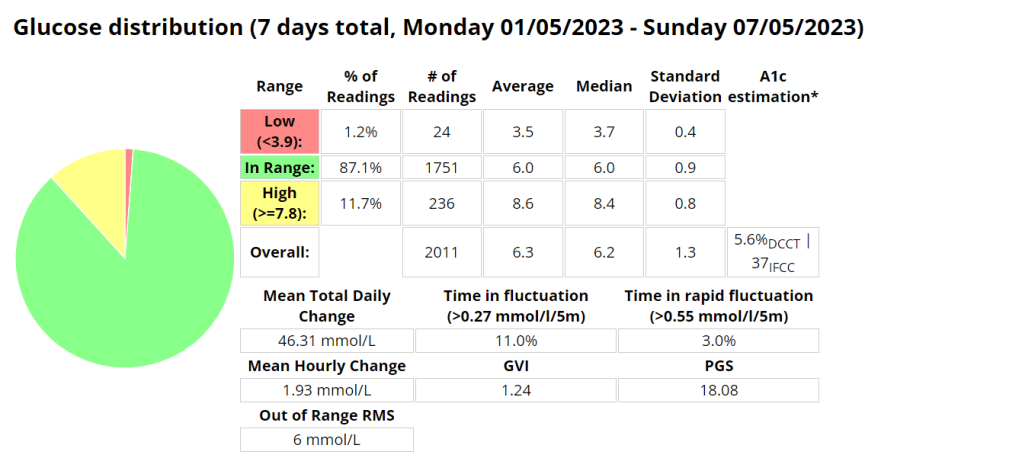
In an attempt to reduce the pins and needles I was experiencing I got some 2XU vector compression socks. This seemed like it may have improved the experience somewhat, until I started wearing my Brooks Ghost shoes. During the 8km run with the Ghosts I experienced no issues whatsoever. Blood sugars with AIMI seemed to be much better this week, except for a few isolated incidences where AIMI provided too much insulin. Since AI (or in this instance machine learning) requires data to build its model accurately, its seems likely that I needed more data in order for the system to perform better.
Exercise stats

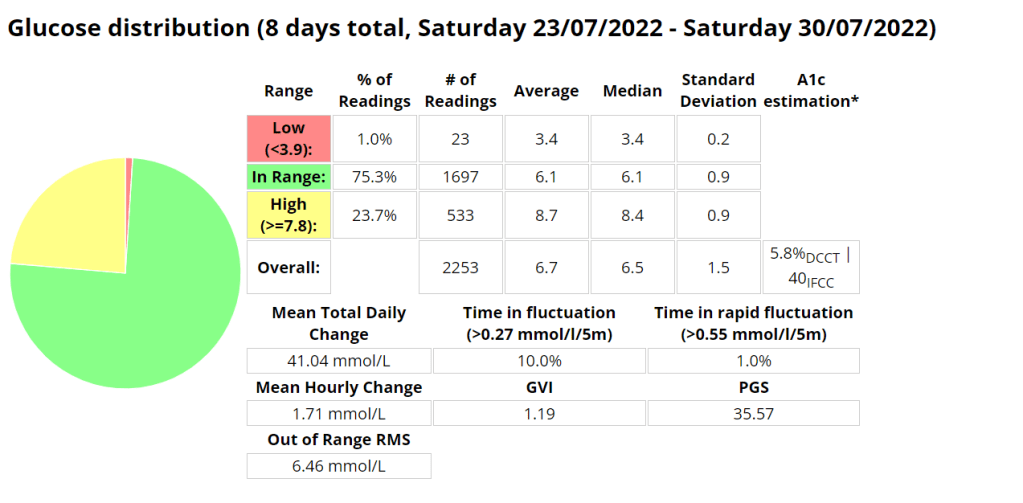
Blood glucose stats
Measurements
Week 8 (08th – 14th)
This week was was a big training week with the start of the extended distance (15-20 km) runs in the training plan. I have bee using the Ghosts more and although I no pain during my runs, I had quite a few blisters afterward the 15 km run. No vector socks this week. The long run was a little difficult to manage with my sugars requiring (22g+25g+28g) 75 g of carbs to stabilize for the run. I wasn’t expecting that. Quite a few more hypers that lasted longer than I had hoped. I think this is my last week of testing AIMI-AI before heading back to good old Boost. I like the fact I can very accurate with IOB with Boost, although my difficulty is due to AIMI adapting so well with all the changes. I also found myself on my Strava groups leader board twice 🙂
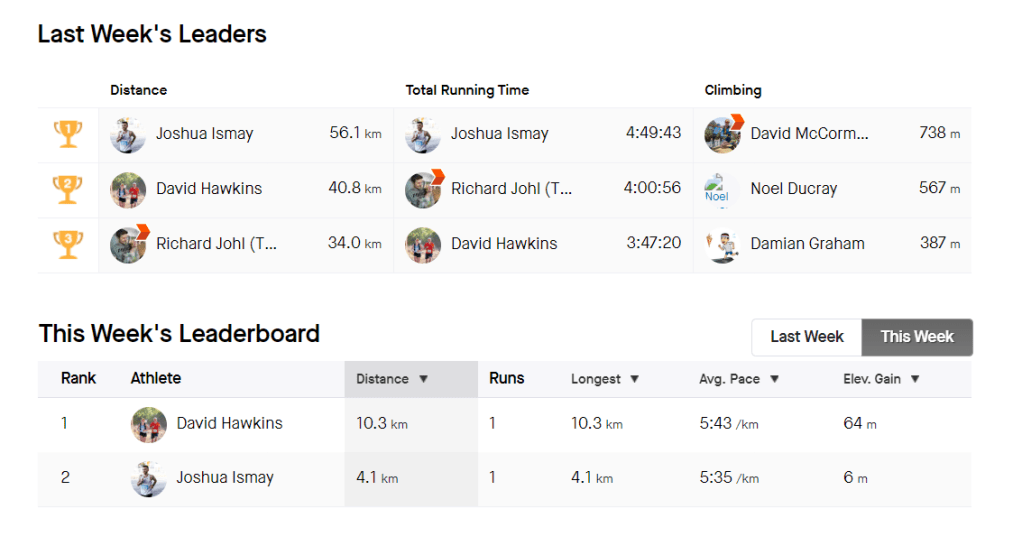
Its been interesting to see the difference between how Garmin and Strava track fitness, with Garmin using Vo2 max as its measurement and providing a stamina metric.
Exercise stats

Fitness
Below is a post highlighting the difference between the two systems in relation to fitness metrics.
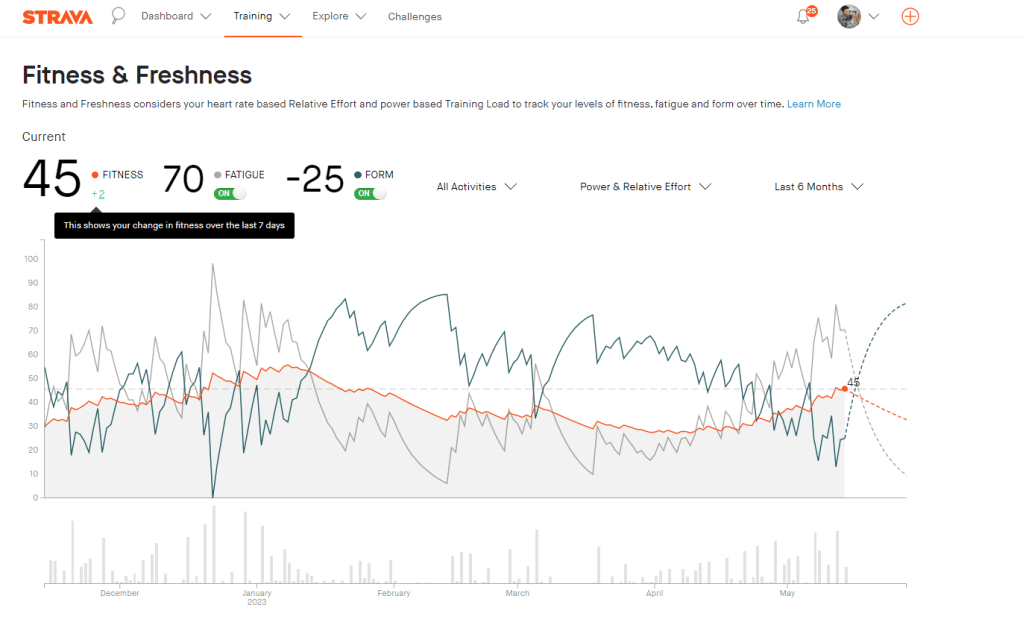
Strava fitness metrics
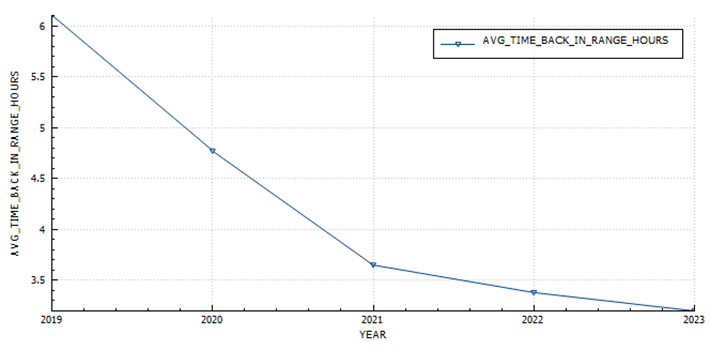
The Strava fitness metric seems to build with every run, providing some motivation to keep hitting those zone 2 runs. I am still 10 fitness points lower than I was in December. I am currently averaging 6 points every two weeks. If keep at this pace I should reclaim my fitness in about 23 days, or by the 6th of June. So that leaves almost the whole of June to work on improving fitness.
Garmin fitness metrics
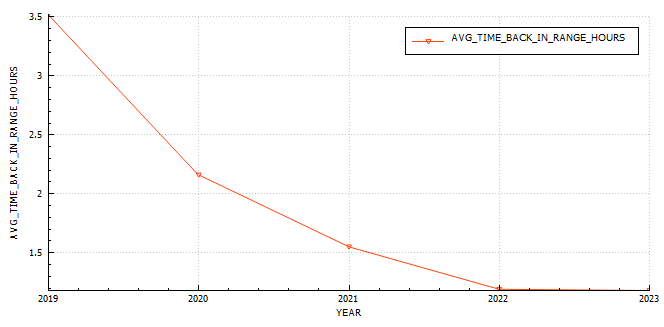
The Garmin fitness metric is Vo2 max, or maximal oxygen consumption. This refers to the maximum amount of oxygen that an individual can utilize during intense or maximal exercise. This measurement is generally considered the best indicator of cardiovascular fitness and aerobic endurance.

Blood glucose stats

Measurements
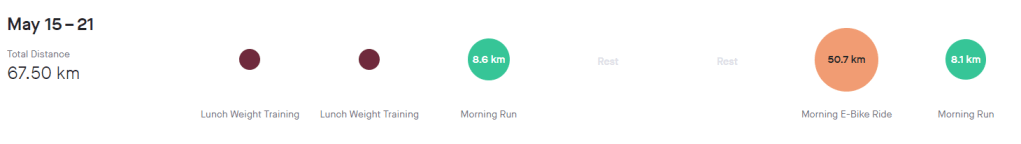
Week 7
This week I decided to shake things up, do a little mountain biking in New South Wales and also travel to new beach locations for my runs. It was amazing and I had an incredible time. I have also been asked to be a front runner for the Gold Coast Marathon team training sessions at HOTA.
Exercise stats
Blood glucose stats

Measurements
Week 6
This weeks long run was a little harder than usual, but it did have a beautiful view. I wanted to do a 15km but unfortunately was cut short to 14km. My feet felt good and good issues with blistering with the Ghosts. I also did a park run which almost ruined everything as my tendon issue faired up with the lack of a proper warm up. I was a little slower than I thought as I only managed 5min/km for 2,5km before burning out.
Exercise stats

Blood glucose stats
Measurements
74kgs
Week 5
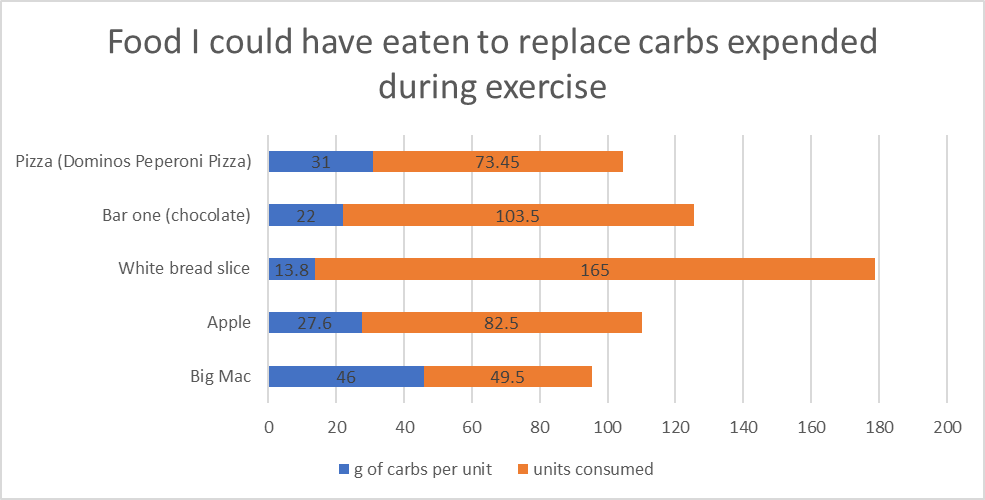
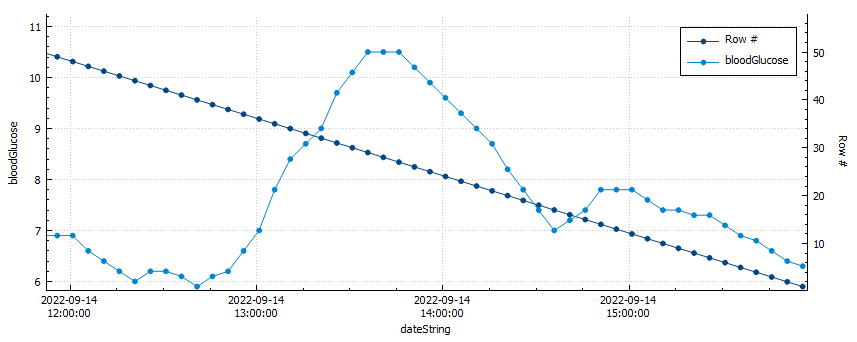
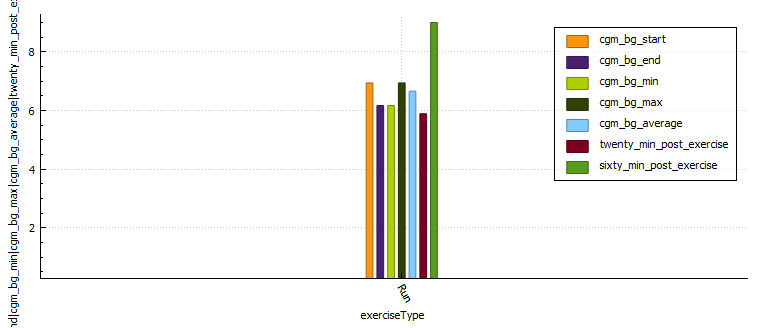
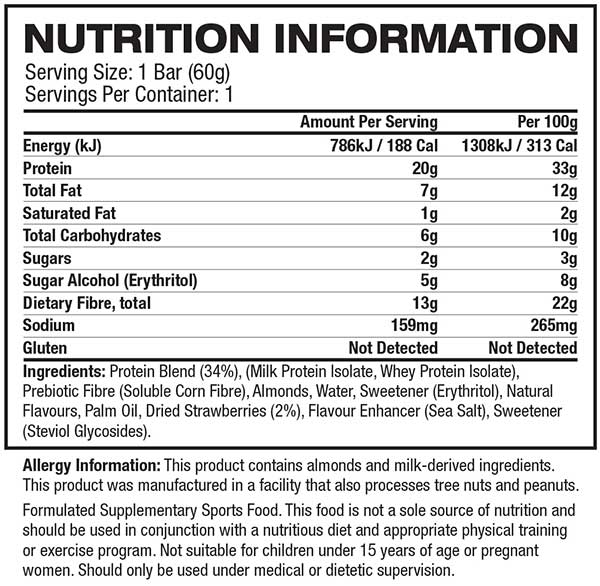
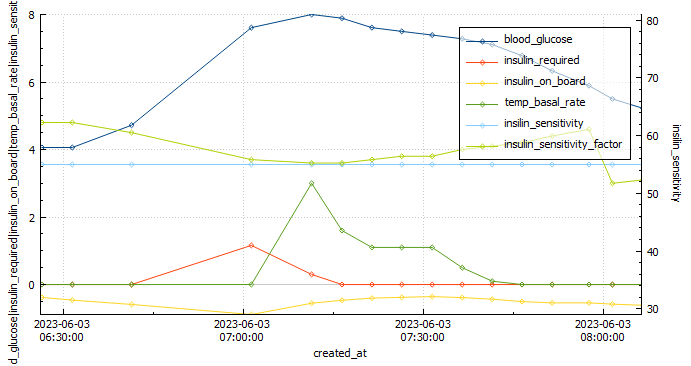
This week’s long run was fantastic! I completed the full 16 km without experiencing any pain or discomfort. As an experiment, I decided to try a Cliff Bar for the first time during my run, and I think I may have found my new go-to snack for long-distance running. I started my run with a blood glucose level of 4.1 mmol/l and waited approximately 20 minutes after consuming the bar before getting started. This slight delay caused a small spike in my glucose levels at the beginning of the run. To mitigate this, I plan to wait only 15 minutes before starting my next run.
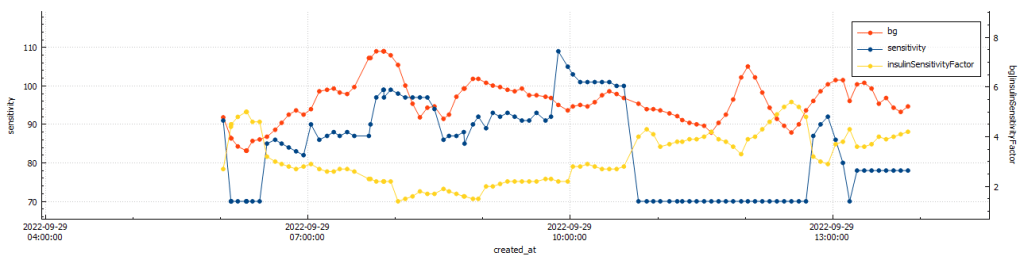
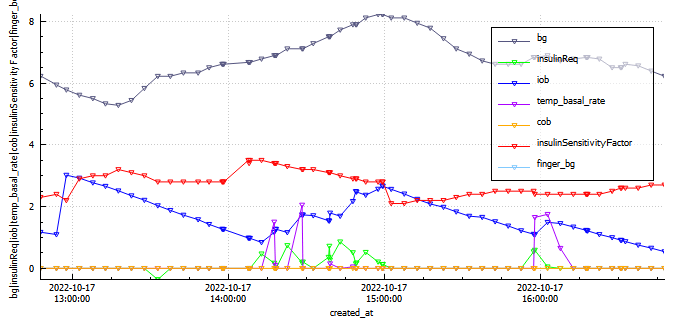
Analyzing the graph below, we can observe when the Automated Insulin Delivery Systems (AAPS) kicked in to provide a temporary basal rate adjustment to lower my blood sugar levels. Since I set a slightly higher temporary target of 8.3 mmol/l, AAPS registered my insulin sensitivity to be around 55% less than my standard needs. AAPS responded perfectly, gradually bringing my glucose levels down to a comfortable 5.2 mmol/l by the end of the run.
Overall, this run was a success, and the combination of the Cliff Bar and the effective response of AAPS made it even better. I’m excited to continue fine-tuning my routine and exploring the benefits of different strategies to optimize my long-distance running experiences.
Exercise stats

Blood glucose stats
Measurements
74 kgs
Week 4
This week was a bit of a mixed bag for me as far as my diabetes management goes. On the one hand, I had a great park run, where I managed to run a respectable 5:10 min/km for the 5km duration. This landed me in second position overall for this particular park run.
My long run started off very strong, but towards the end I developed some pain in the glute which resulted in me needing to stop the run at 17km, rather than the planned 18km. I managed to stay in range 100% (3.9-7.8 mmol/l) for the duration of the run with an average of 5.8 mmol/l, and my standard deviation was 1.024. I attribute to this to the cliff bar I ate 15min prior to starting the run.
I had a high percentage of low blood glucose readings on my CGM this week, which was mainly due to CGM sensor issues. This, in conjunction with poor rest has resulted in my HRV being quite for low for the week.
I went one full work week without sugar free soda. This change was due to recent research released indicating the significant detriment to health sugar free soda can have.
Exercise stats
Blood glucose stats
Measurements
Week 3 (12-18th)
Exercise stats

Blood glucose stats

Measurements
Week 2
During my last long run, I had to make the difficult decision to bail out early. Unfortunately, I was dealing with an ankle and tendon injury, which limited my capacity to cover the desired distance. Additionally, my blood sugar levels dropped significantly, adding another layer of challenge. Upon reflection, I realized that this low blood sugar episode was a consequence of inadequate planning. I had not set a high enough temporary target of 8.3 for a sufficient duration, leading to the drop in blood sugar levels.
To alleviate some stiffness in my legs, I sought a massage on Sunday. However, this revealed another issue – lower back pain on the left side. It became evident that this discomfort was likely a consequence of my existing tendon problem on the left side, as my body attempted to compensate for the imbalance. While I have been diligent in incorporating stretching exercises into my routine, it is unfortunate that I began doing so too late to make a significant impact on my current situation.
Despite the challenges I have faced, I consider these setbacks as valuable learning opportunities. Moving forward, I intend to implement the following lessons to prevent similar situations:
- Prioritize Injury Prevention: Understanding the importance of injury prevention, I will be more cautious with my training and listen to my body’s signals. This means recognizing the need for adequate rest, seeking professional advice when necessary, and gradually increasing intensity and distance.
- Establish Effective Blood Sugar Management: To avoid experiencing low blood sugar levels during physical activities, I will proactively set higher temporary targets and ensure their duration aligns with the demands of my workouts. This way, I can maintain stable energy levels and perform optimally.
- Address Imbalances and Compensatory Patterns: By acknowledging the connection between my tendon issue and the resulting lower back pain, I will incorporate exercises and therapies that specifically target these areas. By addressing imbalances early on, I can prevent further complications and improve overall performance.
While my fitness has undeniably declined due to the limitations imposed by my injuries, I have gained valuable insights from these experiences. By emphasizing injury prevention, refining blood sugar management, and addressing compensatory patterns, I am confident in my ability to overcome these setbacks and continue progressing on my fitness journey. Remember, setbacks are not roadblocks but opportunities for growth and resilience.
Exercise stats

Blood glucose stats
Measurements
Week 1
The lead up to race week has been less than ideal. Unfortunately my injury is preventing me from training and is causing pain and discomfort when I run, especially at incline. This was a reminder that injury prevention is key, and if I ever attempt this again I will ensure I follow a program that prioritises injury prevention through intelligent training, gradually increasing mileage and strength training. Please read my retailed post about the race below.
Exercise stats
Blood glucose stats