Recently my diabetic inspiration David Burren wrote an article about his results using an Artificial Pancreas System (APS). In this article he compared his results to those of 2019 CGM study of people without diabetes. His results are far better than my own, but I was interested to see how I stack up.
A table of my metrics vs. those a healthy individual using a CGM.
| Metric | Non-diabetic | Last two (2) week* | Last 3 months | Last year | Boost | AIMI AI |
|---|---|---|---|---|---|---|
| eHbA1c | 5.1% | 5.5% | 5.7% | 5.7% | 5.7% | 5.7% |
| GMI | 5.7% | 5.5% | 5.8% | 5.7% | 5.7% | 5.7% |
| TIR (3.9-10 mmol/l) | 99% | 95% | 93% | 95% | 93% | 94% |
| TITR (3.9 – 7.8 mmol/l) | 97% | 86% | 79% | 79% | 77% | 80% |
| CV (%) | 16% | 24% | 28% | 26% | 28% | 26% |
| Average BG (mmol/l) | 5.5 | 6.2 | 6.5 | 6.5 | 6.5 | 6.5 |
*The last two (2) weeks of data with me being back in the gym.
GMI – Glucose Management Indicator
TIR – Time in Range (3.9-10 / 70-180)
TITR – Time in Tighter Range (3.9-7.8 mmol/l / 70 -140 mg/dL)
CV – Coefficient of variation
Analysis of current results
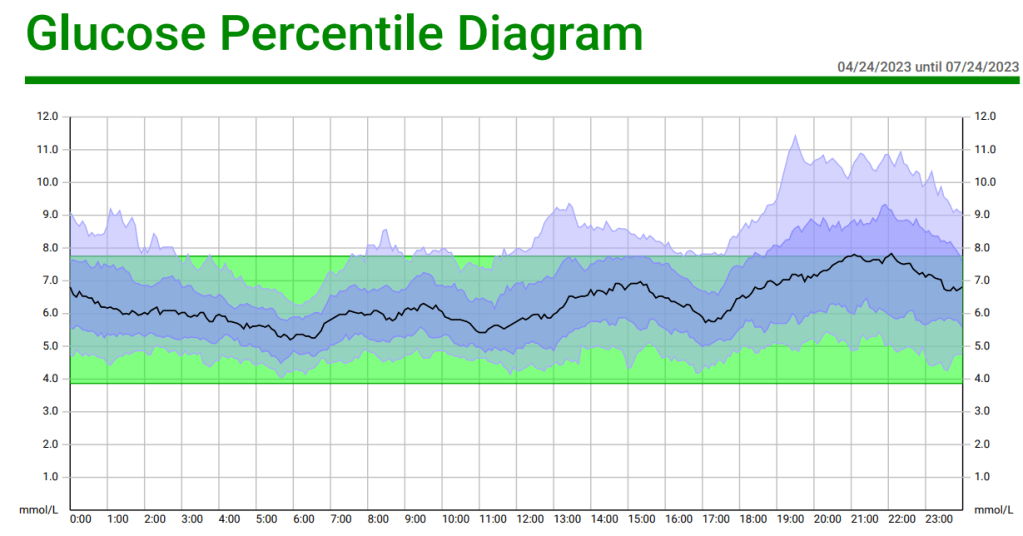
When analyzing my results on a glucose percentile diagram we can quickly see that the area I need the most work on is in the evenings. Making healthier choices here should have the most profound effect going forward.
Goals
I want to aim for an SD of less than 1.2 and an average BG of less than 6 to have a CV of 20% or less. This is considered to be an optimal range for non-diabetics. This equates to a TITR of around 90%.
Continuous Glucose Monitoring Profiles in Healthy Nondiabetic Participants: A Multicenter Prospective Study: https://www.ncbi.nlm.nih.gov/pmc/articles/PMC7296129/
