Disclaimer: The information contained within this blog post are my thoughts and do not constitute medical advice. Please consult your medical team before making any changes to your diet or blood sugar management program.
I decided to get an analogue bicycle and I have loved the challenge of riding it. I had a terrible GC half marathon (GCHM), complete with muscle spasms, but I finished so that was nice. The training for the GCHM was amazing and I got to run in some pretty interesting places, like the NSW rail trail in Casino.
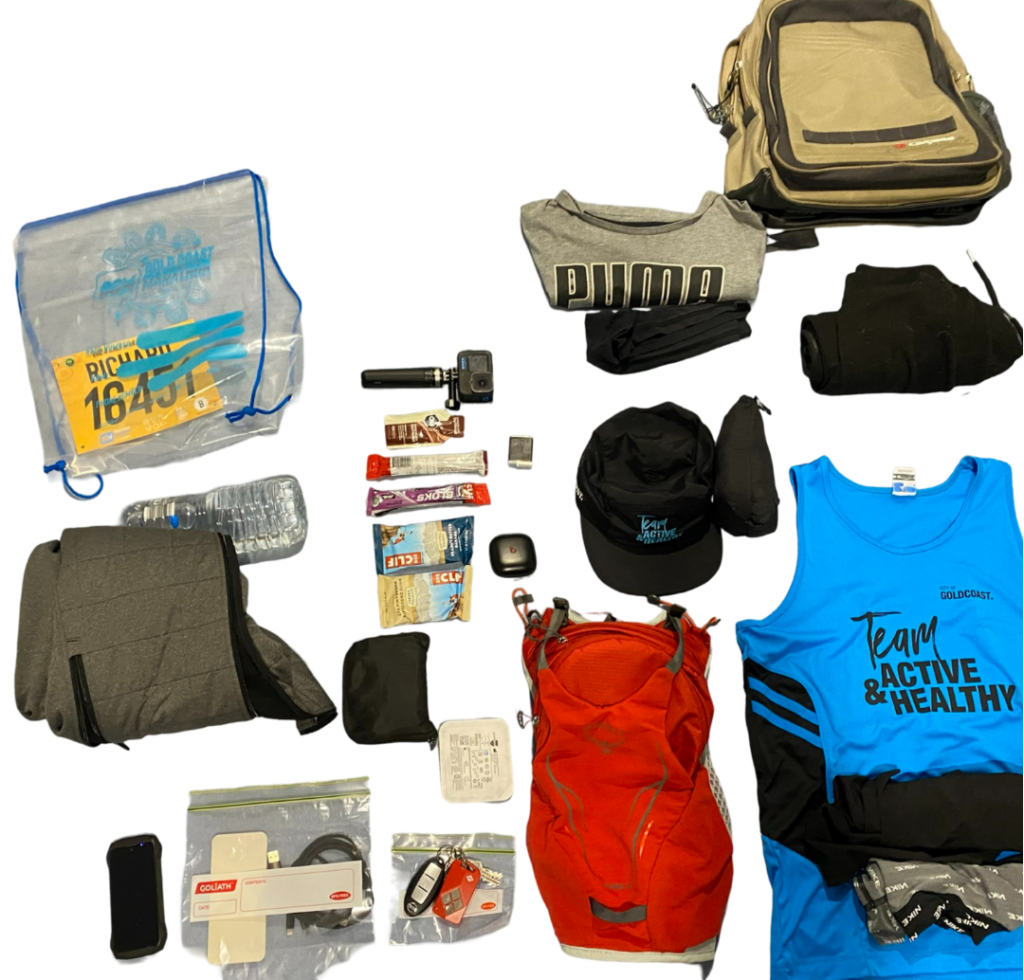
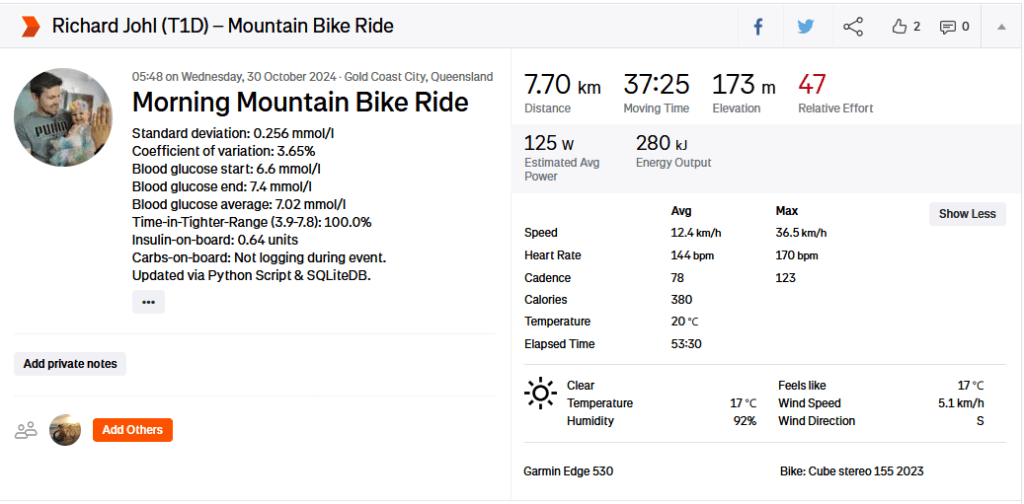
I have developed a host of new features for my Diabetes Analysis Tool, including an integration into Strava, where I update my exercise description with my exercise stats.
Physiological Metrics
I am currently on an average of 42.9 units per day and an average of 150g of carbs per day. These carbs include carbs from fat and protein (gluconeogenesis).
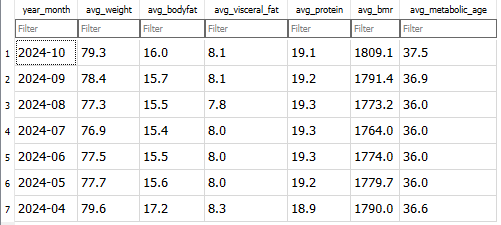
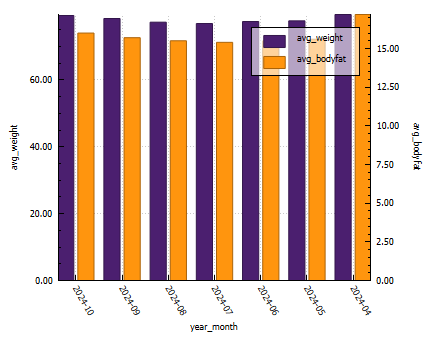
You can see from the graph below that my weight has fluctuated quite a bit this year, with poor eating habits (snacking at night) the biggest contributor to a lower time in range. My lowest bodyfat was 15% (confirmed by 3rd party testing). This dramatic weight shift was due to training for the GCHM.
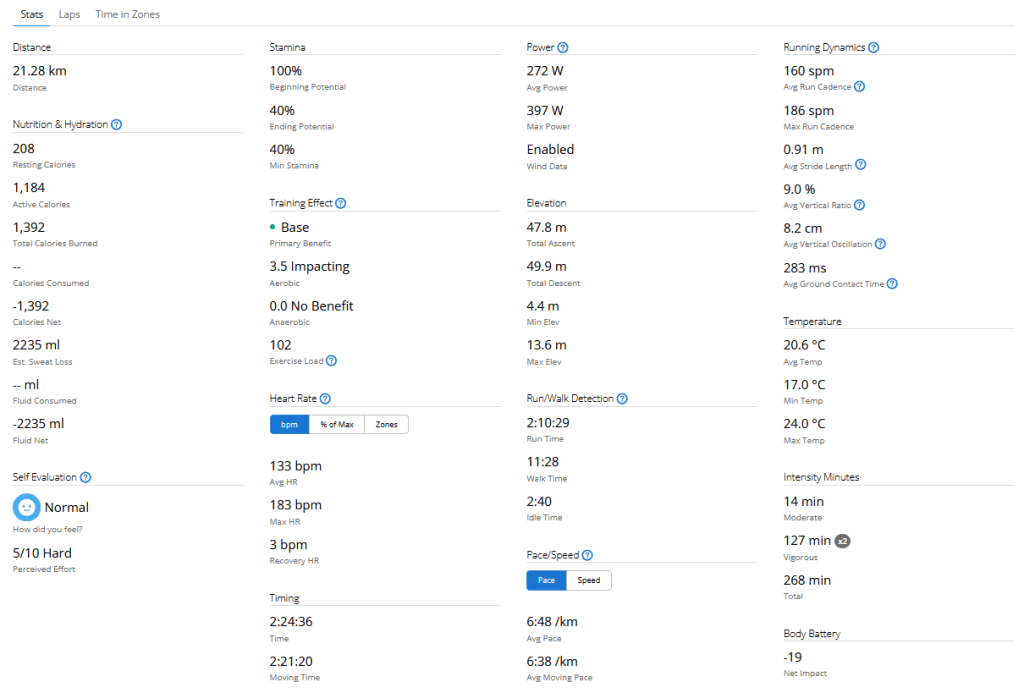
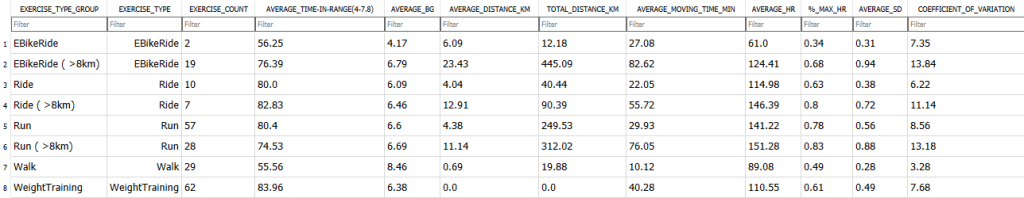
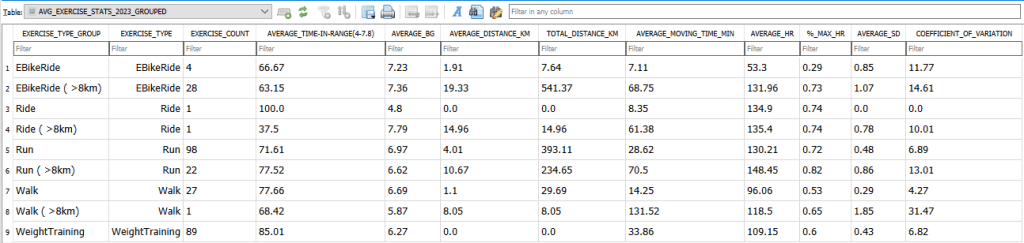
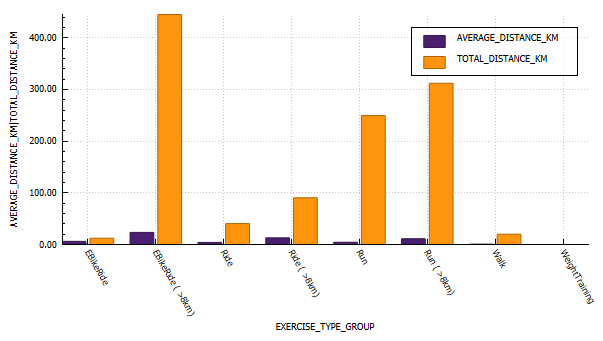
Exercise metrics
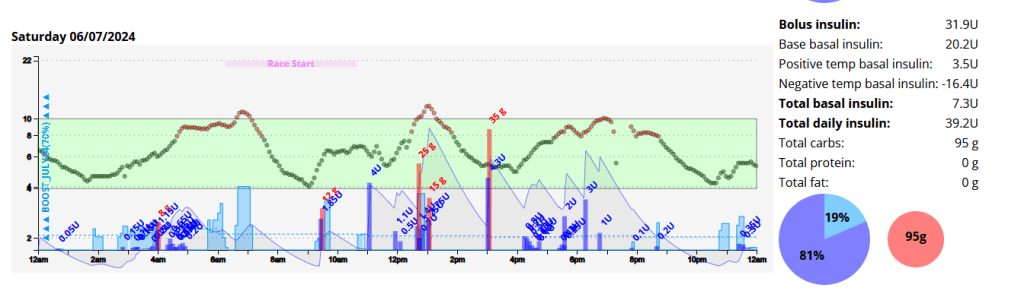
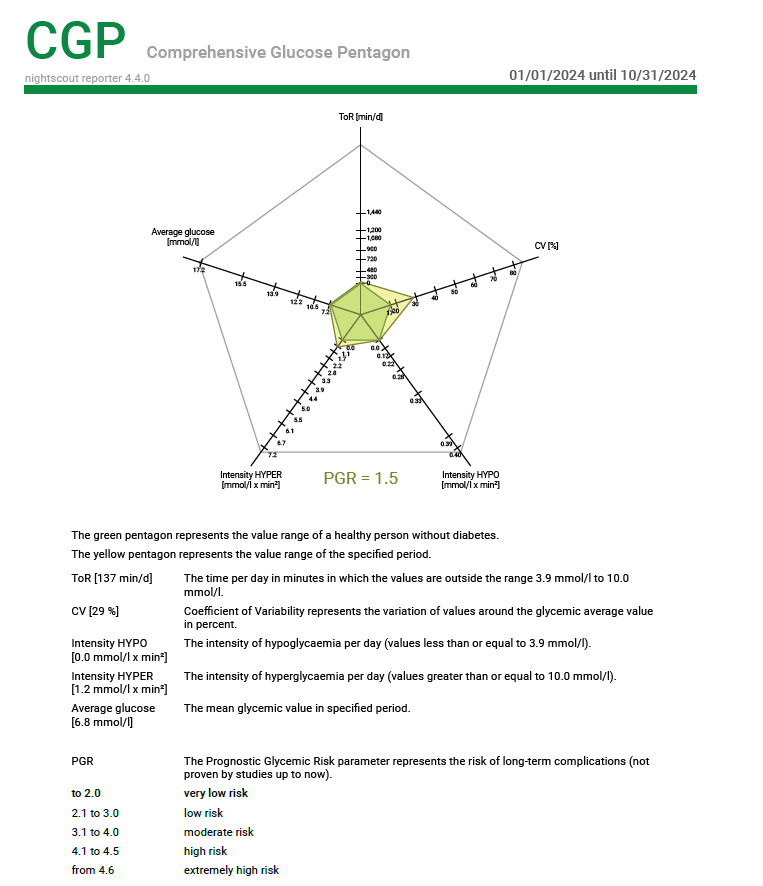
Every year I try to increase my distances and time in range (TIR). This year I increased my TIR by 2%, which is incredible. Although my CV and SD are lower, average glucose is down 0.06 mmol/l. I attribute this to lower insulin closer to exercise time, and refuelling at appropriate time intervals.


Energy Burn Rates


Time-in-range (TIR)

Blood glucose control metrics

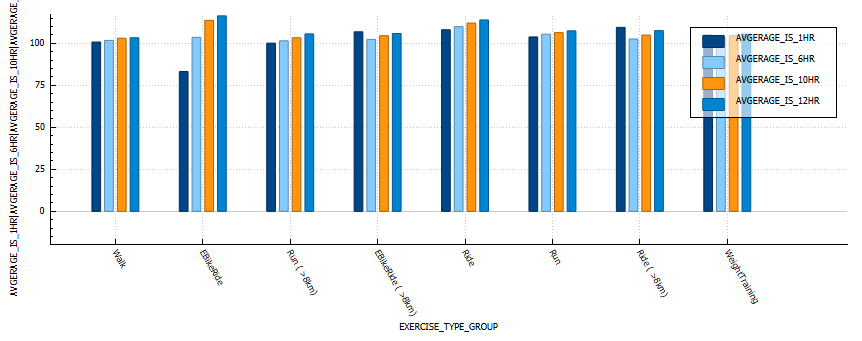
Insulin sensitivity
In the below graph we can see that walking and weight training result in the lowest changes in sensitivity.
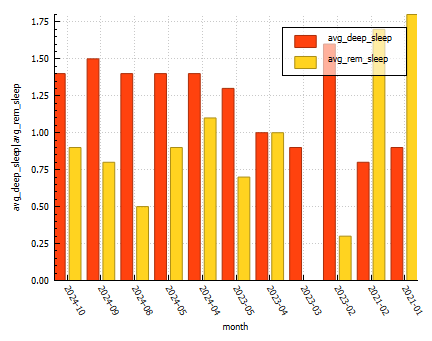
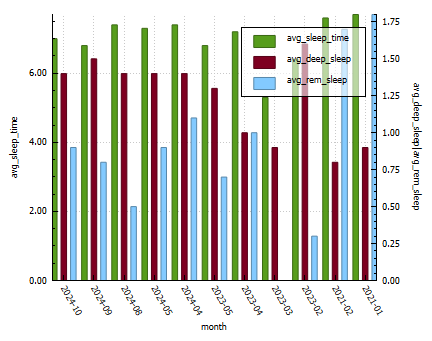
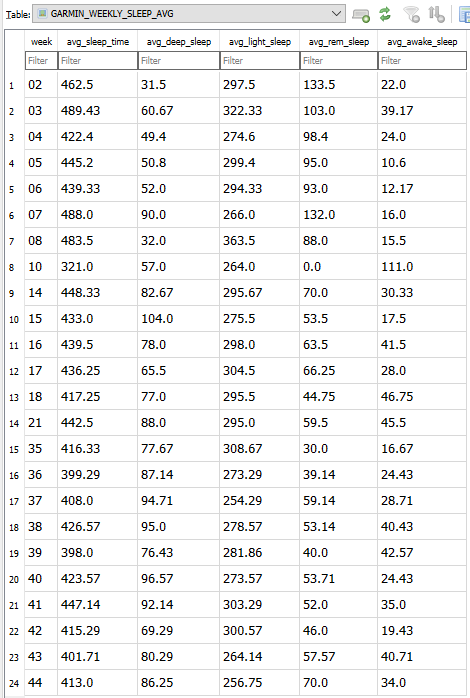
Sleep Metrics