Summary
This week was the best so far. I did my longest run to date (12km) and had a really good gym week lifting (approx. 20% more volume). My diabetes control is improving (thank you AAPS and exercise) and I have learned a lot digging though my data and through responses from the previous weeks question regarding carb sensitivity factor (CSF) being used to measure insulin sensitivity post exercise. I made some strides in my glucose management tool which also felt great.

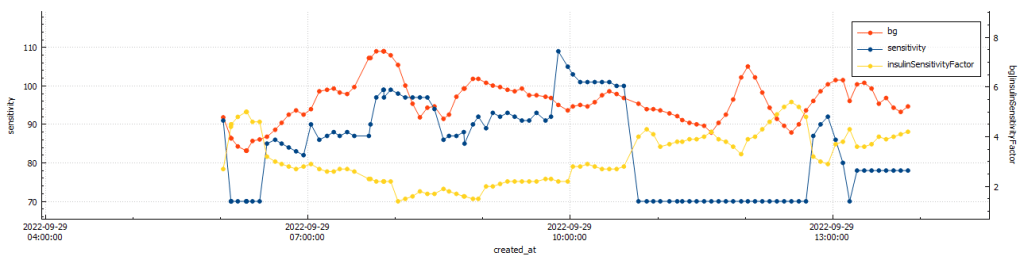
After gym sensitivity increased to 115% directly post training, while my sensitivity was stable at 78% post my run.
Body Metrics
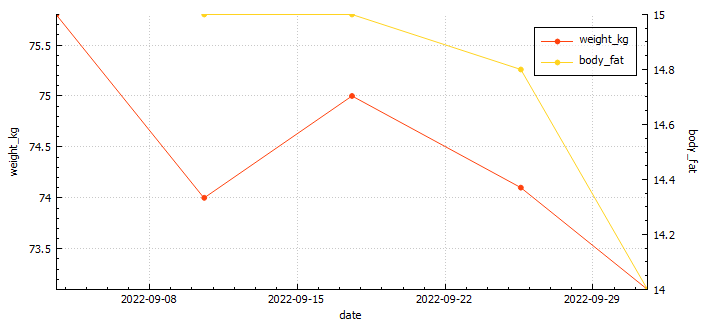
| Start | Week 1 | Week 2 | Week 3 | Week 4 | |
| Weight (kilograms) | 75.8 | 74 | 75 | 74.1 | 73.1 |
| Body fat percentage (according to Samsung) | 17.3% | 17.8 | * | * | |
| Body fat percentage (according to the navy seal calculator) | 15% | 15% | 14.8% | 14% | |
| Total volume | |||||
Exercise
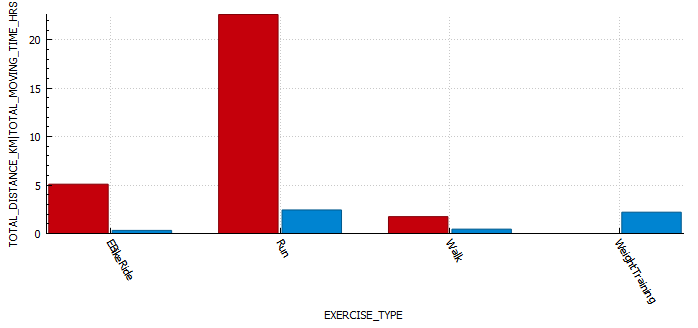
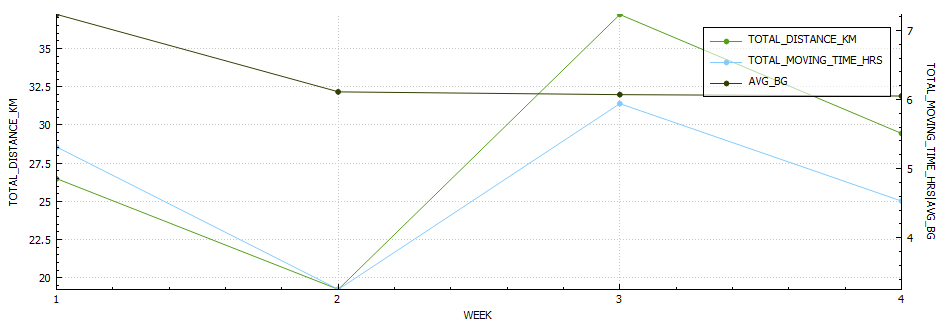
| Week 1 | Week 2 | Week 3 | Week 4 | |
| Distance (kilometres) | 25.17 | 20.54 | 37.22 | 29.4 |
| Activity (hours) | 4.34 | 3.65 | 5.64 | 5.4 |
Nutrition


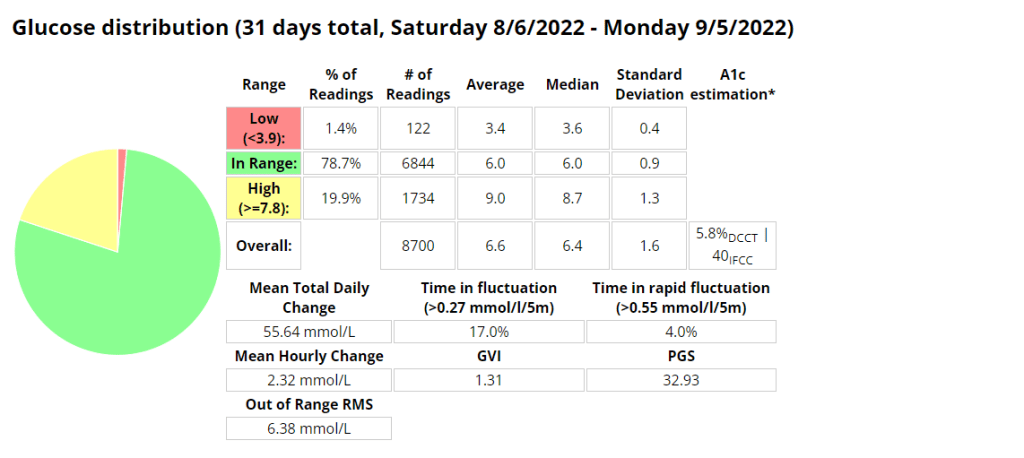
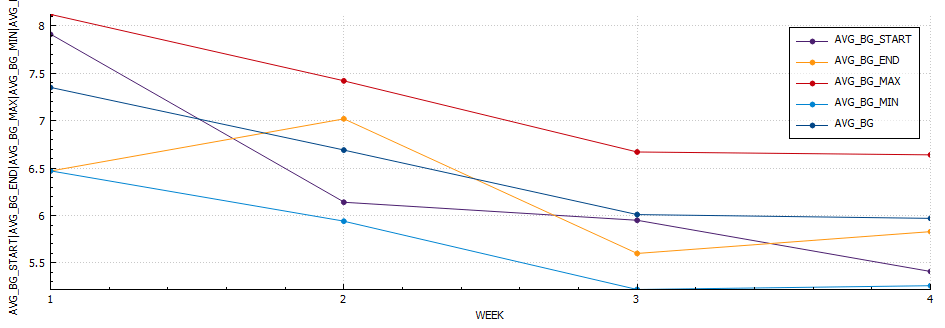
Diabetes
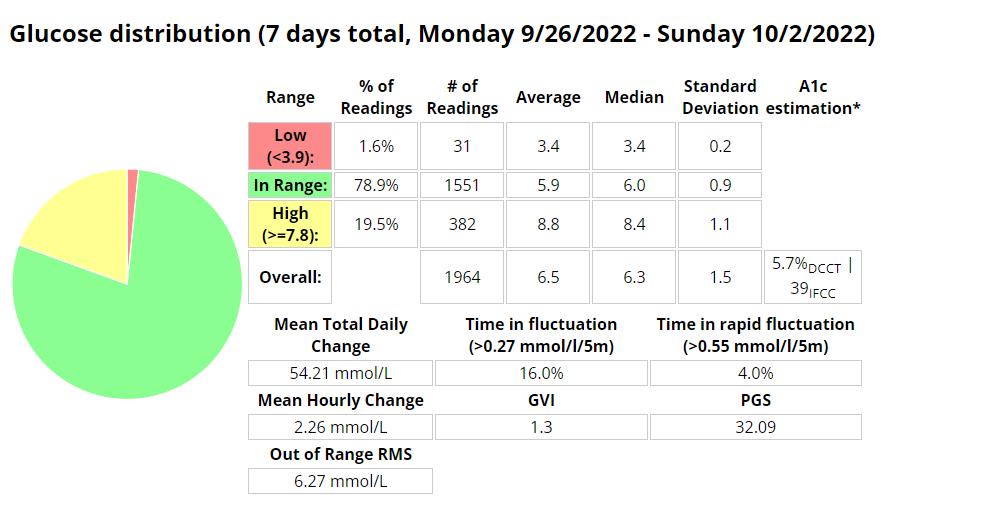
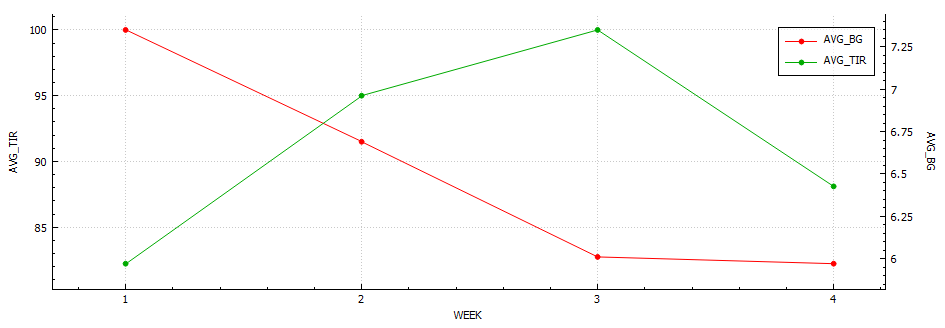
| Week 1 | Week 2 | Week 3 | Week 4 | |
| Low (<3.9) (%) | 0.9 | 0.6 | 3.5 | 1.6 |
| In Range (3.9-7.8) (%) | 75.3 | 74.7 | 71.9 | 78.9 |
| High (>= 7.8) (%) | 23.8 | 24.7 | 24.6 | 19.5 |
| Standard deviation (SD) | 1.3 | 1.7 | 1.7 | 1.5 |
| Average (mmol/l) | 6.8 | 7.0 | 6.7 | 6.5 |
| A1c estimation (%) | 5.9 | 6.0 | 5.8 | 5.7 |
Ideally I want to see a time-in-range (TIR – 3.9-7.8 mmol/l) exceeding 90% with an average in the low sixes and a standard deviation (SD) around one (1).