Dynamic ISF is all the buzz in the diabetic community at the moment, and so it should be! In the first few days of using it I was able to see marked improvements with little to no intervention as the algorithm scaled my correction doses.
What is Dynamic ISF
Your insulin sensitivity factor (ISF) is how much one unit of insulin will lower your blood glucose. Simply put dynamic ISF uses your total daily dose (TDD) of insulin to scale this value depending on blood sugar.
My results
So far the results have been astoundingly positive.
Before D-ISF : Average TDD: 30.1, Average Carbs :138gUsing D-ISF: Average TDD: 25.1, Average Carbs :102g
Update:
Using D-ISF for one (1) month. A little bit of an unfair test as I had 3 sensors fail during this period, which resulted in many issues with sensor accuracy.
Formula
ISF = 277700 / ( BG * TDD )
Differences in the GUI (when using DEV)
As you can see in the picture below, the yellow square highlights the time the loop last ran, and the red square shows the profile ISF vs. the calculated dynamic ISF.
Home screen of AAPS
It’s interesting to note that the D-ISF code isn’t implemented when using the calculator, its only actively scaling ISF using SMB’s (and maybe basal %). This will mean your normal profile ISF is going to be used when eating a meal. If you have never tested your ISF It may be worth while checking what the scaled ISF is at meal time (provided your BG is perfect) and setting your profile to that value if the values are vastly different. This is also providing that you aren’t in a period of significant resistance or sensitivity.
The Dynamic ISF plugin you will obtain in the config builder of the Dev code.
Where do I get a copy of the AAPS Dynamic ISF branch
It is in the same repository as the standard (master) version of AAPS. In order to use it you will need to select a different branch of AAPS (dev) and build that branch. I suggest you read Tim Streets repo notes for a more in depth description of the code and its functionality, even though you will not require the code from that repository. You will need to enable engineering mode on the phone in order to utilise the dev branch.
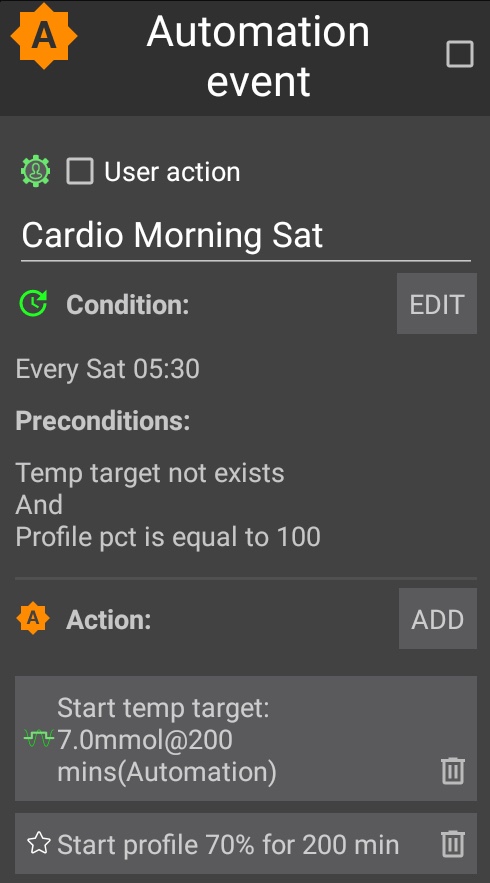
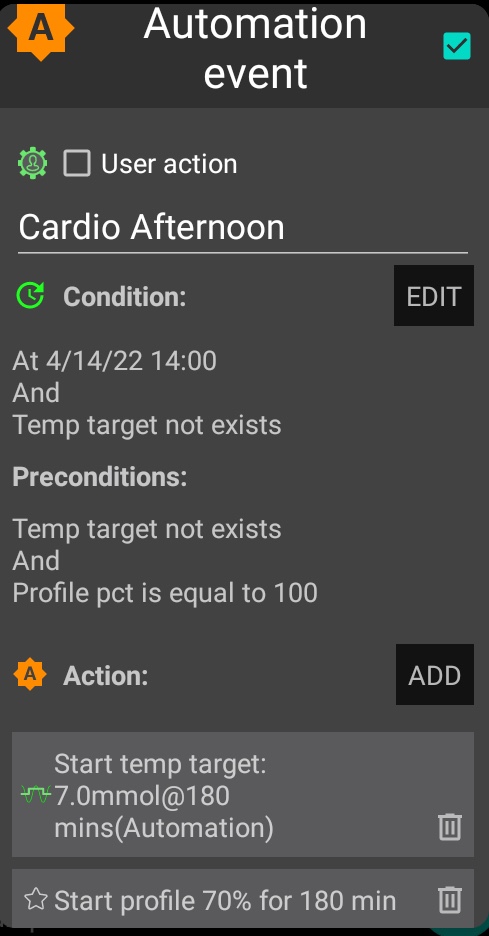
I decided to try using an automation to lower insulin levels and raise my glucose target before doing cardio. This allows AAPS to start this process at 05:30am on my days of choice so that my body is ready to exercise safely and with less need to consume carbohydrates. In my limited testing the process is working well, with some slight tweaking for testing parameters needed. NOTE: I only added half the amount of carbs I consumed to the APS for tracking. This is to avoid overcorrecting by the algorithm.
Expectations
I am trying to find the ideal conditions to exercise where I can experience moderate blood glucose fluctuations and not be required to consume large amounts of carbohydrates to keep me exercising safely. In the past on MDI I used to exercise fasted with only basal on board, which allowed me to stay in range for about 40 minutes before needing carbs. I am hoping to achieve this same amount using a pump. In past experiments I was able to achieve similar results during exercise by significantly reducing basal rates but I found that post exercise I struggled with higher than usual blood glucose readings for a few hours due to lack of insulin in my body.
Automations
Blood Glucose vs. CGM
The CGM results differed during exercise an average of 25% from blood readings. This made me decide to start some research of my own into using machine learning to try and estimate my blood glucose during exercise.
Results / observations
The automation route works well if you plan your exercise far enough ahead. The next experiment I will drop the profile percentage to 60% and observe. I noted an average of about 25% difference between the results the CGM and the finger pick tests. I was however able to keep my readings in range 100% of the time using 34g of carbs for the duration of the 50 minute experiment.
Capture from Nightscout
Video
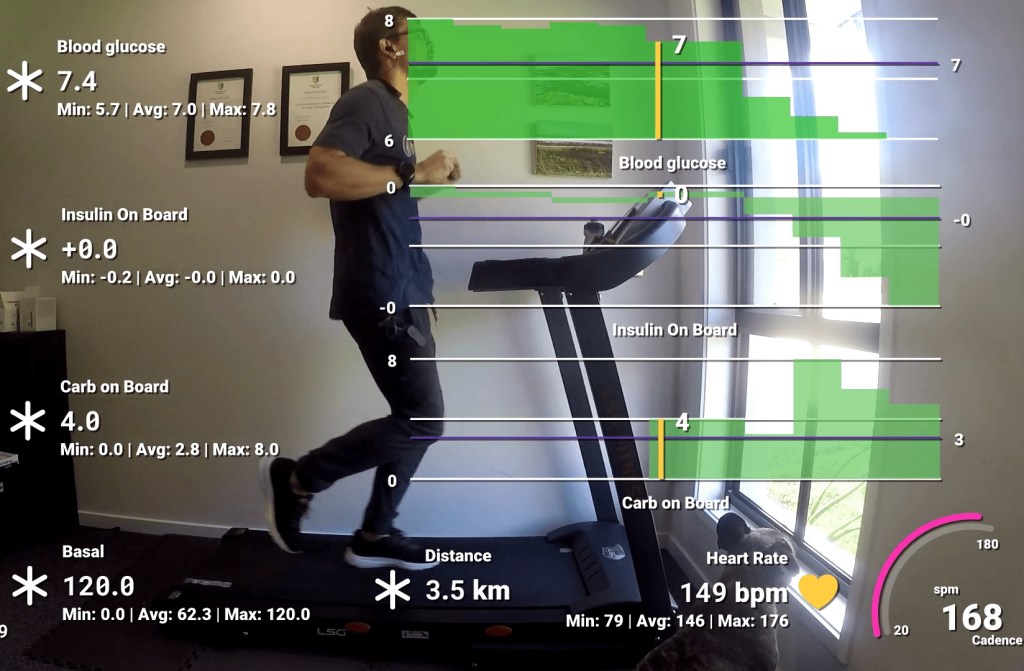
I created a video using data from my Garmin Forerunner 245 and AAPS to track the experiment. In this video I track blood glucose, insulin, carbs, basal, distance, heart rate and cadence. I noted that the algorithm the Garmin uses to determine distance does not work well while walking and didn’t register any distance until I started lightly jogging.
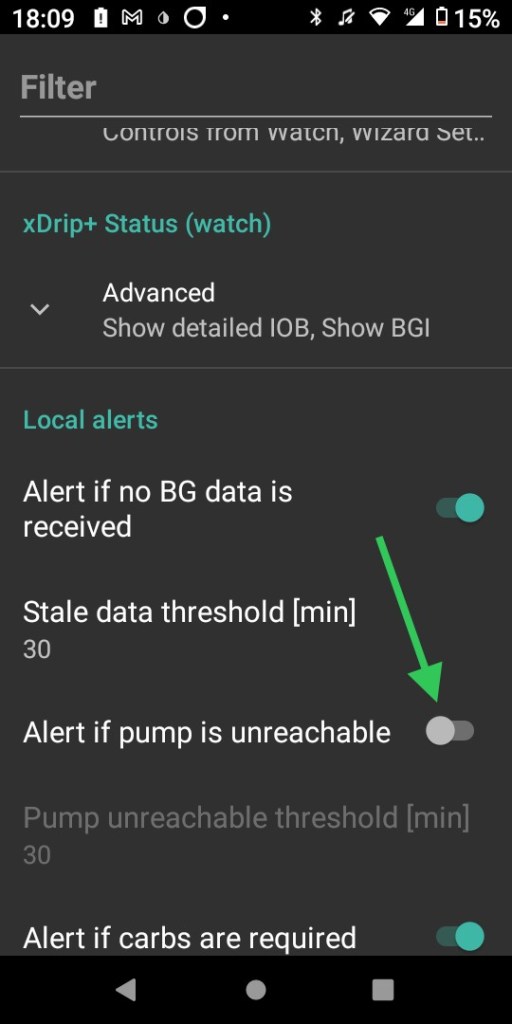
The pump unreachable alarm is a very useful function, but there may be times when the standard alarm needs to be replaced by something less intrusive.
If you have reached objective 9 (automations) then you could disable the standard AAPS alarm and replace this with a notification, SMS and/or alarm. Below is the setup I used. I wanted a robust alternative. I suggest using a combination of alerts and notifications as this is an important alarm you do not want to miss.
Disabling the Standard Alarm:
Go to Preferences ->Local Alerts -> Alert if pump is unreachable and turn the toggle switch off
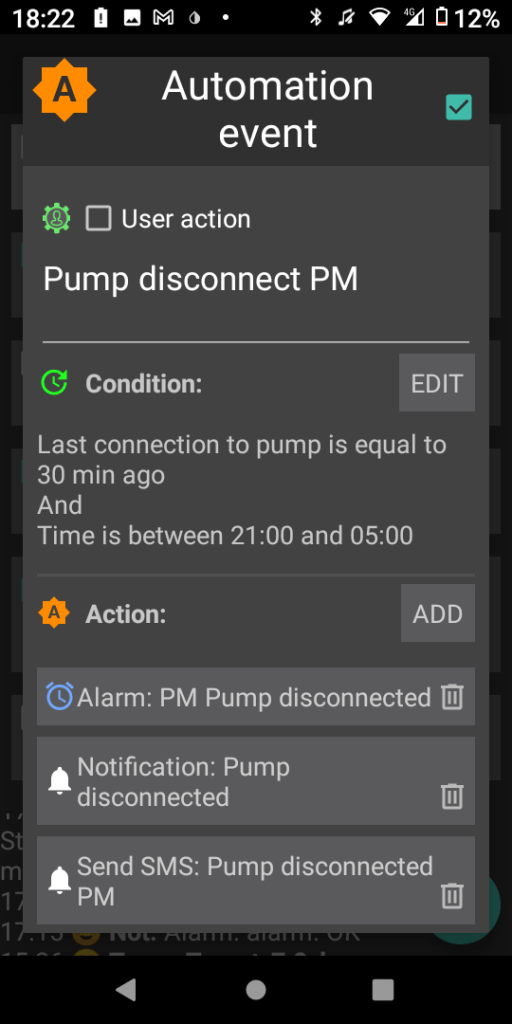
Now we need to configure an automation to replace the standard alarm. I decided to create two automations as I wanted the standard alarm to sound at night when I was unlikely to wake from an SMS or notification.
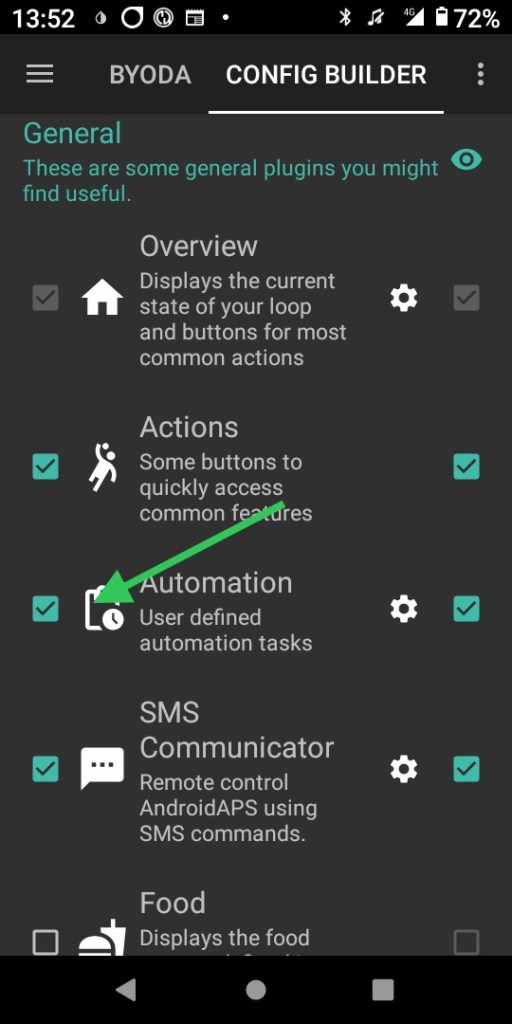
Enabling an automation:
Enable automations in the config builder by ticking the box next to the name in the General plugins menu.
Creating an Automation:
Enable the automation
Name the automation something useful and descriptive.
Edit the condition of the automation
Add an action to perform once the condition is achieved
The text the SMS will send my phone once the condition is achieved
The notification that appears in AAPS once the condition is achieved
Hit ok to save the automation
NOTE: Ensure you name the notification or SMS text as the automation will not work unless you do.
Alarms:
The alarm tone is the standard tone for the phone timer. Once the alarm starts sounding you will need to deactivate it using your phone.
In preparation for my cycle I started an automation to prepare my body for the impending exercise. This automation reduces my basal insulin ( as well as scale the rest of my management metrics) by 30% and set a temporary target (TT) of 7mmol/l. AAPS will not allow me to automate a profile % shift of more than 30%, so I reduced the profile a further 5% manually in AAPS an hour before the ride.
Exercise Metrics:
Garmin exercise stats
Blood Glucose:
Interestingly, AAPS stopped basal for a long period and allowed the IOB to runs its course.
My blood glucose held quite steady despite a mixture of anaerobic and aerobic levels of activity and so I didn’t need to consume any carbohydrates. Hopefully future attempts are as successful as this one.
Is the Quest protein bar type 1 diabetic friendly? Yes I think it is, read more below to discover why I think it is.
Review
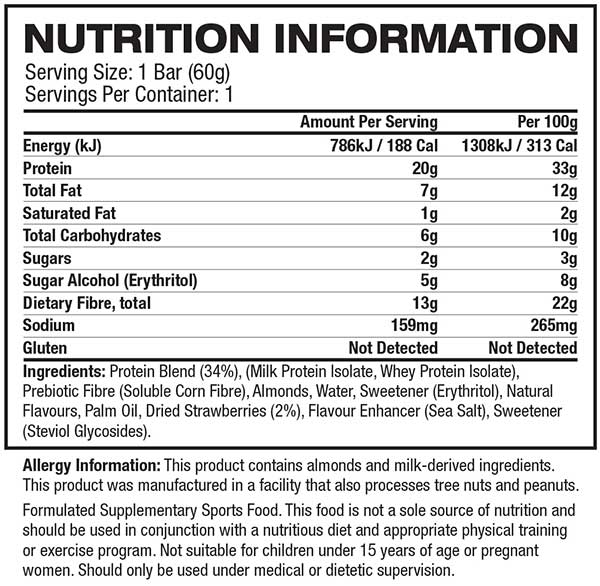
Nutritional Information
Insulin Strategy
Goal
Results
When trying anything new I always read the nutritional information on order to determine the impact it will have on my body. Certain high fat foods can cause insulin resistance and inflammation and will delay gastric emptying while protein will digest and get synthesised into carbohydrates.
Below are two great resources you should read before deciding on your final dosing strategy. Its important to note that in Australia, most items don’t have total carbohydrate count that includes fibre and sugar alcohol, which can make it difficult to assess the impact of products that don’t list sugar alcohols in the nutritional information.
Based on the nutritional information above, my inulin to carb ratio and my proximity to recent exercise I decided to inject as follows; I didn’t input my eCarbs for the protein as I knew that AAPS would be able to manage. Read my post for injecting for protein and fat if you are not on an AAPS or experience elevated blood glucose two (2) hours after eating.
Goal
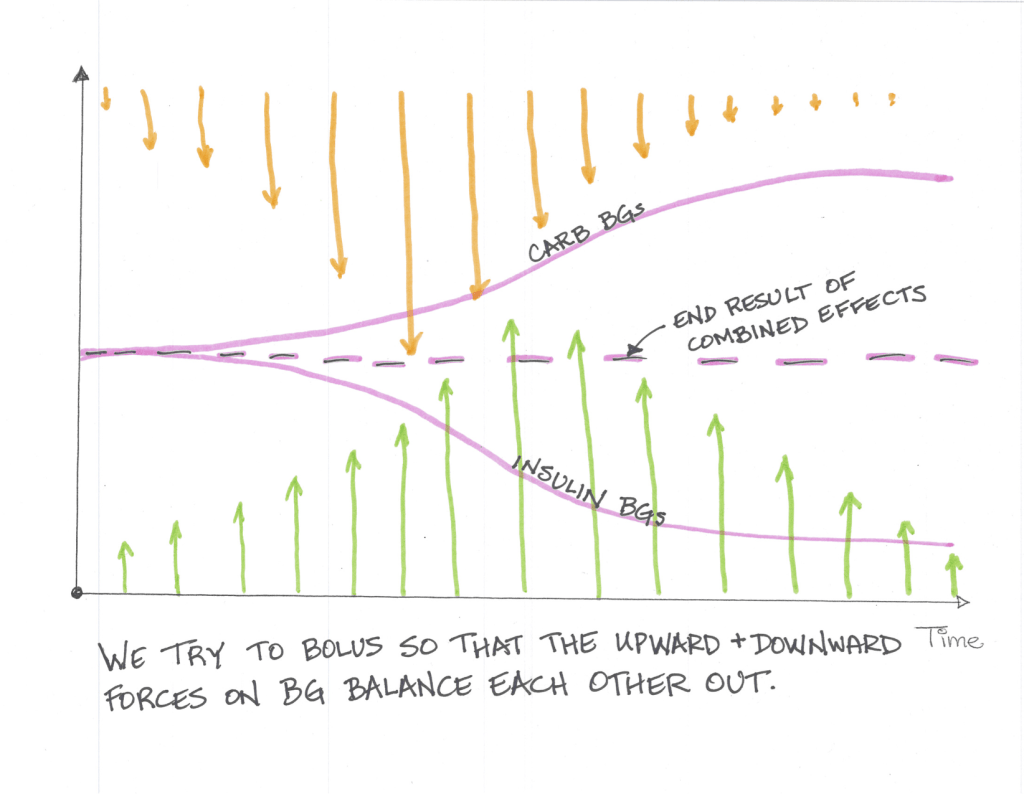
The goal of any insulin strategy would be to inject enough insulin at the correct time so that the upward force the carbohydrates exert is counteracted by the downward force the insulin exerts and you stay in range for the duration of the meal.
To analyse this I use three (3) values, standard deviation, time in range (TIR) and Coefficient of the variation. These three (3) values will assist you in determining how good or bad a meal was for you in terms of blood sugar impact (BGI).
Time in Range (TIR): For TIR we are looking for a high percentage of your readings within a normal (I use 3.9-7.8 mmol/l ) range.
Standard Deviation: For standard deviation I look for values under 1 as a meal that has little to no blood glucose impact (BGI).
Coefficient of the variation (CV): Is the standard deviation divided by the average glucose. Its a measure that helps normalise the results by reducing the influence on average glucose. Most studies indicate that anything under 33% is good.
As we can see by the table below that this snack consumed with the correct insulin strategy resulted in very stable blood glucose over a number of hours, with little deviation. What should be noted is that the sugar alcohol started to effect readings after 3 hours and that 1 hour prior to consumption I had exercised. The exercise would have increased my insulin sensitivity.
Time in Range (TIR): 100%
Standard Deviation: 0.38
Coefficient of the variation (CV): 0.06
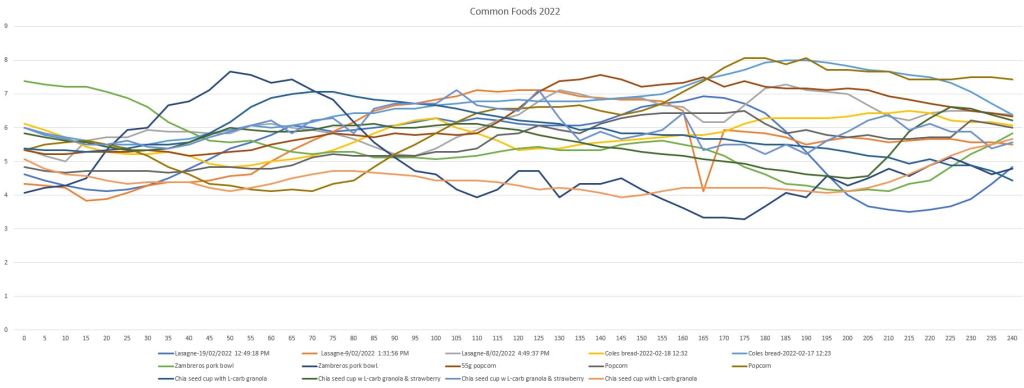
Read my post on some common foods I eat to gain a better understanding of how this meal impacted me in comparison.
The below is a list of foods I commonly eat that I decided to analyse. I have listed some lower-carb high protein meals, snacks and a few higher-carb meals. These are all more regular meals so I have had the opportunity to adjust my insulin strategy to better cover the various aspects of the meal.
Part of my strategy is to adjust the insulin timing (pre-bolus), starting BG (using temp targets or exercise) and the amounts of insulin used. The amount of insulin used needs to be adjusted based on the macronutrient composition, the amount of fibre and the amount of sugar alcohol in your meal. Sugar alcohols are often not listed on food labels in Australis and those foods should be avoided. Read my post on injecting for protein and fat for a better understanding of how your insulin dose will need to be adjusted to compensate for protein and fat.
To analyse a meal I use three (3) values, standard deviation, time in range (TIR) and Coefficient of the variation. These three (3) values will assist you in determining how good or bad a meal was for you in terms of blood sugar impact (BGI). You can also use the difference between the 3 hour and 5 hour standard deviations to ascertain if you are covering gluconeogenesis correctly.
Time in Range (TIR): For TIR we are looking for a high percentage of your readings within a normal (I use 3.9-7.8 mmol/l ) range.
Standard Deviation: For standard deviation I look for values under 1 as a meal that has little to no blood glucose impact (BGI).
Coefficient of the variation (CV): Is the standard deviation divided by the average glucose. Its a measure that helps normalise the results by reducing the influence on average glucose. Most studies indicate that anything under 33% is good. The lower the number the better the outcome.
On the 04 February 2022 I decided to switch from FreeAPS (Loop) over to AAPS. At that point I had been successfully looping for 6 months with FreeAPS (Loop) but I wanted to get some experience with the oref1 algorithm in the hopes of fine-tuning my diabetes management during sports and to try out unannounced meals.
I was conflicted in the beginning as I was seeing results consistent with my goals on FreeAPS (Loop), but It was something I wanted to try. I am glad that I did.
The first few weeks on AAPS can be painful as you learn the system and go through the objectives. I had completed as many as I could using a virtual pump so It wasn’t long before I was able to close the loop again this time using AAPS. I expect my numbers will improve once again when automations are available to me.
Setup and Configuration:
For the first few days I was still using the Dexcom IOS app as my collector app sending my BG readings to the King King Mini 2 (KKM2) to be processed by AAPS, this worked well as I was always in areas with reception. I did this because I wanted to be able to switch back to Free-APS quickly if I decided that AAPS wasn’t working for me. The first sensor on the KKM2 I paired with xDrip+. I loved xDrip as it provided heaps of additional data, but I had issues with delayed and missed readings. I have now switched to the the Dexcom BYOD app and this seems to be proving readings more consistently. I am using an Anubis transmitter but I am unable to validate battery level with the Anubis Tool on the KKM2.
Stats:
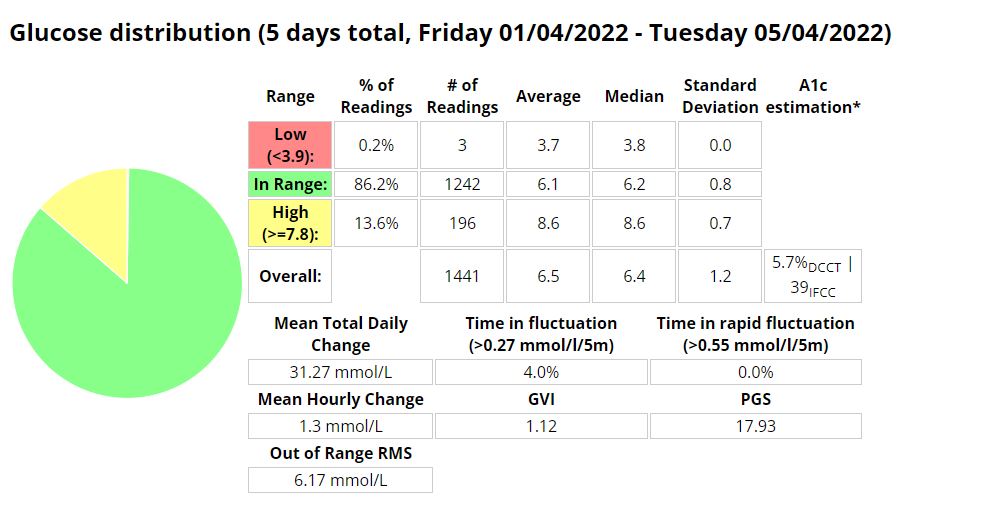
Last 22 days on Loop (FreeAPS)
…
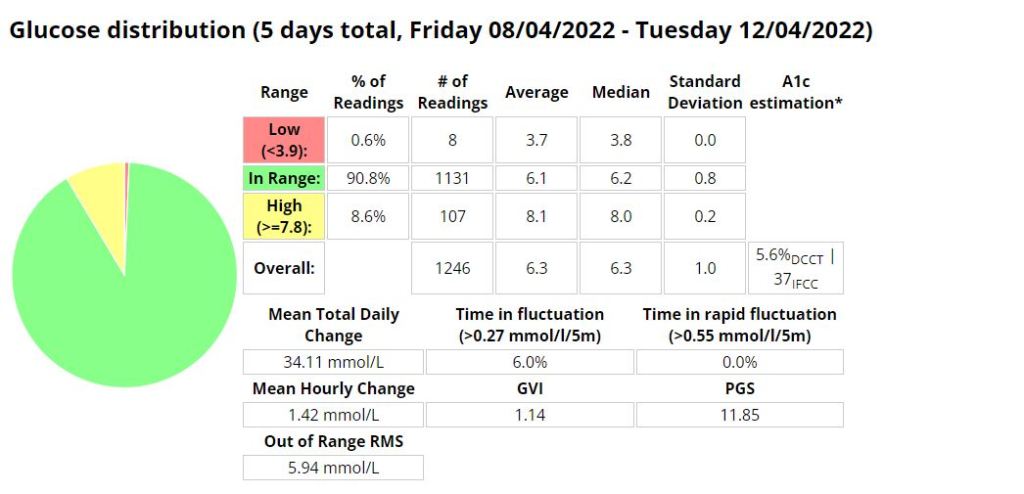
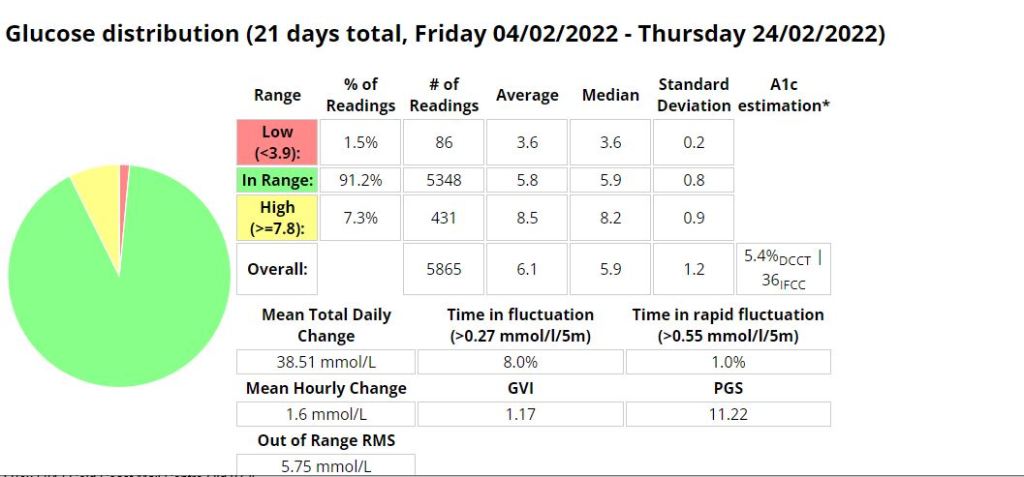
First 21 days on AAPS
Likes:
Improved Time-in-range (TIR) (+7.7 %), average blood glucose (-0.2 mmol/l), GVI, PGS and A1C even though AAPS was new to me and I was still figuring a few things out. I achieved this exercising less than I usually do due to weather.
Better control with less work.
More flexibility – The ability to scale and tailor your meal or correction dose is awesome (include trend, IOB, COB, correction percentage and your blood glucose readings in the the calculation for increased control and precision).
Fewer (0.2% less) low events.
Quicker to respond to bring high blood sugars down.
Unannounced meal management (UAM) using the Oref1 algorithm (not tested).
No Apple Developer licence fee (I paid less for my KKM2 than I was paying for my annual developer license).
Easier to setup and deploy to the KKM2 than the Free-APS (Loop) app.
Remote (SMS) bolus.
The ability to super bolus (include basal for a specific period with a bolus).
Super micro bolus’ (SMB) are more effective at dealing with gluconeogenesis from high protein meals.
Autosens has been useful by identifying periods of insulin resistance or sensitivity and adjusting basal accordingly.
Dislikes:
My pump (Medtronic 522) is using batteries more frequently (60% quicker on AAPS).
Bluetooth (BT) drop-outs more frequently than loop. In the last 21 days I have had 6 ‘Pump unreachable’ errors and 3 ‘Missed BG readings’. This resulted in elevated blood glucose during the evening.
The KKM2 battery drains faster when I am around multiple other Bluetooth enabled devices than what the iPhone did.
The connection between the Phone (King Kong Mini 2) to the Orangelink and pump seems a little less stable than with the with the iPhone and loop, but I suppose you can expect a far inferior Bluetooth chip on a phone that costs a 10th of the price. This is easily remedied by restarting the Orangelink , turning BT on and off or in some cases, usually with the the pump unreachable error, I had to restart my phone.
I really liked the ICE (Insulin Counteraction effect) data in Loop. It was useful to see where I went wrong with my previous bolus and AAPS doesn’t have this data readily available like Loop did. If you were using UAM it would be unnecessary.
13th Feb 2022 (updated 18th October 2022 to include unannounced meals)
In recent years scientists have discovered that carbohydrates are not the only macronutrient that has an effect blood sugar. In fact there are more and more medical studies exploring the effects of the other macronutrients (fat and protein) on blood sugar, and the complications they pose to blood sugar control. In the post below I provide my understanding and explore how I inject for protein and fats using an artificial pancreas system (APS).
Fat itself doesn’t get converted through gluconeogenesis into carbohydrates, but glycerol from the hydrolysis of TAGs can be metabolised to pyruvate and makes up between 5-15% of the weigh of TAGs, so only part of the TAGs would be converted into glucose.
Fat does have an impact on gastric emptying, slowing the process down by delaying and reducing glycaemic and insulinemic responses.
Meal protein influences hormones such as cortisol, growth hormone, IGF-1 and ghrelin. These changes impact insulin resistance and increase insulin requirements.
90% of the amino acids found in protein are converted into glucose through gluconeogenesis and will increase blood glucose.
How do I inject for the effects of fat and protein?
There are currently a few different methods to deal with the effects of protein and fat on blood glucose, I will outline the one I mostly use, but if you are on multiple daily injections (MDI) I strongly suggest reading Dr. Bernstein’s diabetes solution for an approach using regular insulin. All of these approaches require some experimenting on your part.
Loop / Android APS
Depending on the macronutrient profile, I shift my approach appropriately. I generally eat low-carb high protein meals as these meals are more easily managed by an APS or covered by MDI. For these types of meals I use the formula eCarbs (extended carbs) = (Protein *25%) + (Fat *10%). I then add an absorption time of around 5-6 hours, unless the fats are above 40g, then I would increase the absorption time to 7-8 hours to counter the delayed gastric emptying caused from the increased fat content.
If the fat content is more than 60g, I prefer to add 30% to the total carb count and then split the dose 60/40 (this amount will vary on the protein content and your body’s ability to digest the food) . This can either be done by scheduling the second dose or by using an extended bolus.
Its often a hit and miss process. So I keep detailed notes to help me repeat the process should I guess correctly and want to eat that meal again. Otherwise its used as a variable and adjusted the next time I eat that meal.
Unannounced meals (UAM) – Android APS / OpenAPS
Another mechanism of managing high protein, moderate fat meals is though an Android APS / OpenAPS function called unannounced meals (UAM). This is extremely low input (All you need to do is not add carbs to AAPS). This requires you to manage your expectations somewhat in terms of how much fat AAPS can manage without user intervention, but moderate fat high protein meals can be managed with minor deviations and no user intervention as can be seen in the example below and is a complete game changer in terms of quality of life.
Goal
The goal of any meal as far as I am concerned is to keep your readings within a normal blood sugar range for the entire duration of the meal, whilst minimising any sudden spikes in blood sugar, essentially mimicking a working pancreas. To analyse this I use two values, standard deviation and time in range (TIR). These two (2) values will assist you in determining how good or bad a meal was for you in terms of blood sugar impact.
Time in Range (TIR): For TIR we are looking for a high percentage of your readings within a normal (I use 3.9-7.8 mmol/l ) range.
Standard Deviation: For standard deviation I look for values under 1 as a meal that has little to no blood glucose impact (BGI).
Coefficient of the variation (CV): Is the standard deviation divided by the average glucose. Its a measure that helps normalise the results by reducing the influence on average glucose. Most studies indicate that anything under 33% is good.
Here are my top 5 meals in terms of standard deviation (SD) and time-in-range (TIR).
You will notice that all the meals are low-carb high protein meals. My blood sugar hardly deviated in the first 3 hours of eating and then had a slight bump during the absorption of proteins later. This can be seen by observing the differences in the three (3) and five (5) hour standard deviation values. The first set of standard deviations being lower represent blood sugars that are close to the each other in number and not changing much, then they start getting a litter larger as blood sugars rise (so the SD gets higher) as the proteins digest in the last 2 hours.
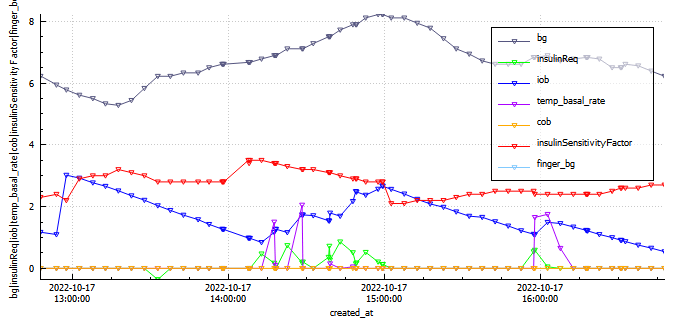
Example of Android APS (UAM) counteracting the absorption of proteins and fats
An export of the device status for the 4 hours post meal consumption.
In the graph above we can see sugars (grey) steadily rise and peak (8.2 mmol/l) at around the two (2) hour mark due to protein digestion (gluconeogenesis). By the four (4) hour mark the system has infused an additional 3.2 units of insulin through super micro boluses (SMBs) and temporary basal adjustments to bring sugars down to a comfortable, but not perfect 6.2 mmol/l. This was completely managed by AAPS with no intervention by myself. Using additional functionality in AAPS we could provide insulin more quickly using automations and profile switches to further reduce the impact of protein. If we use the Loop eCarb formula previously stated, then insulin required for fat and protein equates to 3.3 units.
Meal Name
Insulin
Carbs
Protein
Fat
Start BG BG
End BG
Average 2 hours
Average 4 hours
Time in Range 2 hours (3.9-7.8)
Time in Range 4 hours (3.9-7.8)
Lunch
2 units @ meal start
18.4g
62g
41g
5.8 mmol/l
6.2 mmol/l
6.69 mmol/l
6.87 mmol/l
85.1%
88.6%
Table providing results from UAM during lunch..
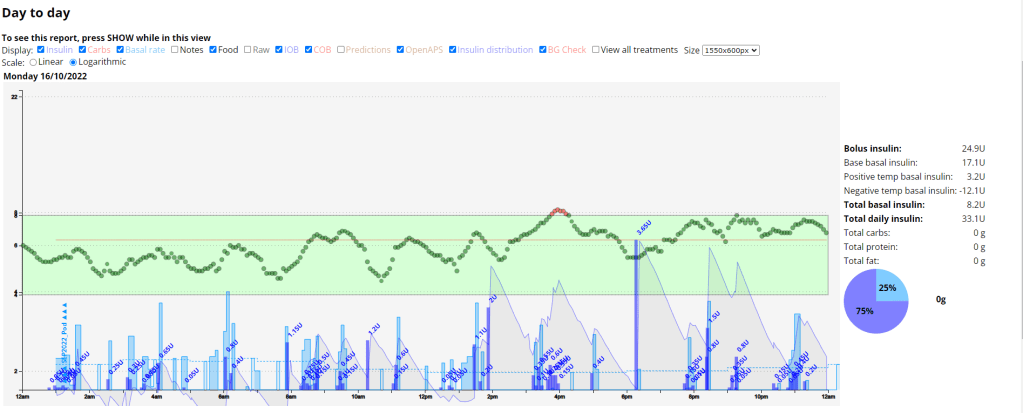
Daily graph exported from Nightscout.
As you can see from the Nightscout graph, no carbs have been entered into AAPS and results have been outstanding.
Example of Loop counteracting the absorption of proteins and fats
In the picture below we can see how Loop manages gluconeogenesis (eCarbs or extended carbs) from a low-carb high protein meal I ate.
At the top of the Loop user interface (UI) (the yellow arrow) we can see that Loop is issuing a 2.3U temporary basal (temp basal) almost three hours after I injected for the meal. This temp basal is to counter the absorption of the fats and proteins. These temp basals’ are issued and adjusted multiple times during the course of the meal digestion timeframe.
In the Insulin delivery section of the Loop UI (the red arrow) we can see Loop delivering insulin in the form a temp basal. It takes multiple hours for the protein to be synthesised into glucose and so a temporary basal can easily manages the resultant rise in blood sugar from gluconeogenesis.
In the Active carbohydrates section of the Loop UI (the blue arrow) we can see that there are still 14g of unabsorbed carbohydrates that Loop will manage with temporary basals’.
The picture below is from the ICE (Insulin Carbohydrate Effect) chart displaying a graphical representation of the predicted vs observed blood glucose effects that insulin and carbohydrates have on the body.
A graphical view of the absorption process.
Meal examples
Here are a few examples of meals I eat, not all are low-carb meals, but all meals are under 50g of carbs.
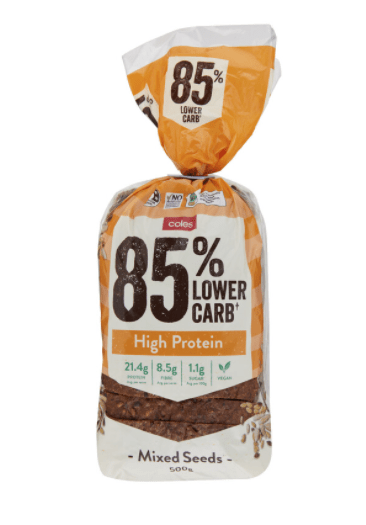
Is the new Coles low-carb bread type 1 diabetic friendly? Yes I think it is, read more below to discover why I think it is.
Review
Nutritional Information
Insulin Strategy
Goal
Results
When trying anything new I always read the nutritional information on order to determine the impact it will have on my body. Certain high fat foods can cause insulin resistance and inflammation and will delay gastric emptying while protein will digest and get synthesised into carbohydrates.
Insulin Strategy
The strategy I used for this meal was based on the insulin type and macro composition. I injected for the carbs + (1/2 fibre) right before I ate as the Fiasp I use works almost immediately and so no pre-bolus was required. I then extended carbs at (protein*25%) + (fat *10%)
Goal:
The goal of any insulin strategy would be to inject enough insulin at the correct time so that the upward force the carbohydrates exert is counteracted by the downward force the insulin exerts and you stay in range for the duration of the meal.
To analyse this I use three (3) values, standard deviation, time in range (TIR) and Coefficient of the variation. These three (3) values will assist you in determining how good or bad a meal was for you in terms of blood sugar impact (BGI).
Time in Range (TIR): For TIR we are looking for a high percentage of your readings within a normal (I use 3.9-7.8 mmol/l ) range.
Standard Deviation: For standard deviation I look for values under 1 as a meal that has little to no blood glucose impact (BGI).
Coefficient of the variation (CV): Is the standard deviation divided by the average glucose. Its a measure that helps normalise the results by reducing the influence on average glucose. Most studies indicate that anything under 33% is good.
Results:
As we can see in the table below, the low-carb bread paired with the correct insulin strategy resulted in very stable blood sugars over a number of hours.
Time in Range (TIR): 100% (average)
Standard Deviation (SD): .5 (average)
Coefficient of the Variation (CV): 10% (average)
Read my post on some common foods I eat to gain a better understanding of how this meal impacted me in comparison.
It’s been 73 days since I started looping. I have had a difficult December with a sprained wrist from a mountain bike accident and myself, my daughter and my wife had gastro which resulted in very little sleep and some abnormal readings. In fact I am still having abnormal sensitivity to insulin, resulting in frequent lows or blood sugar swings. I also had two failed Dexcom sensors and moved to the code calibration method which resulted in two days of false high CGM readings in comparison to my blood glucose readings. I’ll add the CGM stats once I am finished the analysis. Hello 2022!
Blood Glucose Stats
Blood glucose stats
A marginal improvement in December over the fist two months, but I still have a lot of work to do to get to my goal of a 5.5% A1C. Interestingly enough, after the gastro I am now 40% more sensitive to insulin, so hopefully now that I am aware of this I can get back to better blood glucose readings. I will also need to run in open-loop when changing Dexcom sensors to avoid all the issues I was previously having with false high blood glucose readings causing my Loop to micro-bolus incorrectly or increase my basal in error. Still not sure how I will handle protein in open-loop.
Exercise Stats 2021-2015
Total distance exercised
Total time spend exercising
I more than doubled (55%) the amount of hours I spent exercising in 2021, mostly as I was working from home which allowed me to spend more time exercising. As my A1C lowered, my fitness levels improved dramatically.