This week was the best so far. I did my longest run to date (12km) and had a really good gym week lifting (approx. 20% more volume). My diabetes control is improving (thank you AAPS and exercise) and I have learned a lot digging though my data and through responses from the previous weeks question regarding carb sensitivity factor (CSF) being used to measure insulin sensitivity post exercise. I made some strides in my glucose management tool which also felt great.
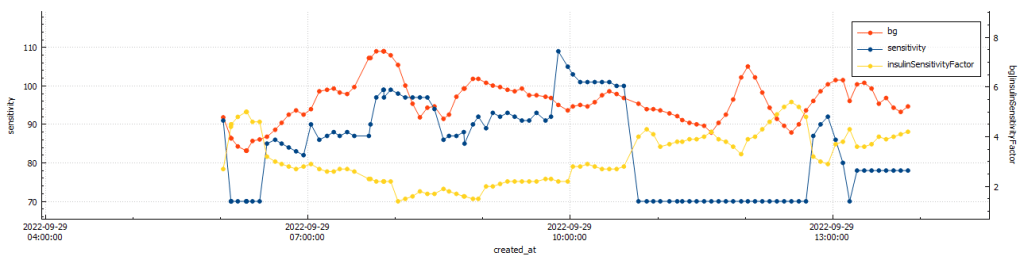
BG vs. ISF vs. insulin sensitivity post gym (@11:48:09 – 42min)BG vs. ISF vs. insulin sensitivity post run (@11:49:30 – 33min)
After gym sensitivity increased to 115% directly post training, while my sensitivity was stable at 78% post my run.
Body Metrics
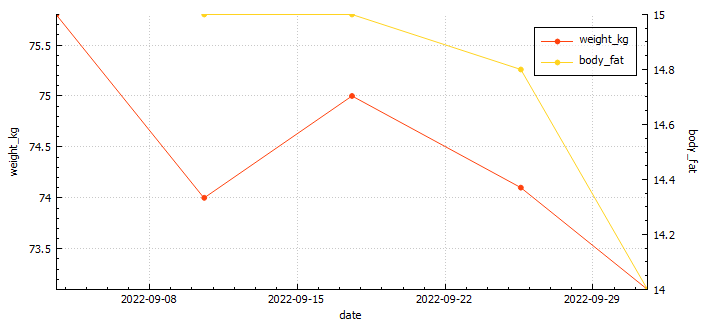
Body mass vs. body fat
Start
Week 1
Week 2
Week 3
Week 4
Weight (kilograms)
75.8
74
75
74.1
73.1
Body fat percentage (according to Samsung)
17.3%
17.8
*
*
Body fat percentage (according to the navy seal calculator)
15%
15%
14.8%
14%
Total volume
Table stating the weekly body metrics I am tracking.
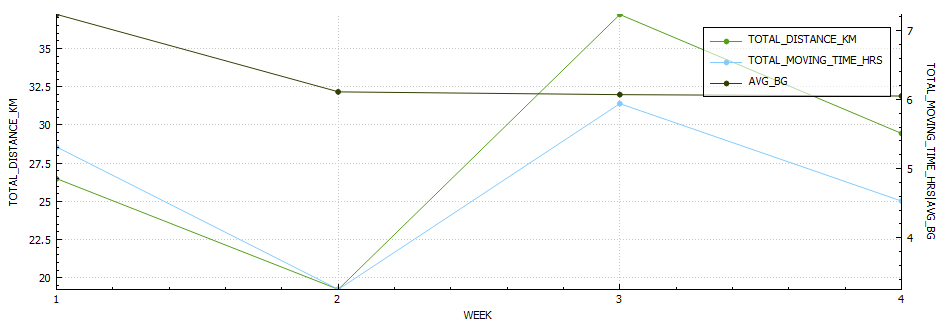
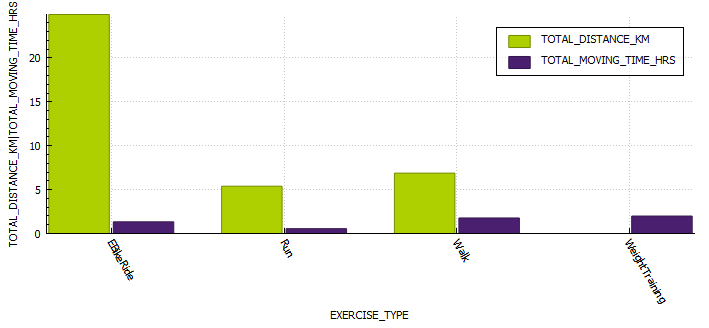
Exercise
Week 1
Week 2
Week 3
Week 4
Distance (kilometres)
25.17
20.54
37.22
29.4
Activity (hours)
4.34
3.65
5.64
5.4
Table stating the weekly exercise metrics I am tracking
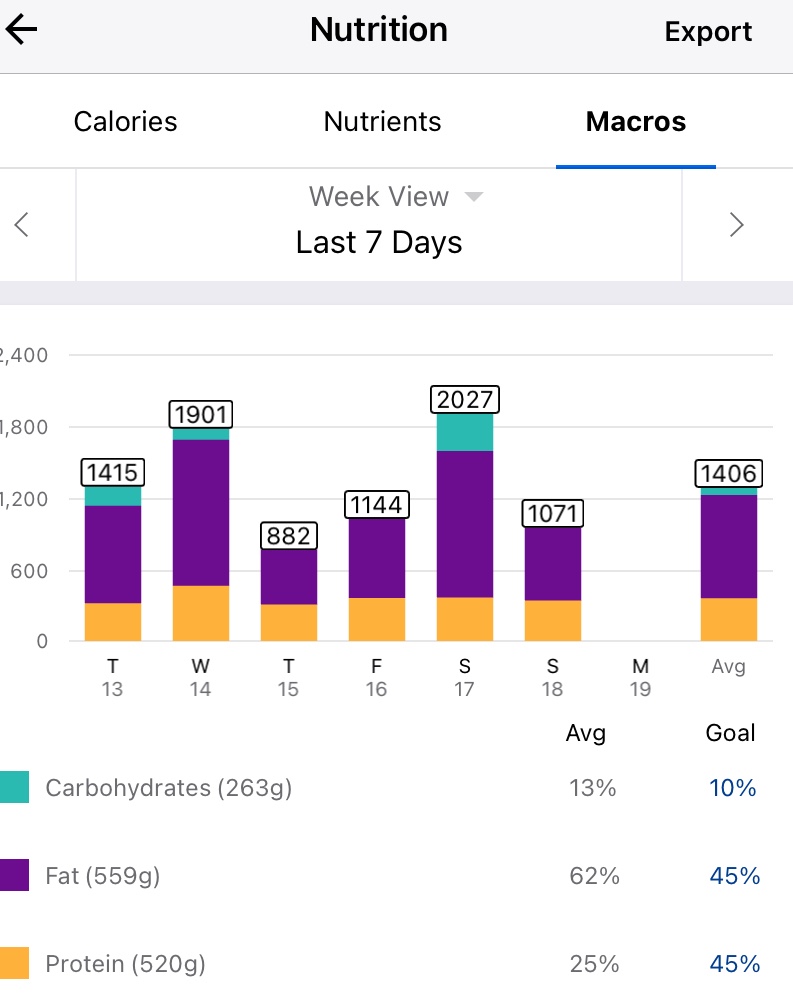
Nutrition
Screenshot of average macro-nutrients consumed during week 4
Screenshot of average macro-nutrients consumed during week 4
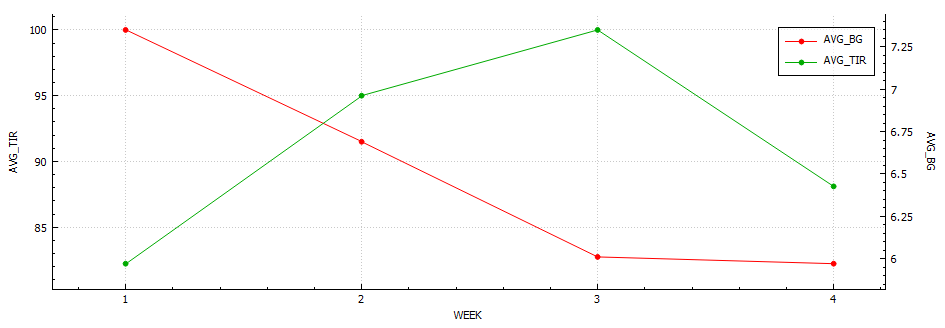
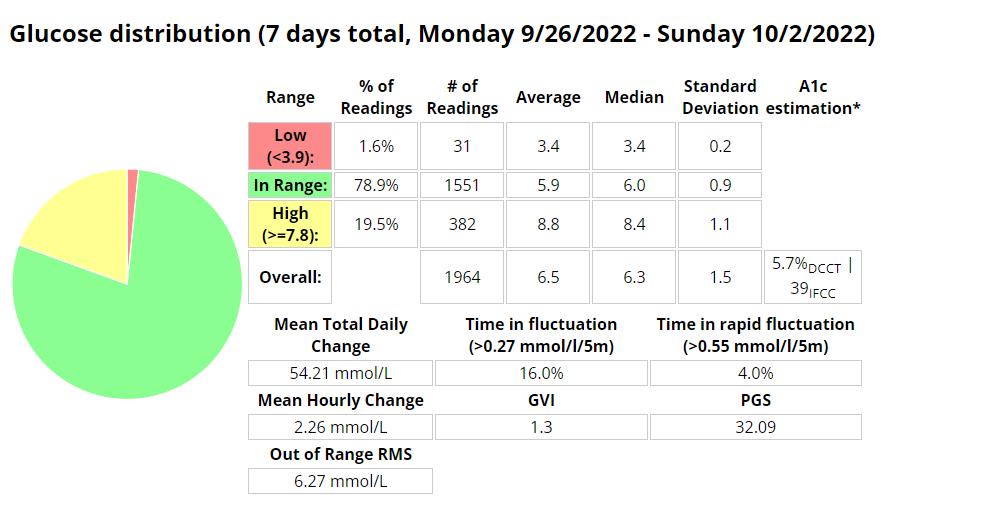
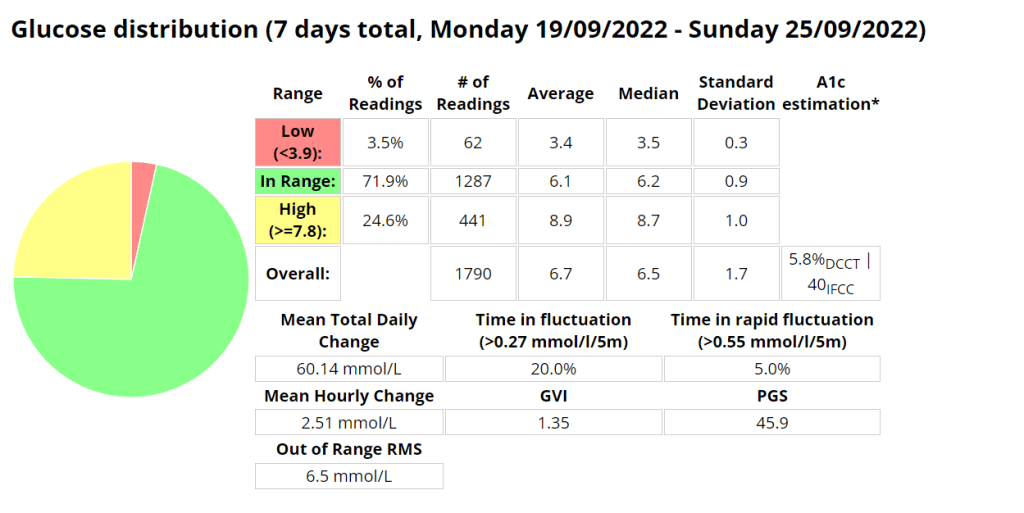
Diabetes
Week 1
Week 2
Week 3
Week 4
Low (<3.9) (%)
0.9
0.6
3.5
1.6
In Range (3.9-7.8) (%)
75.3
74.7
71.9
78.9
High (>= 7.8) (%)
23.8
24.7
24.6
19.5
Standard deviation (SD)
1.3
1.7
1.7
1.5
Average (mmol/l)
6.8
7.0
6.7
6.5
A1c estimation (%)
5.9
6.0
5.8
5.7
Table stating the weekly diabetic metrics I am tracking.
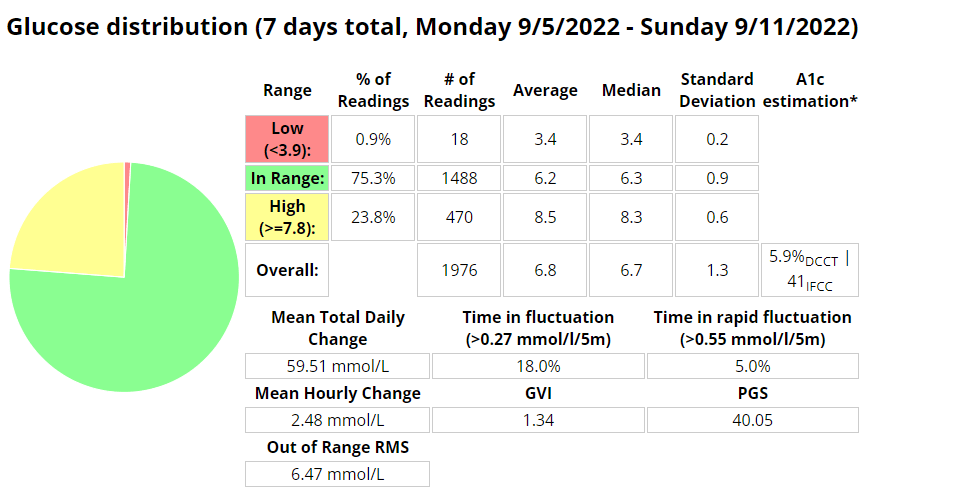
Ideally I want to see a time-in-range (TIR – 3.9-7.8 mmol/l) exceeding 90% with an average in the low sixes and a standard deviation (SD) around one (1).
I am starting to feel like a routine is forming, perhaps not around diet yet, but definitely in regards to training. In previous years of doing this I was eating clean most days, as it provided improved diabetic control in the absence of an APS/AID and pump.
This week was particularly heavy due to my birthday dinner, a new phone, a new version of AAPS (Boost test platform 3.6.5) and a 25 km cycle. *I have been unable to pair my galaxy watch with my new phone, which is sad as I really liked the watch and having the plethora of sensors.
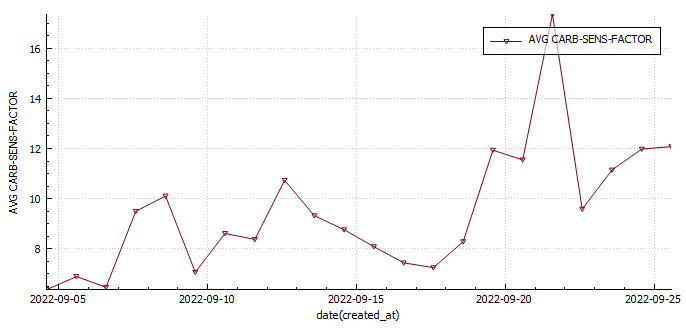
I was investigating the possibility of measuring insulin sensitivity changes in AAPS . One way would be to use the autosens feature in AAPS , but since I wasn’t including the carbs I ate to fix hypos, and I was snacking in-between to keep my readings steady that wasn’t going to work. The only metric that may prove useful may be my carb sensitivity factor (CSF). The average CSF over the 22 days so far is 8.7 while the average sensitivity ratio was 106%. This would mean that according to CSF I was 36% more sensitive to carbs yesterday or 29% less sensitive according to autosens.
Body Metrics
Start
Week 1
Week 2
Week 3
Week 4
Weight (kilograms)
75.8
74
75
74.1
Body fat percentage (according to Samsung)
17.3%
17.8
*
Body fat percentage (according to the navy seal calculator)
15%
15%
14.8%
Total volume
Table stating the weekly body metrics I am tracking.
Exercise
Week 1
Week 2
Week 3
Week 4
Distance (kilometres)
25.17
20.54
37.22
Activity (hours)
4.34
3.65
5.64
Table stating the weekly exercise metrics I am tracking
Nutrition
Screenshot of average macro-nutrients consumed during week 3
Screenshot of average macro-nutrients consumed during week 3
Diabetes
Week 1
Week 2
Week 3
Week 4
Low (<3.9) (%)
0.9
0.6
3.5
In Range (3.9-7.8) (%)
75.3
74.7
71.9
High (>= 7.8) (%)
23.8
24.7
24.6
Standard deviation (SD)
1.3
1.7
1.7
Average (mmol/l)
6.8
7.0
6.7
A1c estimation (%)
5.9
6.0
5.8
Table stating the weekly diabetic metrics I am tracking.
Ideally I want to see a time-in-range (TIR – 3.9-7.8 mmol/l) exceeding 90% with an average in the low sixes and a standard deviation (SD) around one (1).
The second week I have gained a little weight (surprise its not muscle) and had a reduction in exercise hours, which was mostly due to a very long ride I had the previous week.
My diabetic metrics have declined and I feel like all of this mostly due to my diet which needs tweaking.
Body Metrics
Start
Week 1
Week 2
Week 3
Week 4
Weight (kilograms)
75.8
74
75
Body fat percentage (according to Samsung)
17.3%
17.8
Body fat percentage (according to the navy seal calculator)
15%
15%
Total volume
Table stating the weekly body metrics I am tracking.
Exercise
Week 1
Week 2
Week 3
Week 4
Distance (kilometres)
25.17
20.54
Activity (hours)
4.34
3.65
Table stating the weekly exercise metrics I am tracking
Nutrition
Screenshot of average macronutrient consumed during week 2
Screenshot of average macronutrient consumed during week 2
Diabetes
Week 1
Week 2
Week 3
Week 4
Low (<3.9)
0.9%
0.6%
In Range (3.9-7.8)
75.3%
74.7%
High (>= 7.8)
23.8%
24.7%
Standard deviation (SD)
1.3
1.7
Average
6.8
7.0
A1c estimation
5.9%
6.0%
Table stating the weekly diabetic metrics I am tracking.
Ideally I want to see a time-in-range (TIR – 3.9-7.8 mmol/l) exceeding 90% with an average in the low sixes and a standard deviation (SD) around one (1).
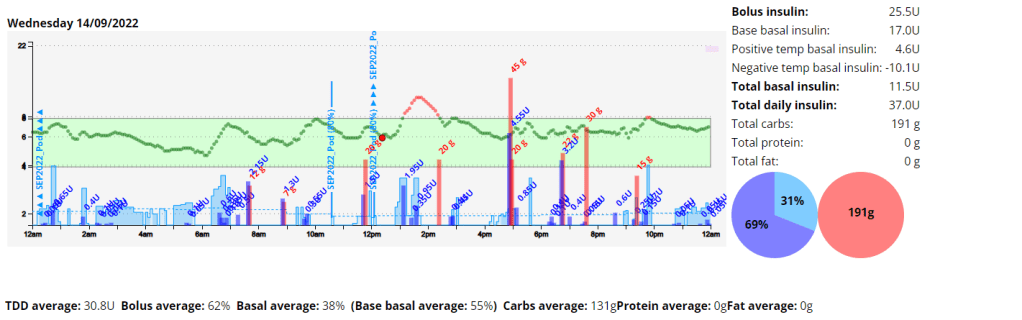
Before my run yesterday my blood glucose was lower than I felt was safe to start exercising (around 4 mmol/l ) despite reducing insulin to 70% of requirements and setting a higher temp target ( 7 mmol/l) an hour prior to exercising. I decided to eat an Anzac cookie (20g carbs) and accidently devoured some deep fried bread (30g of carbs). This was excessive to say the least ( I needed around 12g according to my calculator). It also created a complicated situation where I would need to inject prior to exercise or forego exercising all together and rather focus on injecting the appropriate amount of insulin (8.62 units) to counteract the carbs.
Factors to consider
As a rule of thumb I try to have as little insulin on-board as possible as this reduces the chances of hypoglycaemia (low blood sugar). Due to the carbs I ate I would now need to inject insulin prior to exercising or my blood glucose would rise excessively. I factored in that both fat (from the fried bread) and exercise would decrease the speed of digestion. Exercise decreases the speed of digestion as energy used for digestion would be diverted to my heart, lungs and muscles to fuel my activity and fat slows down gastric emptying and causes insulin resistance.
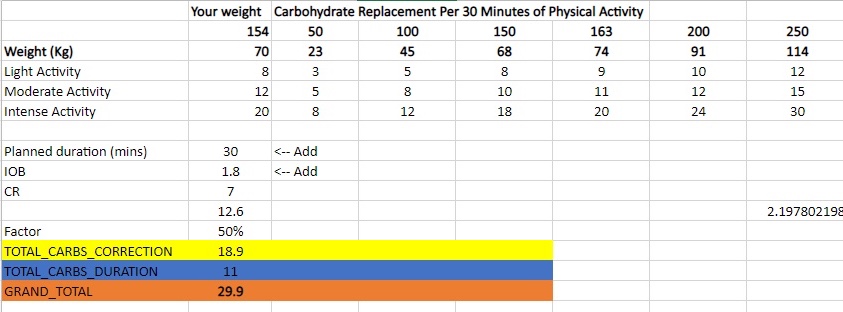
Insulin calculation
Utilising my IC ratio and exercise table I calculated I required around 1.7 units of insulin prior to the commencement of my run. I decided to be cautious and inject 1.5 units. I used a total of 4.4 units to return to euglycemia (normal blood sugar).
Insulin-to-carb ratio
carbs
Insulin Required
75%
50%
25%
20%
15%
5.8
50
8.62
6.47
4.31
2.16
1.72
1.29
Insulin calculation table
Table containing the amount of carbs I require for a specific duration of activity. This was derived from information found on the internet and my own experience.
Results
The results were by no means perfect, but at the very least I learned how much insulin I require and more or less when I should be injecting after I finish exercising. Its extremely difficult to predict how much exercise will amplify insulins activity, so it’s always safer to take a cautious approach.
My final decision was to inject 1.5 units prior to starting my activity and inject the remaining amount once my sugars started rising due to digestion resuming (around 35 minutes after stopping exercise).
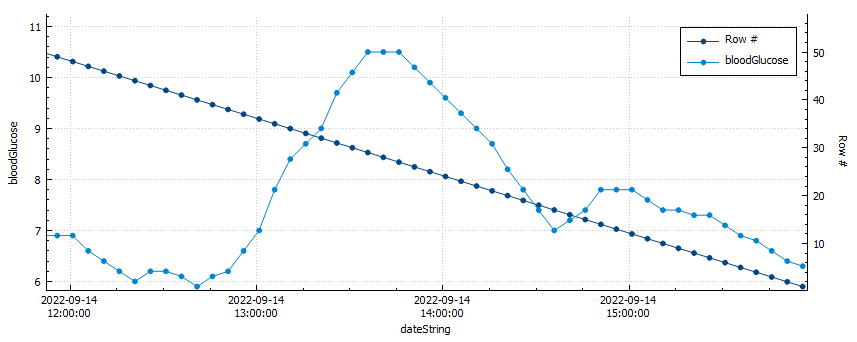
Blood glucose vs. row count
My blood sugar peaked at 10.5 mmol/l after only 1.5 units of insulin for 50g of carbs.
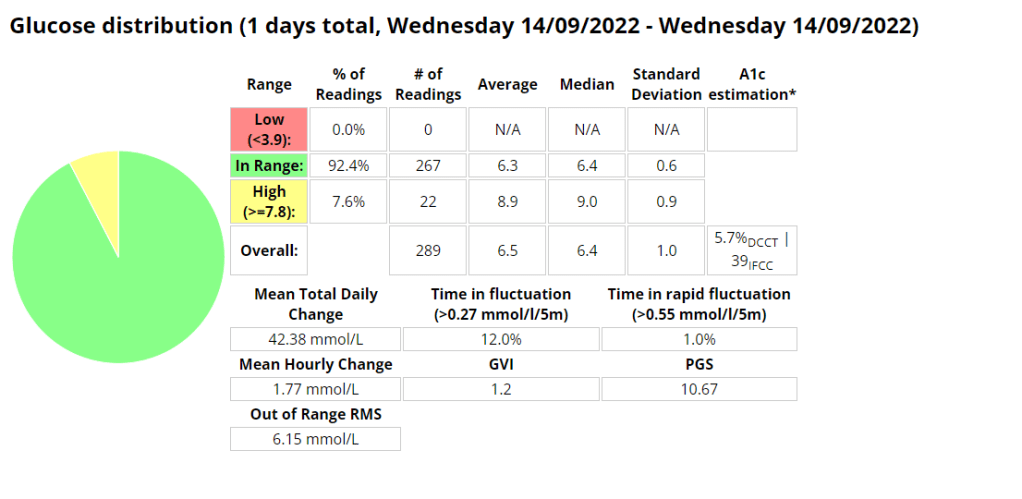
I used a total of 4.4 units of insulin (50% of the total insulin required) to return to euglycemia after my activity. My average blood glucose was 6.6 mmol/l and my time-in-range (TIR) was 100% for the duration of my activity.
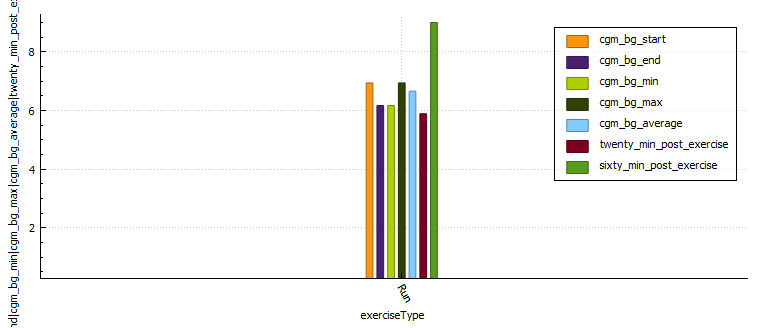
Graph with glucose control metrics during activity
Distance (km)
Moving time (minutes)
Average heart rate
Standard deviation
CGM BG start
CGM BG end
CGM BG min
CGM BG max
CGM BG average
Time in range
BG twenty minutes post exercise
BG sixty minutes post exercise
Lunch Run
4.92
29.53
170.2
0.308
6.94
6.17
6.17
6.94
6.66
100.0
5.89
9.0
Glucose control metrics
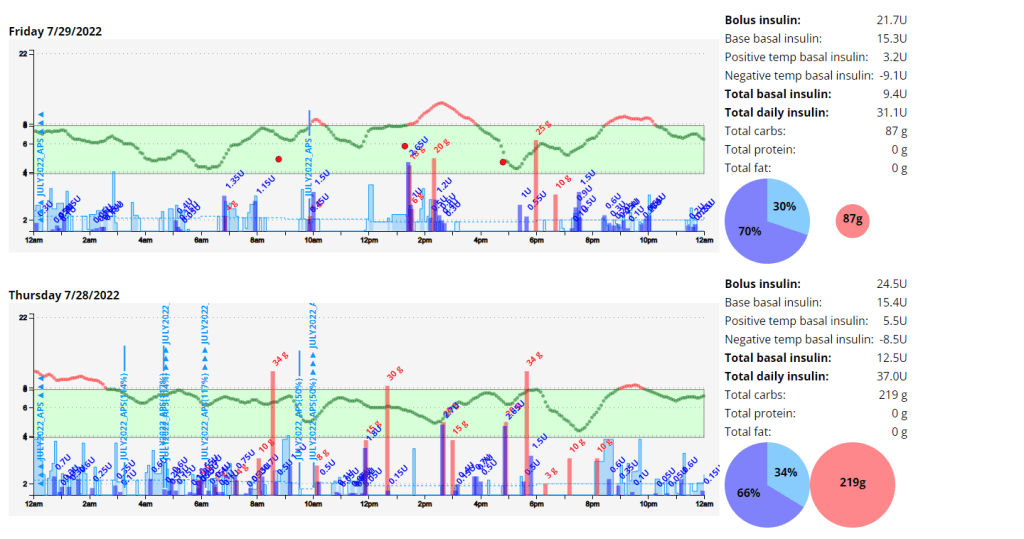
Daily overview graph with insulin and carbs.Diabetic management metrics.
My blood sugar control after exercise improved and I was happy with the results for the remainder of the day. Next time I would inject 20 minutes post exercise to prevent digestion resuming causing hyperglycaemia (high blood glucose).
The first week was challenging to say the least. As I have increased my physical activity my insulin needs seem to have fundamentally changed, and this resulted in quite a few lows. I also had some tech issues, my Android phone had an operating system error and my Dexcom sensor wasn’t enjoying the resistance training I was doing as it was inserted in my arm. I reached my activity goals but exceeded my diabetic and nutritional goals.
Body Metrics
Start
Week 1
Week 2
Week 3
Week 4
Weight (kilograms)
75.8
74
Body fat percentage (according to Samsung)
17.3%
Body fat percentage (according to the navy seal calculator)
15%
Total volume
Table stating the weekly body metrics I am tracking.
Exercise
Week 1
Week 2
Week 3
Week 4
Distance (kilometres)
25.17
Activity (hours)
6.24
Table stating the weekly exercise metrics I am tracking
Week 1 breakdown
Nutrition
Screenshot of the average and total macronutrients consumed during week 1.
Screenshot of average macronutrient consumed during week 1
Diabetes
Ideally I want to see a time-in-range (TIR – 3.9-7.8 mmol/l) exceeding 90% with an average in the low sixes and a standard deviation (SD) around one (1).
Two years ago my daughter was born. At this time I was off work for a few weeks and I had been strongly considering writing a tool that could provide some insight into managing my blood sugars, as I knew controlling my blood sugar was the best chance I had of being the best parent I cold be. At the time I was on multiple daily injections (MDI), leveraging heavily on Dr Bernstein’s teachings and using daily (if possible) exercise as a tools for glucose control.
Two years later the tool has pivoted many times, and at one time I was using machine learning (ML) to predict blood glucose during exercise, until I started using the Dexcom G6 continues glucose monitor (CGM) which was accurate enough to circumvented the need for the aforementioned tool.
At present I am using an automated insulin delivery (AID) device to deliver most of my insulin based on my shifting needs. This significantly reduces the mental burden required for good glycaemic control, as well as reduce some of the anxiety I was experiencing at meals times and when going to the doctor for diabetic checks. This system still requires manual input prior to exercise and constant tuning if you want to have the best experience, and so my tool has pivoted towards analysing this data and providing insight there.
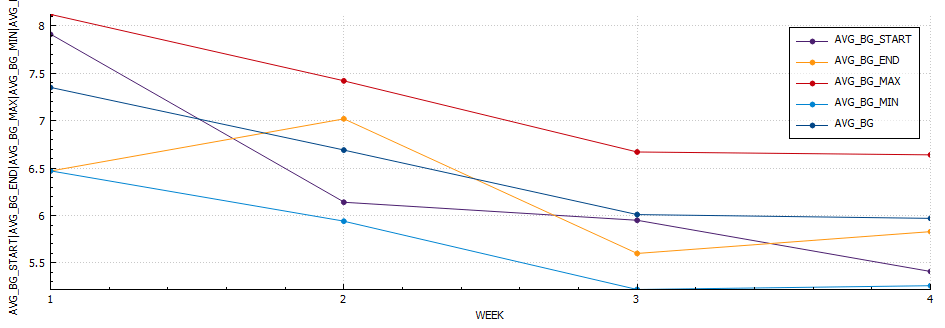
Diabetic Metrics
An analysis of the last 4 years of my diabetic journey highlights a better A1C with a lower standard deviation (SD) indicating more consistency in blood sugars. Its interesting to note the much improved time-in-range (TIR-IN) metrics once I moved over to a insulin pump using an automated insulin delivery (AID) device.
Period
Hypo (below 3.9)
In (3.9-10)
High (above 10)
Average
A1C
SD
GVI
PGS
PGR
PGR-Risk
Exercise hours
Kilometres
Pump / MDI
2019
19%
77%
3%
7.7
6.50%
2.6
1.26
40.19
2.2
Low
16
146
MDI
2020
8%
88%
3%
6.9
6.00%
2.1
1.19
17.34
1.6
very-low
67
658
MDI
2021
3%
94%
3%
6.4
5.60%
1.7
1.18
8.79
1.3
very-low
149
920
Pump (Loop) 20/11/2021
2022 (YTD)
3%
96%
1%
6.5
5.70%
1.5
1.2
5.43
1.2
very-low
75
496
Pump (AAPS)
Table displaying the last few years worth of diabetic data.
For a description of some of these values mean please read this article.
Goals
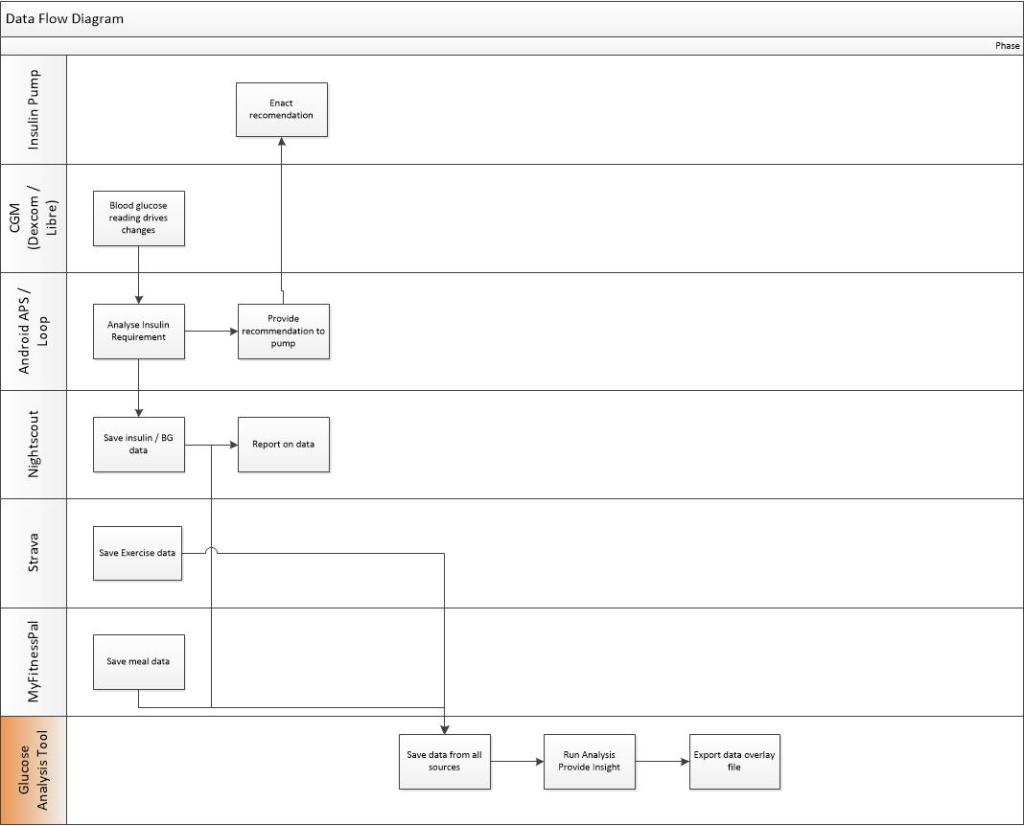
My goal was to provide some insight into what was working and was not. To do this I needed to obtain blood sugar readings as well as nutritional and exercise data. I achieved this by creating a tool that obtains data from Nightscout, Strava and MyFitnessPal This data is then processed and enriched to provide insight. I then developed a tool to export some of this data and display it on my YouTube videos. I had it connected to Garmin to extract sleep and exercise data but the Garmin API failed and I have not had time to update the program.
My tool will then do some analysis to provide some insight at a per meal or per activity level by looking at metrics like time-in-range, average glucose, standard deviation, max glucose, min glucose and many more metrics.
Below are some example’s of some of the data I am exporting and using to make decisions.
This tool is very much still under constant development, as I am always finding new stats to display and bugs with some of my current code (at present both the Garmin API and the MyFitnessPal API have issues)
Below are some graphs and tables that I created in my Tool (The graphs are generated in DB Browser, these will at some stage be created in a JS library or Python graphing library).
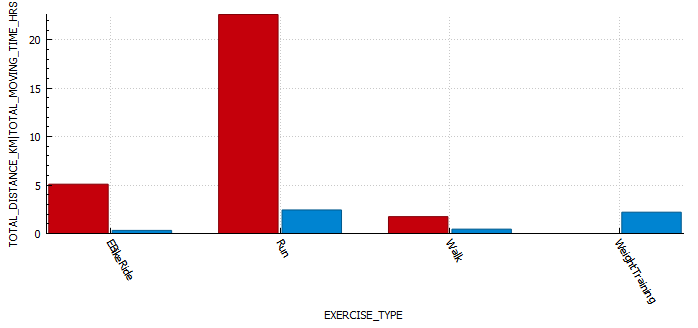
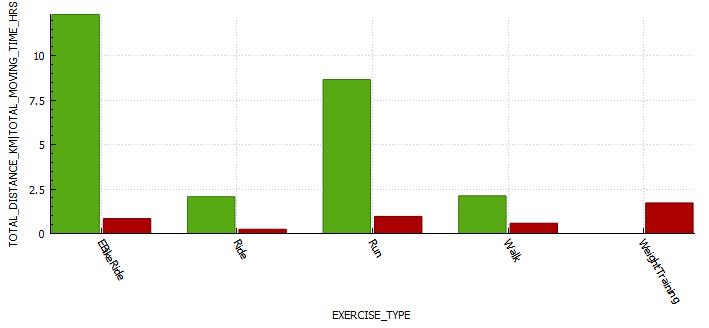
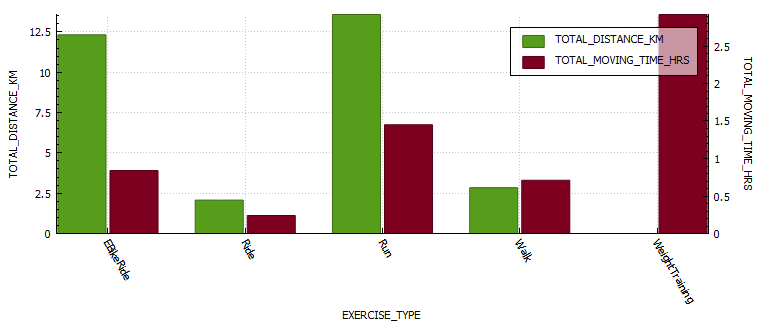
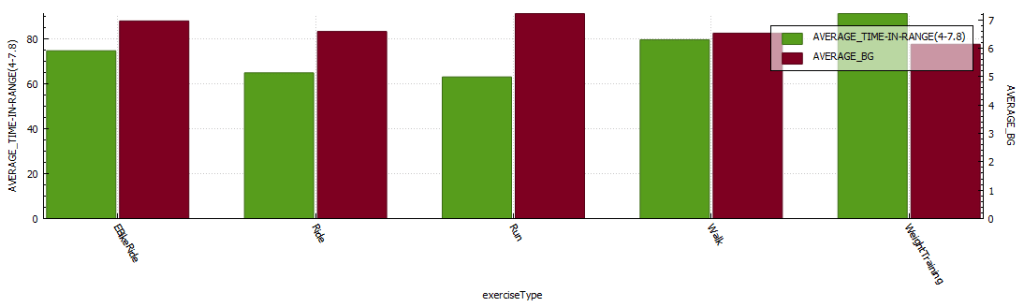
Analysis of BG vs ISF, vs Sensitivity after a run.Analysis of BG vs ISF, vs Sensitivity after gym.Average TIR (time-in-range) and average blood glucose per exercise type for 2022.
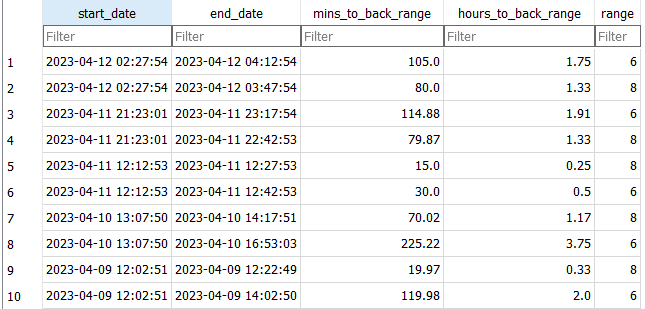
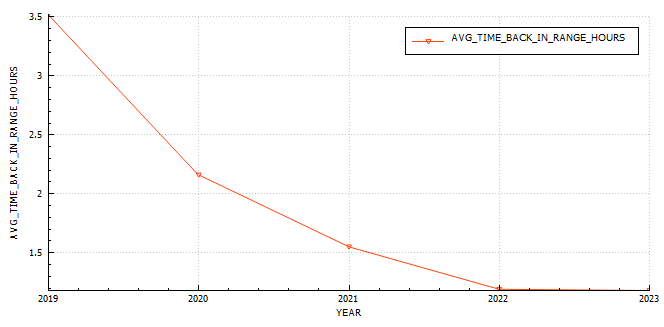
Return-to-Range
I use this table to understand how quickly the system is able to reduce sugars into a normal blood sugar range. At the moment I am using 8 and 6.
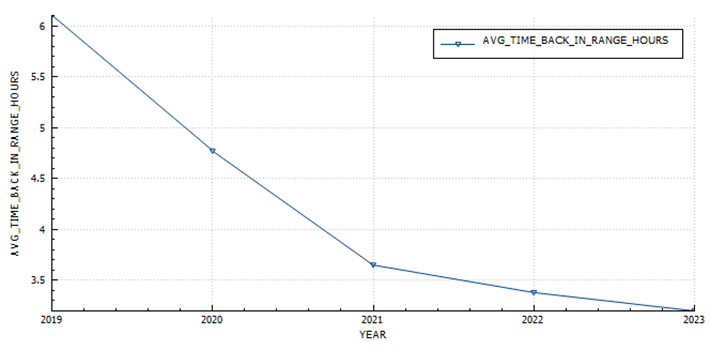
Return-to-range analysis (by year)
In 2019 It took just over 6 hours to return to euglycemia (blood glucose < 6) after a peak, in 2023 I managed to reduce that to 3.2 hours.
The average time it takes to return to a blood glucose of 6 mmol/l after a peak.
The average time it takes to return to a blood glucose of 8 mmol/l after a peak.
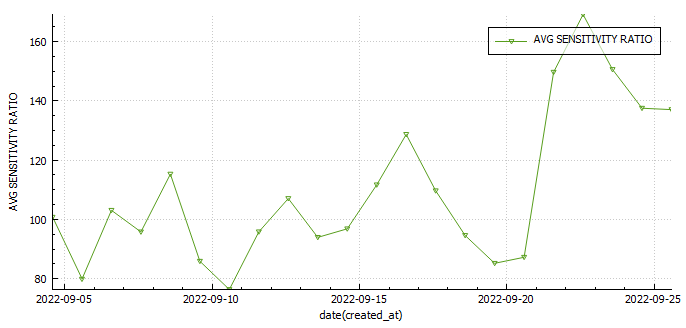
Daily Sensitivity Analysis
I find this useful to determine if I am more sensitive to insulin on certain days, usually due to exercise.
Exercise Sensitivity Analysis
The exercise sensitivity data has been updated to be hourly for 12 hours post exercise. Its now calculated via SQL (insert statement) and not a Python function into a staging table.
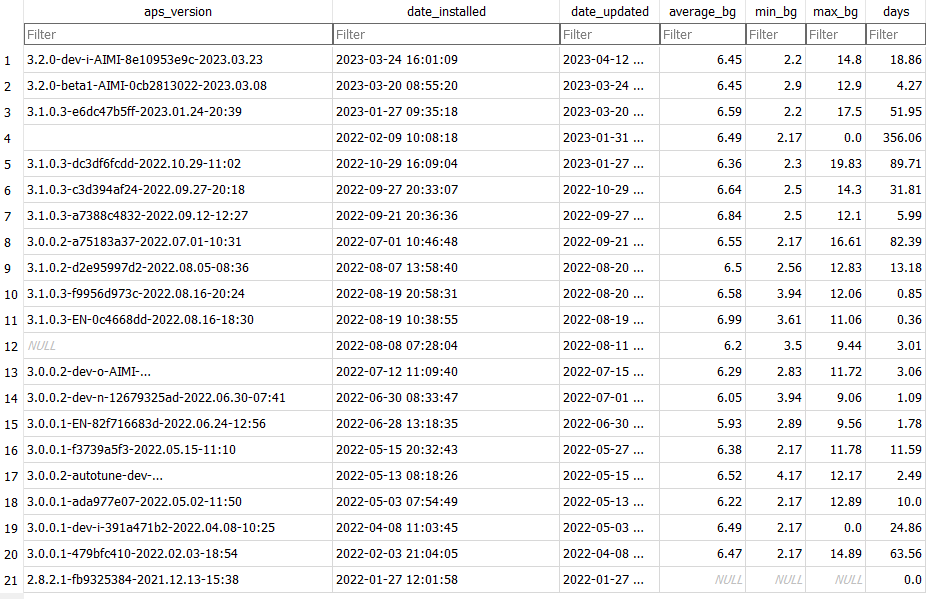
APS Version Analysis
APS Version Battery Analysis
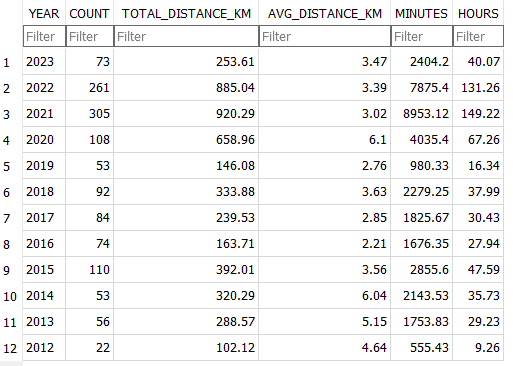
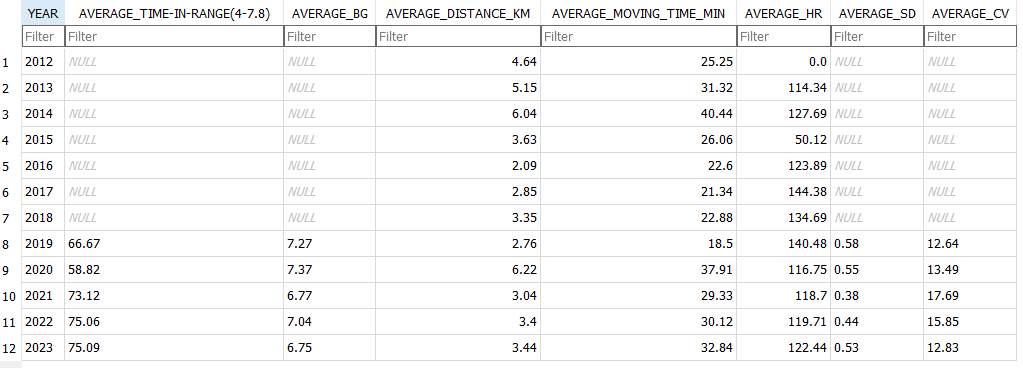
Exercise Stats Analysis (per exercise)
Exercise Stats Analysis (annual)
In the hopes of improving time-in-range while exercising I experimented with reducing insulin and used these values to provide insight into wether the changes were successful or not. In 2019 I was in-range only 66.6 of the time, in 2023 I am in-range 75%, with a slight improvement in glucose while exercising.
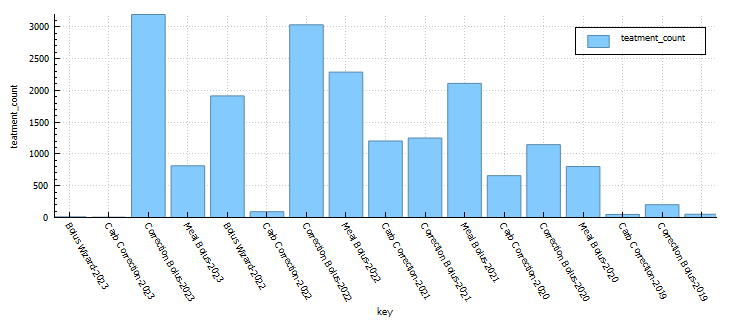
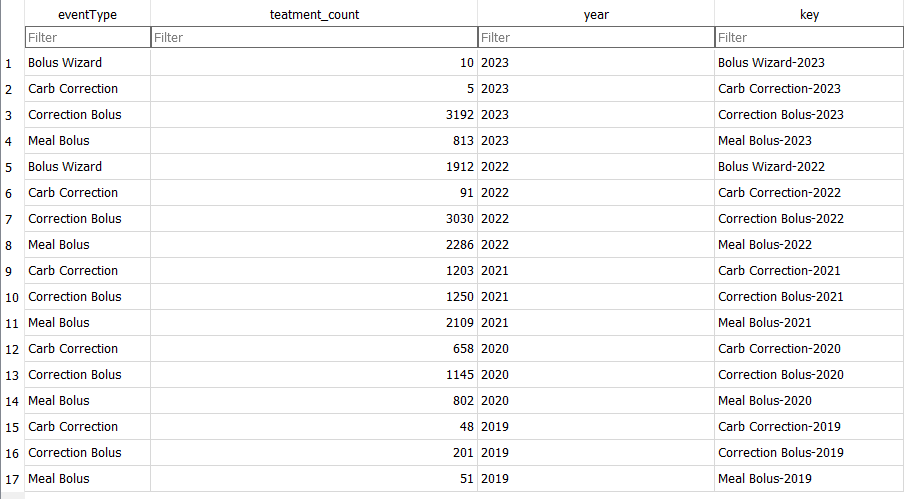
Treatments Analysis (per treatment)
Treatment Type Analysis
I use this table to understand how frequently I am interacting with the loop. This has little impact on the version of the variant of Android APS I am using.
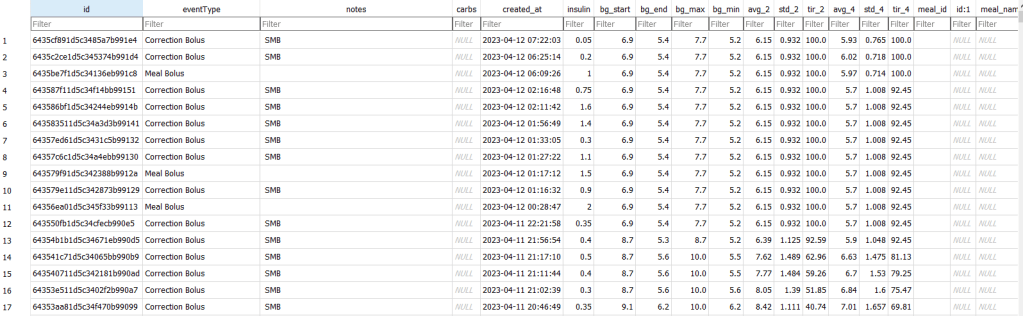
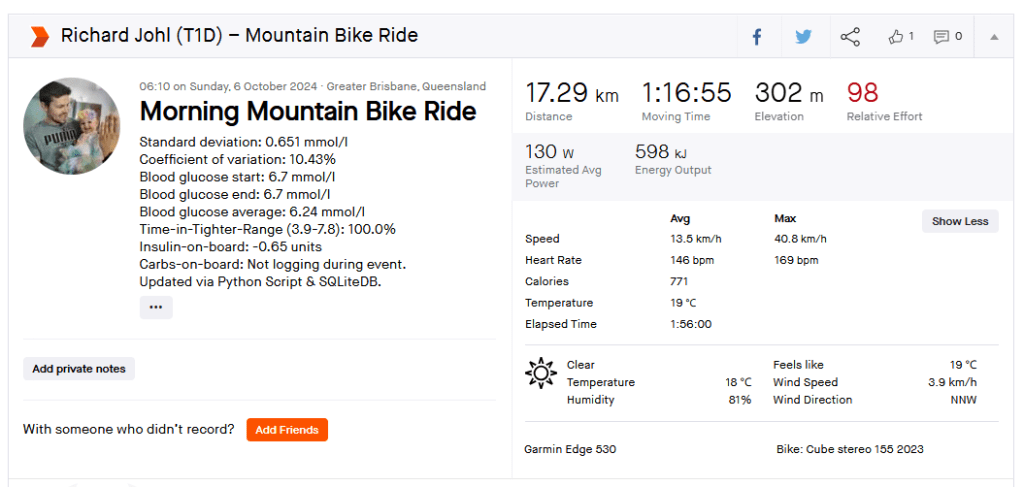
Strava diabetic stats
I wanted to see diabetic statistics for each event in Strava, so I wrote a script to update the description field with some data I calculating in the Python tool. The script will check to see if the description field is populated and only update records that have no data in the description field.
It’s spring, and after a brief ‘almost two months’ of going off the reservation snacking at all times of day and barely exercising, I decided to check my weight. I discovered I had picked up a few kilograms since my last weigh in. After learning this, I decided that it was time for me to get my life back together and start another 30 day challenge. I find these great to provide the reason to get back into a routine.
I know that setting unrealistic goals (like losing 5kgs) isn’t going to work, so I’m going to break down my plan in to nutrition, exercise and diabetes goals.
Exercise
My plan for the month is to gym three days a week, run a minimum of 2 times per week and to mountain bike at least once a week. (So I guess I lied about setting unrealistic goals 🙂 )
Nutrition
For my meals I plan to stick to my usual low-ish carbohydrate meals during the week and try to only go coo-coo bananas on the late night snacking over the weekend. I’ll start carb-counting again as this will almost always yield the best results. This will be supplemented with 2-3 liters of water, depending on length of cardio that day.
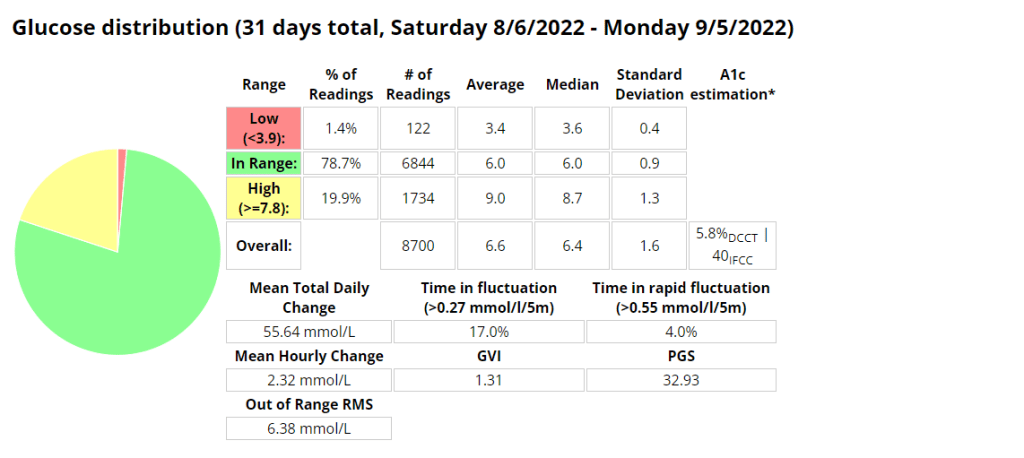
Diabetes
Above is a chart of my starting metrics. Lets see how quickly I can improve those values. Its going to be a little bit of an unfair test as I was not carb-counting during the above period.
We want to see the In range (Time-in-range) increase and the standard deviation decrease. By doing that the average and the A1c should follow. This will mostly be achieved by the diet component of the plan. The exercise component will allow me to eat more cabs and require less insulin, as well as improve circulation, sleep, blood pressure, mood, cholesterol, memory and overall mental and physical health.
I will check in with weekly updates to ensure I keep motivated and accountable.
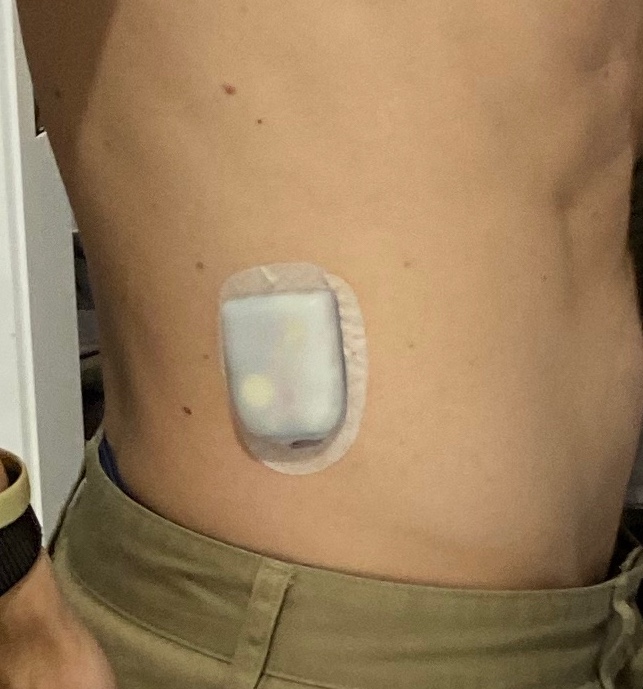
Its only been a week and already I feel so comforted by the barely audible click of the pump depressing the plunger in the mini pump at meal times or sporadically throughout the day. Its the sound of blood sugar control. What a week its been learning all I can about Pod changes and being woken up on day 3 by the Pod alarm alerting me its 8 hours before the Pod expires. Once expired it was interesting to note that the Pod functioned as per normal, apparently for another 8 hours.
I had a Pod on days 3 and 4 that was inserted into my leg that may have had a cannula issue, as I struggled to maintain my standard level of control.
Its been a lot easier to exercise focusing on enjoying the task rather than if I would break the pump or rip out a cannula. Having no wires makes it a lot easier to run or gym as I don’t have to worry about pump placement as much. Previously I needed to ensure I had pants with pockets or a belt clip available.
I have also found sleeping a little easier, as I can barely notice the pump If I roll over onto it.
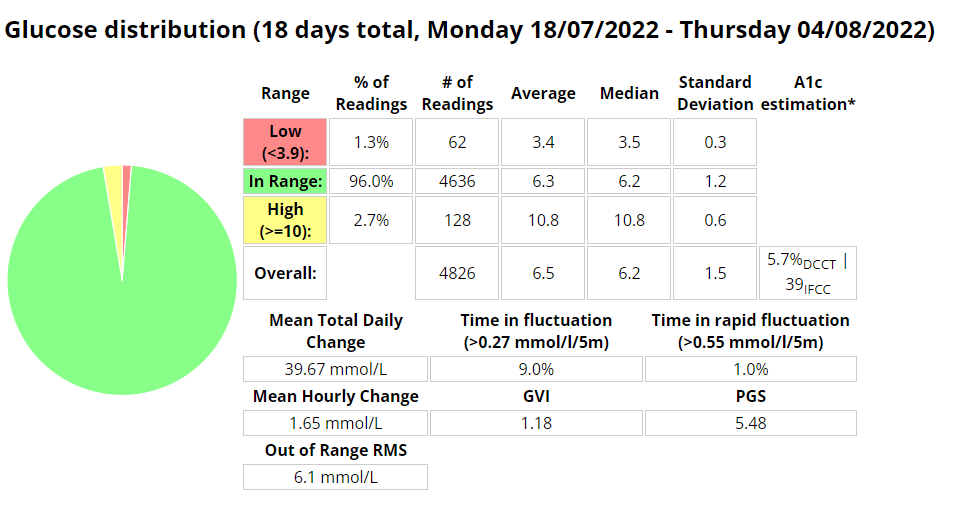
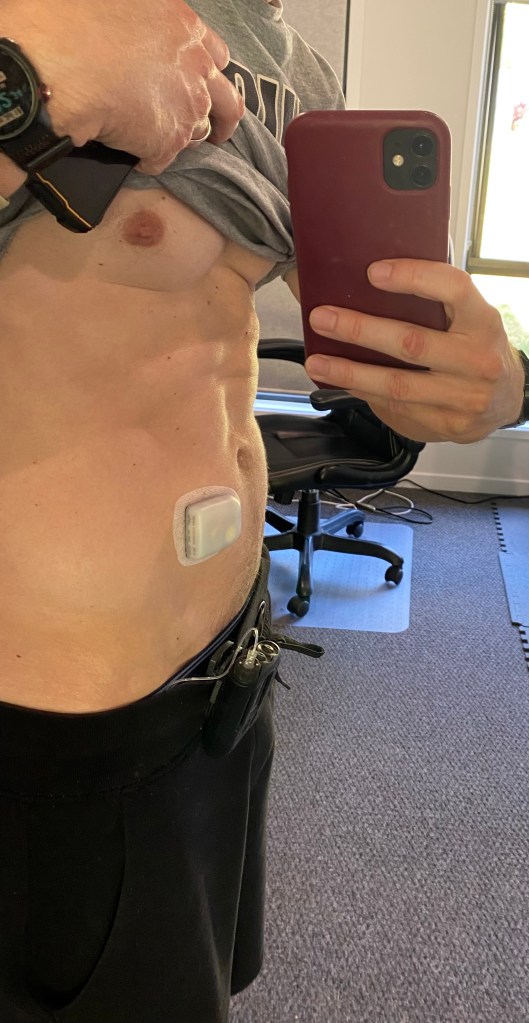
Flank insertion. Boost Omnipod – Time in Range (3.9 -7.8 mmol/l)Boost Omnipod – Time in Range (3.9 – 10 mmol/l)
Unannounced meals
I decided to test the system with unannounced meals consisting of 40g of carbs or less. I am a bit of a control freak when it comes to diabetes so I have been postponing testing this for a long time. The results were outstanding. I will be writing more about this in the future, including any automations I use or test.
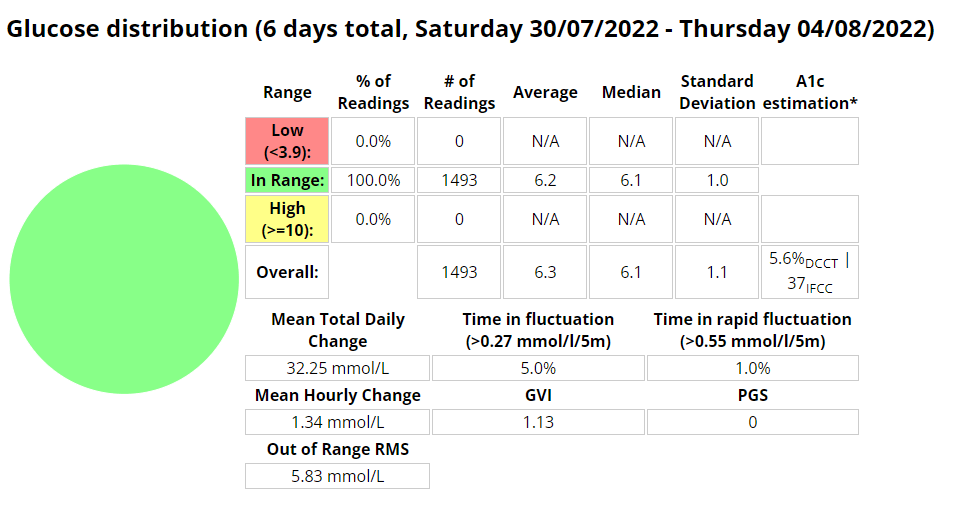
Boost Omnipod – UAM – Time in Range (3.9 -7.8 mmol/l)
Boost Omnipod – UAM – Time in Range (3.9 – 10 mmol/l)
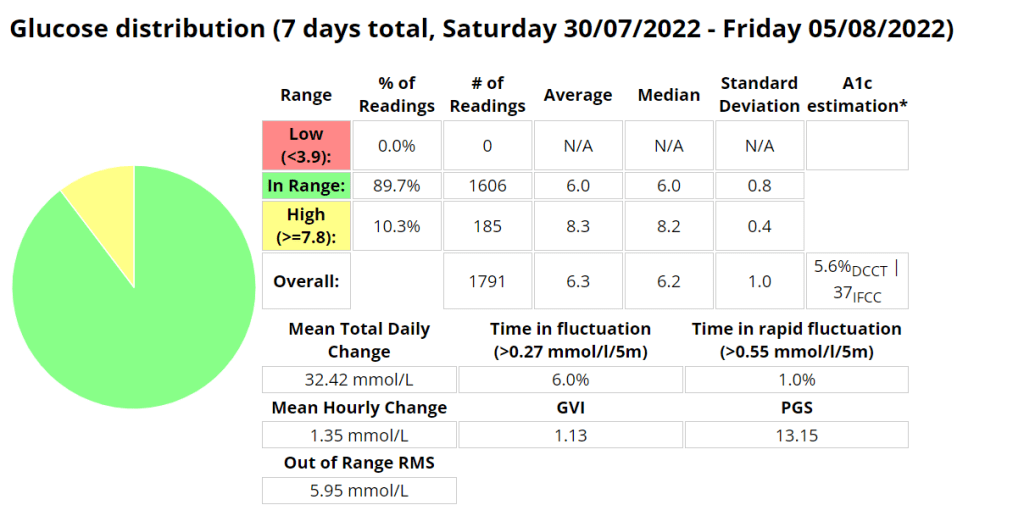
I started testing unannounced meals in Android APS on Saturday 30 July 2022. I am a bit of a control freak and really couldn’t believe that a system could manage my diabetes better than I could. I had more information available to me to make more informative decisions “I would tell myself”. But I seem to be wrong, well at least partly. I am using a branch of AAPS that delivers insulin early, but I found that managing protein and fat was more problematic than carbs seemed to be. Stubborn high blood sugar that seemed to take a few hours to correct. So I decided to do a little testing with automatons to try and improve those numbers.
Boost UAM stats (Time in range 3.9-7.8 mmol/l)
Boost UAM stats (Time in range 3.9-10 mmol/l)
Announcing carbs and pre-bolusing
Eerm…what? How is this possible? It seems with accurate carb counting I still cant account for digestion times as well as AAPS can.
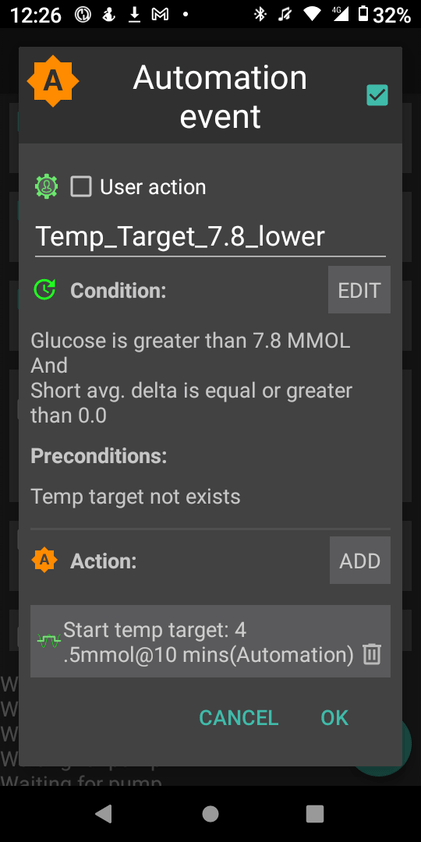
Automations
I use two (2) automations to try and manage my readings more closely. These automations are over and above the Boost logic that provides insulin earlier than the standard code.
The first automation simply sets a lower target when my reading is above 7.8 mmol/l AND not dropping. This allows AAPS to bring down my readings more quickly.
The second is to try and compensate for protein and fat in the low carb meals I eat. This automation will activate if
my reading is above 6.5 mmol/l AND
between meal times AND
my reading isn’t dropping AND
there is active resistance detected (not sure if this even matters)
My hypothesis is that the system can detect the resistance post the meal window but I need to test this assertion further.
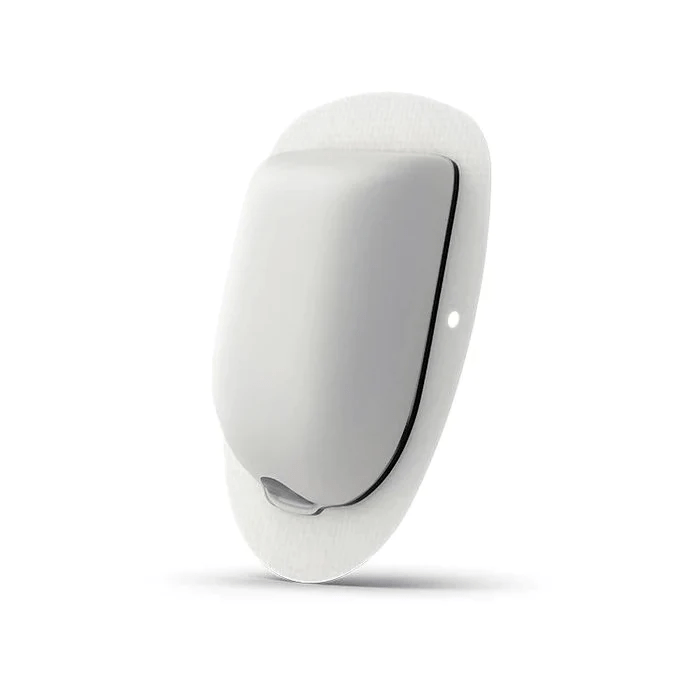
I decided to purchase the Omnipod Dash trial pack of 10 pods for $30 AUD to see what all the hype was about. It turns out the hype is warranted, as this is an incredible little system. I’m very excited to use the device under a multitude of conditions and I hope that my experience can be informative. My main testing criteria will be connectivity, recovery in the unlikely event a Pod is damaged, robustness during various activity, water resistance and general day-to-day activity including time with my two year old daughter.
Benefits
The pump system operates much the same as any other pump system available, with the main difference being that the pump and cannula are all part of the same physical unit. This is a huge advantage for sports, but can be noticeable while changing clothes, going to the toilet or during sexy time. The unit is so small its presence is barely noticeable.
Omnipod Dash.
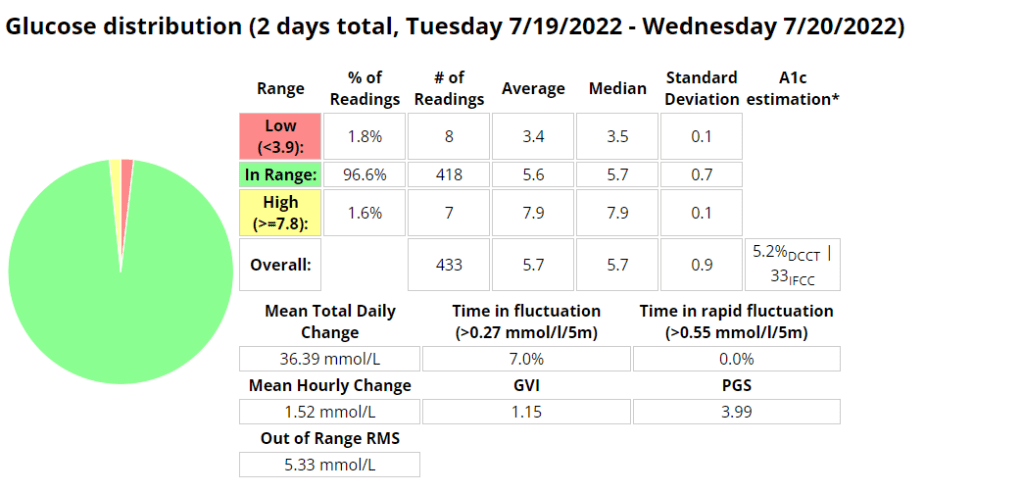
Sugar Management stats (So far)
I am very pleased (and surprised to be honest) that I am using 28% less insulin on the Pods with improved (+9.3%) blood sugar control (Time in Range 3.9-7.8 mmol/l). I noticed far fewer super micro boluses (SMBs) being administered than before, but maybe that is due to me letting AAPS do more of the work in managing my sugars through unannounced meals (UAM).
Management Stats from Nightscout for the duration of the experiment so far. TIR = 3.9-7.8 mmol/l
Total daily dose (TDD) and carbs average for the duration of the experiment.
Note: I am not adding in all the carbs I am eating as I am using announced meals in AAPS.
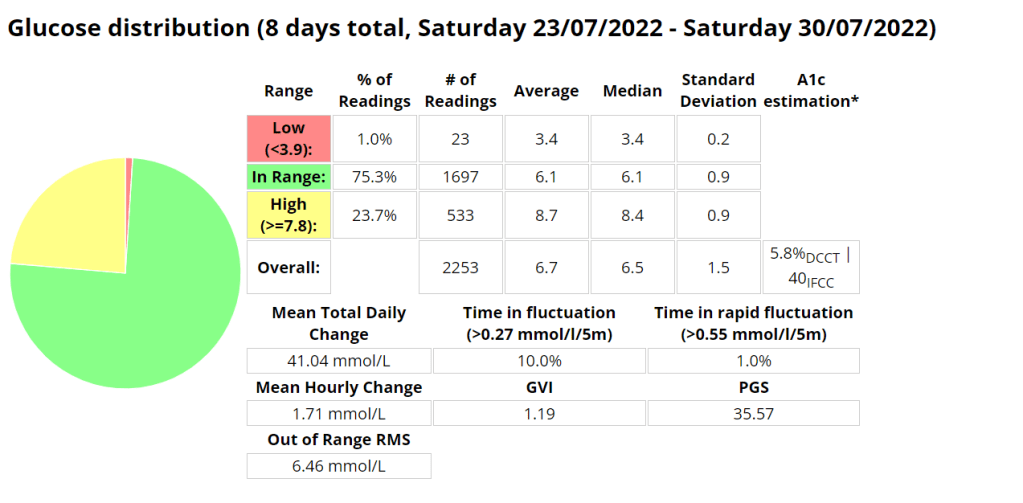
The Ambulatory Glucose Profile (AGP) enables retrospective analysis of dense data, trends and patterns for the duration of the experiment. Management Stats from Nightscout for the week prior to the experiment so far. TIR = 3.9-7.8 mmol/l
Total daily dose (TDD) and carbs average for the week prior to the experiment.
The Ambulatory Glucose Profile (AGP) enables retrospective analysis of dense data, trends and patterns for the week prior to the experiment. Management Stats from Nightscout for the duration of the experiment so far. TIR = 3.9-10 mmol/l
Screenshot from AAPS highlighting the SMB’s.
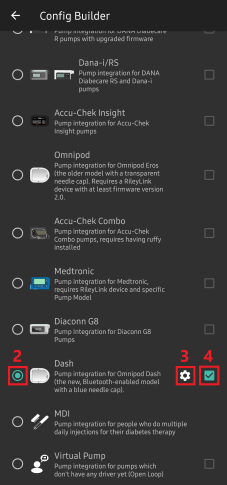
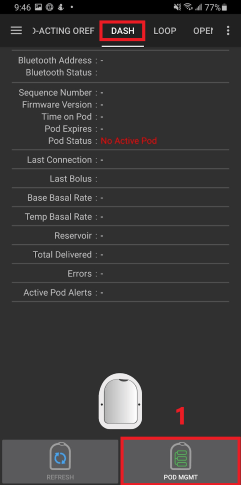
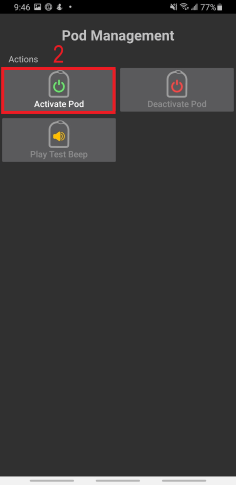
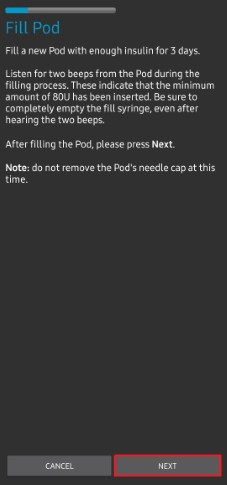
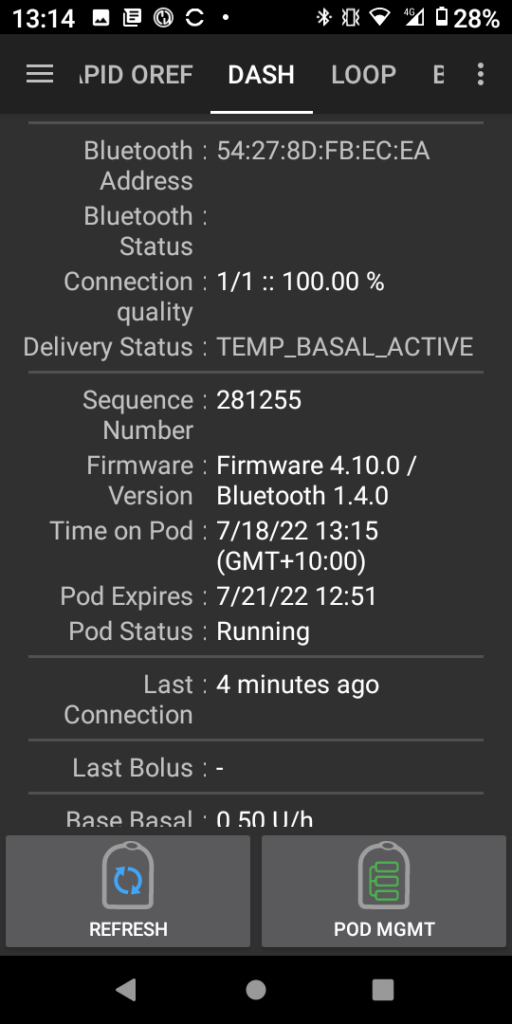
Android APS Setup
Setup of the Pod system in Android APS (AAPS) Boost Master 3.6.4 was surprisingly easy and intuitive. I just followed the Prompts after going to the configuration builder and selecting Dash as the pump.Its a very similar process for Eros pods, with the added requirement to pair the OrangeLink / RileyLink device.
I had an error starting the pod, but after hitting retry multiple times the pod activated and all was working as expected
Exercise
Exercise has been a lot more enjoyable without all the wires and having to worry about pump placement or damage. If I mountain bike and fall off (which happens every now and again) I lose one pod, and not an entire pump. Having more pocket space and less to carry is an added benefit.
Whats next?
I plan to test the pod while resistance training, mountain biking, running and the most intense sport I play, wrangling my two year old. If she cant destroy them, they are indestructible 🙂